Chapter 4. Classic Trend-Following Patterns
Trend following, a concept so simple yet so complicated. It may be easy not to worry about timing the market and just riding it, but the reality is that doing so can be challenging due to a plethora of random variables impacting the price. A steadily rising market may get destabilized by one economic or political event but then continue to move smoothly, discombobulating the traders who got stopped out during the volatility tsunami.
This chapter covers the classic (already known and established in the world of technical analysis) trend-following candlestick patterns. These are simple and complex configurations that have been around since the dawn of technical analysis and are taught in many introductory and advanced technical analysis courses. The purpose of this chapter is to create the patternsâ objective conditions and back-test them so that you can form a basic opinion about their frequency and predictability. Some patterns may occur quite often, while others occur once in a blue moon, thus hindering the ability to properly judge them.
As previously mentioned, the way I back-test the patterns is to assume that I initiate the buy or sell position upon the next open after having validated the signal on the previous close. The time frame chosen for the back-tests in this book is hourly.
The Marubozu Pattern
The first classic trend-following pattern is the Marubozu. The word refers to baldness or close-cropped head in Japanese, and you should soon understand why.
It is relatively easy to distinguish between Marubozu candlesticks and normal candlesticks because Marubozu candlesticks do not have any wicks. This means that a bullish Marubozu candlestick has the same open and low price as well as the same close and high price. In contrast, a bearish Marubozu candlestick has the same open and high price as well as the same close and low price. Figure 4-1 shows these two versions of a Marubozu candlestick.

Figure 4-1. On the left, a bullish Marubozu candlestick; on the right, a bearish Marubozu candlestick
The Marubozu pattern typically occurs during shorter time frames, as candles have less time to fluctuate and go out of their bounds. This can be seen when analyzing 1-minute and 5-minute charts and comparing them to daily charts.
Note
A candlestick has more probability to assume a Marubozu pattern when it has less time between the open and close prices.
Before you use any pattern, you must understand the reason for its existence. After all, patterns are not discovered randomly;Â they must have a rationale behind them. More important, you need to know why you should expect a certain reaction after the validation of the pattern.
The answer lies in market psychology, which leaves its footprints everywhere so that focused and knowledgeable traders pick up on any hints and ride (or fade) the move.
When the market is in a strong uptrend, it rarely makes lower lows and generally closes around the highs due to the sheer force of demand for the underlying security. The maximum force of demand in one candlestick is demonstrated by the absence of a low and by a close at the high, and this is precisely what the bullish Marubozu is all about. When an asset closes at the high price, you get the signal that the buyers are hungry for more, and when no low is lower than the open price, you should have further conviction that there is no interest in selling since no one has managed to push the price lower than its opening.
Similarly, when the market is in a strong downtrend, it rarely makes higher highs and generally closes around the lows due to the overwhelming force of supply for the underlying security. The maximum force of supply in one candlestick is demonstrated by the absence of a high and a close at the low, as demonstrated by the bearish Marubozu.
Note
The bullish Marubozu candlestick is the most powerful representation of a bullish activity, while the bearish Marubozu candlestick is the most powerful representation of a bearish activity.
Detecting the Marubozu pattern can be tricky in some markets that use more than a few decimal points because of the probability of occurrence. For instance, in the currencies market, if you use five decimals on EURUSD, you are likely to not find any Marubozu patterns anytime soon, but when you stick to the usual, less-accurate convention of four decimals (see Chapter 2), you start seeing the pattern more often. This holds true for all markets; therefore, to be able to analyze this pattern, you need to make a small tweak with regard to decimals.
Figure 4-2 shows a clean chart on USDCHF with the rounding function applied as follows:
my_data=rounding(my_data,4)
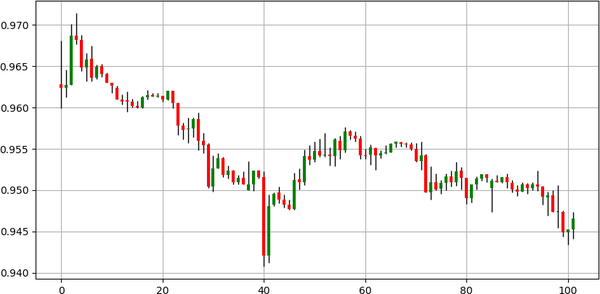
Figure 4-2. Candlestick chart on USDCHF
The next step is to code the signal function.
Note
The signal function is the core of the algorithm, as it is in charge of finding the patterns and pinpointing them chronologically and, therefore, outputting buy and sell signals according to specific conditions.
Algorithmically, the conditions need to be as follows:
- If the close price is greater than the open price, the high price equals the close price, and the low price equals the open price, then print 1 in the next row of the column reserved for buy signals.
- If the close price is lower than the open price, the high price equals the open price, and the low price equals the close price, then print â1 in the next row of the column reserved for sell signals.
In the Python language, use the following syntax to code the Marubozu signal function:
defsignal(data,open_column,high_column,low_column,close_column,Âbuy_column,sell_column): Âdata=add_column(data,5)  Â  Â Âforiinrange(len(data)): Â    Â   Âtry:    Â     Â# Bullish pattern     Âifdata[i,close_column]>data[i,open_column]andÂdata[i,high_column]==data[i,close_column]and\      Âdata[i,low_column]==data[i,open_column]andÂdata[i,buy_column]==0:         Â         Âdata[i+1,buy_column]=1          Â     Â# Bearish pattern     Âelifdata[i,close_column]<data[i,open_column]anddata[i,high_column]==data[i,open_column]and\       Âdata[i,low_column]==data[i,close_column]andÂdata[i,sell_column]==0:         Â         Âdata[i+1,sell_column]=-1          Â   ÂexceptIndexError:      Â     Âpass    Â Âreturndata
Figure 4-3 shows the trades generated on EURUSD following the signals given by the function.Â
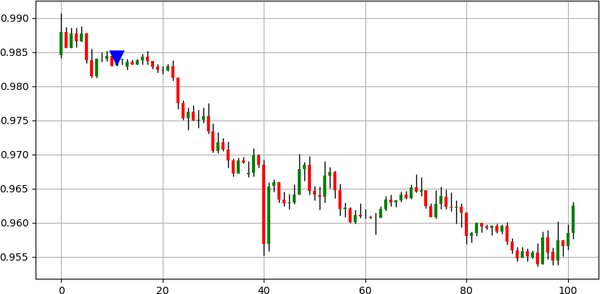
Figure 4-3. Signal chart on EURUSD
Upward-pointing arrows refer to bullish signals, while downward-pointing arrows refer to bearish signals. Figure 4-4 shows another example of the signals on USDCHF.
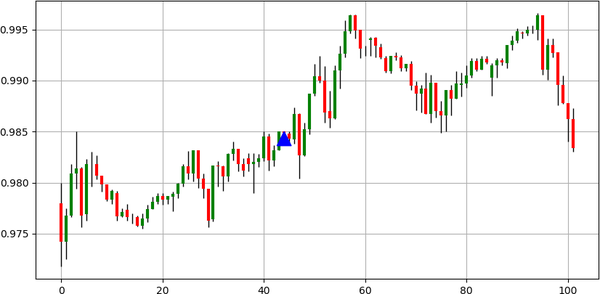
Figure 4-4. Signal chart on USDCHF
Letâs now back-test the pattern using the performance evaluation metrics discussed in Chapter 2.
Table 4-1 shows the performance summary on the Marubozu pattern. The trading conditions are as follows:
- The entry is done on the next open price after the validation of the signal on the current close price.
- The exit is done upon getting another signal in either direction (bullish or bearish).
- The transaction costs are omitted from the performance evaluation metrics.
- No risk management system is used.
Note
A risk management system entails the use of simple and complex order management techniques that regulate the maximum loss and expected targets.
|
Asset |
Hit Ratio |
Profit Factor |
Risk-Reward Ratio |
Signals |
|---|---|---|---|---|
|
EURUSD |
47.14% |
1.06 |
1.19 |
963 |
|
USDCHF |
47.01% |
0.95 |
1.07 |
1355 |
|
GBPUSD |
47.27% |
0.79 |
0.89 |
605 |
|
USDCAD |
49.06% |
0.99 |
1.03 |
958 |
|
BTCUSD |
47.81% |
1.38 |
1.51 |
433 |
|
ETHUSD |
39.76% |
0.93 |
1.41 |
3687 |
|
GOLD |
43.33% |
0.96 |
1.25 |
8443 |
|
S&P500 |
41.92% |
0.66 |
0.91 |
260 |
|
FTSE100 |
50.00% |
1.09 |
1.09 |
90 |
The back-tested assets show that the Marubozu pattern is relatively rare and does not seem to add great value. All of the predictions are random as evidenced by the hit ratio. A hit ratio around 50% means that you are as likely to be right as you are to be wrong.
Similarly, the profit factor shows that you are barely generating gross profits to cover gross losses. This is amplified when accounting for transaction costs. A profit factor close to 1.00 is insignificant and is unlikely to give more information as to whether the pattern performs well or not.
If you analyze the risks taken by trading the pattern, you would find that it confirms the randomness of the strategy. By having an average of around 1.00, you are basically risking $1 to earn $1, which can go either way. Finally, the signals are not very frequent but are above the 30 threshold, which is needed to make any statistical interpretations.
The main conclusion is that the Marubozu pattern is unlikely to deliver a profitable strategy on its own. Nevertheless, keep in mind the following points for the back-tests:
- The positions are taken solely based on one pattern and are not combined with other confirming indicators. Most of the time, patterns work better when combined with other techniques and indicators.
- The back-tested universe is limited;Â therefore, it is possible that the pattern works well on other markets.
- The back-tested time frame is limited since the results reflect only the hourly time frame. Remember, other time frames exist such as five-minute, daily, and weekly.Â
- The exit technique is variable and depends on the next signal, which may not come before long. Other exit techniques may be more suited such as a fixed one or one that depends on volatility.
Hence, even though the back-test gives a general approximate idea on the ability of the patterns, you must always understand its limitations.
The Three Candles Pattern
The Three Candles pattern is a trend-confirmation configuration where the signal is given after printing three same-color candles that have a minimum specified size. A bullish Three Candles pattern is also called the Three White Soldiers and has three big bullish candles with each having a close higher than the previous one. In contrast, a bearish Three Candles pattern is called the Three Black Crows and has three big bearish candles, with each having a close lower than the previous one.
Note
The names Three White Soldiers and Three Black Crows come from the fact that candlesticks were previously charted in black and white with the former representing bearish candles and the latter representing bullish candles.
Figure 4-5 illustrates the Three White Soldiers. Notice that every close price is greater than the one preceding it.
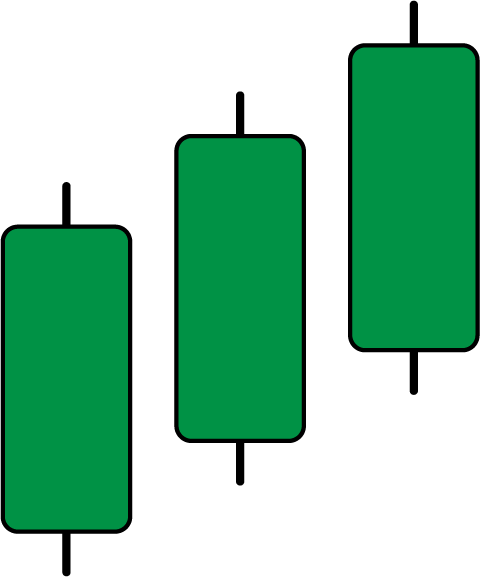
Figure 4-5. A Three White Soldiers pattern
Figure 4-6 illustrates the Three Black Crows. Notice that every close price is lower than the one preceding it.
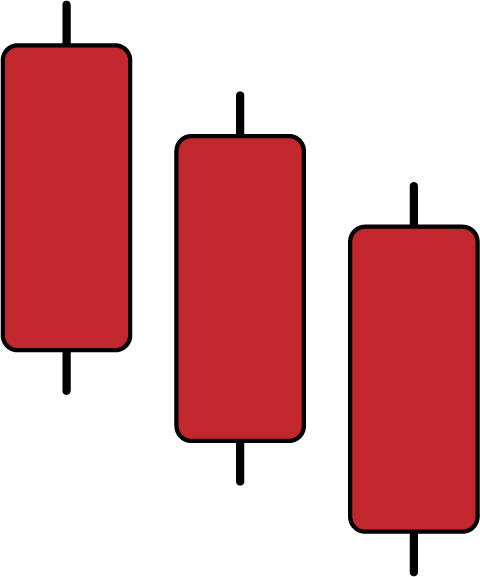
Figure 4-6. A Three Black Crows pattern
The intuition of the pattern is quite simple. It stems from a type of psychological bias called herding, where market participants follow the trend because others are doing so. This does not mean that the pattern is based on human deficiency and lack of effort;Â it simply refers to a common behavior observed in humans where they tend to follow the aggregate trend.
Note
People follow the latest fashion trend because it delivers a psychological reward. Trend-following traders follow the latest trend because they believe it delivers a financial reward or because they have a form of fear of missing out (FOMO).
Financial herding can be defined as the act of following the majority in an attempt to profit as much as possible from the current persistent move. Hence, in essence, herding is actually trend following. When you see three big candles within the same direction, you typically interpret it as a healthy move filled with motivation, conviction, and desire to continue in the same direction. Compare these three big candles to a timid move of small candles where their type alternates between bullish and bearish.
Humans are attracted to confidence and strength and are more likely to follow it. A pattern of three healthy candlesticks is the embodiment of strength and confidence.
Detecting this pattern is easy but must have strict algorithmic rules that dictate more than just three big candles with the same colors; otherwise, you would have plenty of signals. Algorithmically, the conditions need to be as follows:
- If the latest three close prices are each greater than the close prices preceding them and each candlestick respects a minimum body size,1Â then print 1 in the next row of the column reserved for buy signals.
- If the latest three close prices are each lower than the close prices preceding them and each candlestick respects a minimum body size, then print â1 in the next row of the column reserved for sell signals.
The body of the candlestick is the difference between the close and open prices in absolute terms. Therefore, to find the body, follow this mathematical formula:
defsignal(data,open_column,close_column,buy_column,sell_column): Âdata=add_column(data,5)  Â Âforiinrange(len(data)):    Â   Âtry:     Â     Â# Bullish pattern     Âifdata[i,close_column]-data[i,open_column]>bodyand\      Âdata[i-1,close_column]-data[i-1,open_column]>\Âbodyanddata[i-2,close_column]-\data[i-2,open_column]>bodyanddata[i,close_column]>\Âdata[i-1,close_column]anddata[i-1,close_column]>\Âdata[i-2,close_column]anddata[i-2,close_column]>\Âdata[i-3,close_column]anddata[i,buy_column]==0:         Â         Âdata[i+1,buy_column]=1          Â    ÂÂ# Bearish pattern     Âelifdata[i,close_column]-data[i,open_column]>bodyand\      Âdata[i-1,close_column]-data[i-1,open_column]>\             Âbodyanddata[i-2,close_column]-\             Âdata[i-2,open_column]>bodyanddata[i,close_column]\<data[i-1,close_column]anddata[i-1,close_column]\<data[i-2,close_column]anddata[i-2,close_column]\<data[i-3,close_column]anddata[i,sell_column]==0:         Â         Âdata[i+1,sell_column]=-1          Â   ÂexceptIndexError:      Â     Âpass
The function applies the conditions shown previously in order to generate buy and sell signals. The bodies of the candlestick may actually hinder the objectivity of this pattern to some extent since it differs according to volatility. Theoretically, the Three Candles pattern merely refers to the candles as âbigâ and does not indicate how size should be adjusted; therefore, I use fixed values depending on the asset and the time frame (which is hourly). Table 4-2 shows a summary.
|
Asset |
Body |
Type |
|---|---|---|
|
EURUSD |
0.0005 |
USD |
|
USDCHF |
0.0005 |
CHF |
|
GBPUSD |
0.0005 |
USD |
|
USDCAD |
0.0005 |
CAD |
|
BTCUSD |
50 |
USD |
|
ETHUSD |
10 |
USD |
|
GOLD |
2 |
USD |
|
S&P500 |
10 |
Points |
|
FTSE100 |
10 |
Points |
You can also adjust the variable body depending on volatility, but I will show you another pattern that adjusts to volatility. For now, I will keep the theoretical conditions of the classic patterns untouched and leave the creativity to the modern patterns in Chapters 5 and 7.
Figure 4-7 shows a signal chart on EURUSD.
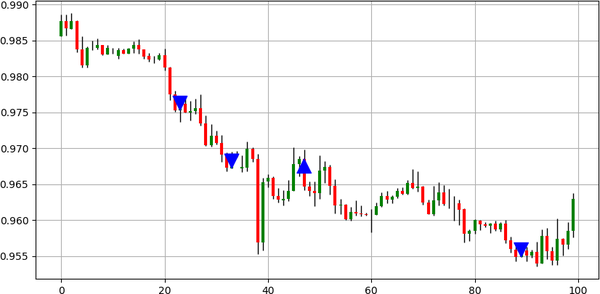
Figure 4-7. Signal chart on EURUSD
Table 4-3 shows the performance summary of the Three Candles pattern.
|
Asset |
Hit Ratio |
Profit Factor |
Risk-Reward Ratio |
Signals |
|---|---|---|---|---|
|
EURUSD |
61.45% |
1.05 |
0.66 |
2672 |
|
USDCHF |
62.04% |
0.98 |
0.60 |
2005 |
|
GBPUSD |
61.53% |
0.96 |
0.60 |
3611 |
|
USDCAD |
60.97% |
0.97 |
0.62 |
2844 |
|
BTCUSD |
62.30% |
1.00 |
0.61 |
1085 |
|
ETHUSD |
61.22% |
0.96 |
0.61 |
392 |
|
GOLD |
61.11% |
1.04 |
0.66 |
828 |
|
S&P500 |
65.99% |
1.10 |
0.57 |
741 |
|
FTSE100 |
64.54% |
0.97 |
0.53 |
1018 |
Even though the results show a relatively higher hit ratio than with the Marubozu pattern, you have to be careful as the hit ratio as a standalone metric is not useful. You must look at it in parallel to the risk-reward ratio to understand if the predictive ability can be profitable or not.
The first thing you notice is the crucially low risk-reward values, which range between 0.53 and 0.66. This is the first red light that the hit ratio is not impressive at all. In fact, it may not even be enough to deliver positive results.
The Tasuki Pattern
The Tasuki pattern is a trend-confirmation configuration where the market gives a continuation signal after an unfilled gap. Before I go any further, you need to understand what gaps are.
Gaps form an important part of price action. They vary in rareness from market to market. For instance, in the currencies market, they usually happen on the open of the retail market following the weekend or whenever there is a big announcement. In stocks, gaps are fairly common from one day to another.
A gap is a discontinuation or a hole between two successive close prices mainly caused by low liquidity. When a market is trading at $100 and suddenly trades at $102 without ever quoting at $101, it has formed a bullish gap. This can be seen in the charts where it appears to have a missing piece between candlesticks. Figure 4-8 illustrates a bullish gap. Notice the empty space between candlesticks.
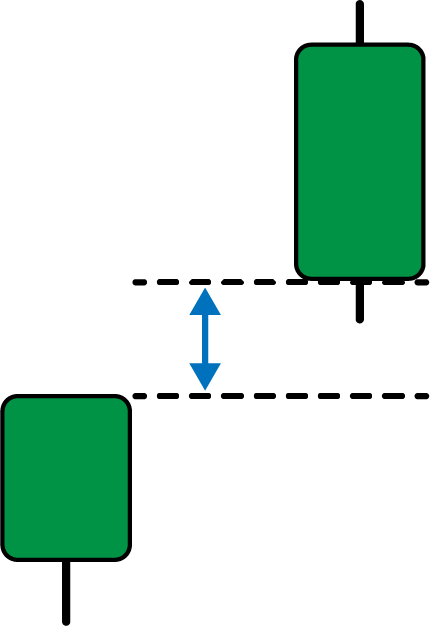
Figure 4-8. A bullish gap
Gaps can occur due to fundamental and technical reasons, but you should be interested in identifying and trading on them regardless of the reason for their appearance. In the currencies market, the visible gaps are the ones that occur over the weekend. Figure 4-9 illustrates a bearish gap.
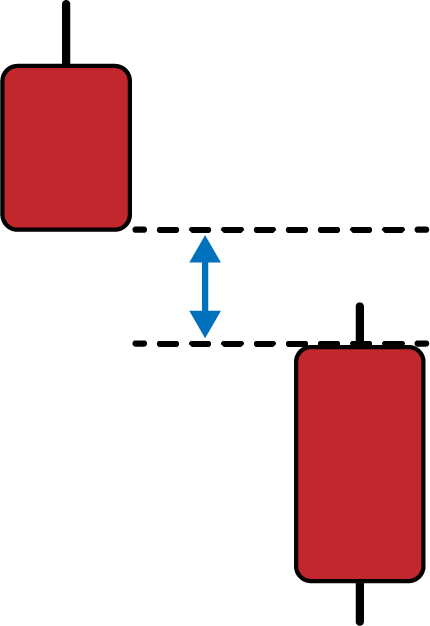
Figure 4-9. A bearish gap
There are different types of gaps, and categorizing them can be difficult when they appear due to hindsight bias (a cognitive bias that causes the analyst to overestimate the predictive power of a technique due to already knowing the outcome):
- Common gaps
- These generally occur in a sideways market. They are likely to be filled because of the marketâs mean-reversion dynamic.
- Breakaway gaps
- These generally resemble a common gap, but the gap occurs above a graphical resistance or below a graphical support. They signal acceleration in the new trend.
- Runaway gaps
- These generally occur within the trend, but confirm it more;Â therefore, this is a continuation pattern.
- Exhaustion gaps
- These generally occur at the end of a trend and close to a support or resistance level. It is a reversal pattern.
There is no sure way to determine the type of gap the moment it occurs, but that is not essential in detecting the Tasuki pattern. The pattern is named after an accessory used to hold the Japanese kimono dress, but why is unclear.
A bullish Tasuki pattern is composed of three candlesticks where the first one is a bullish candlestick, the second one is another bullish candlestick that gaps over the first candlestick, and the third candlestick is bearish but does not close below the close of the first candlestick.
Figure 4-10 illustrates a bullish Tasuki.
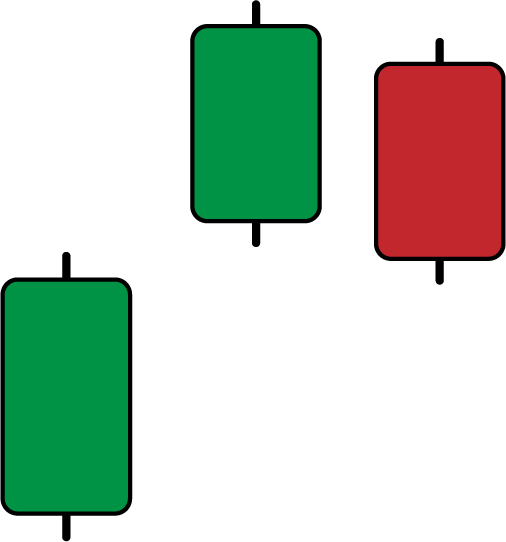
Figure 4-10. A bullish Tasuki
A bearish Tasuki pattern (see Figure 4-11) is the mirror image of the bullish Tasuki. It is composed of three candlesticks where the first one is a bearish candlestick, the second one is another bearish candlestick that gaps under the first candlestick, and the third candlestick is bullish but does not close above the close of the first candlestick.
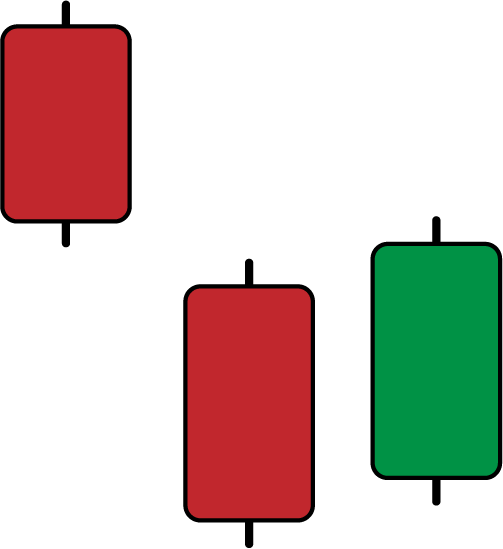
Figure 4-11. A bearish Tasuki
The intuition of the pattern relates to the breakout principle where breaching a certain threshold, be it support or resistance, should have a gravitational pull toward the threshold before releasing it to the initial direction.
Whenever you see a market gapping up followed by a bearish candlestick that does not quite close the gap, it may be a signal that the sellers are not strong enough to take the lead, giving a bullish bias. Similarly, whenever you see a market gapping down followed by a bullish candlestick that does not quite close the gap, it may be a signal that the buyers are not strong enough to take the lead, giving a bearish bias.
Algorithmically, the conditions need to be as follows:
- If the close price from two periods ago is greater than the open price from two periods ago, the open price from one period ago is greater than the close two periods ago, the close price from one period ago is greater than the open price from one period ago, and the current close price is greater than the close price two periods ago, print 1 in the next row of the column reserved for buy signals.
- If the close price from two periods ago is lower than the open price from two periods ago, the open price from one period ago is lower than the close two periods ago, the close price from one period ago is lower than the open price from one period ago, and the current close price is lower than the close price two periods ago, then print â1 in the next row of the column reserved for sell signals.
defsignal(data,open_column,close_column,buy_column,sell_column): Âdata=add_column(data,5)  Â Âforiinrange(len(data)):    Â   Âtry:     Â  Â  Â# Bullish pattern     Âifdata[i,close_column]<data[i,open_column]and\      Âdata[i,close_column]<data[i-1,open_column]and\      Âdata[i,close_column]>data[i-2,close_column]and\      Âdata[i-1,close_column]>data[i-1,open_column]and\      Âdata[i-1,open_column]>data[i-2,close_column]and\      Âdata[i-2,close_column]>data[i-2,open_column]:         Â         Âdata[i+1,buy_column]=1          Â     Â# Bearish pattern     Âelifdata[i,close_column]>data[i,open_column]and\       Âdata[i,close_column]>data[i-1,open_column]and\       Âdata[i,close_column]<data[i-2,close_column]and\       Âdata[i-1,close_column]<data[i-1,open_column]and\       Âdata[i-1,open_column]<data[i-2,close_column]and\       Âdata[i-2,close_column]<data[i-2,open_column]:         Â         Âdata[i+1,sell_column]=-1          Â   ÂexceptIndexError:      Â     Âpass    Â Âreturndata
It is time to discuss the back-testing results (see Table 4-4). Keeping in mind that the pattern is quite rare, you should approach the results with a form of statistical doubt.
|
Asset |
Hit Ratio |
Profit Factor |
Risk-Reward Ratio |
Signals |
|---|---|---|---|---|
|
EURUSD |
58.06% |
0.97 |
0.70 |
31 |
|
USDCHF |
59.46% |
1.92 |
1.31 |
37 |
|
GBPUSD |
48.72% |
0.93 |
0.98 |
39 |
|
USDCAD |
40.00% |
0.61 |
0.91 |
40 |
|
BTCUSD |
53.57% |
0.89 |
0.77 |
56 |
|
ETHUSD |
50.00% |
1.03 |
1.03 |
30 |
|
GOLD |
51.49% |
1.01 |
0.95 |
101 |
|
S&P500 |
36.36% |
0.33 |
0.58 |
11 |
|
FTSE100 |
50.00% |
1.56 |
1.56 |
14 |
The results confirm the initial hypothesis: the pattern is quite rare. For it to appear only 31 times over the course of around 10 years on the hourly values of EURUSD is extremely low.
The issue with rare patterns is that it is unclear how they made it into the literature, as there was not enough (and is not enough) data to analyze the results and the predictability of trades taken on the pattern.
The results are mostly mixed to negative with statistical robustness unlikely due to the low number of trades. The Tasuki pattern may have a logical intuition but lacks in terms of hard data.
The Three Methods Pattern
The Three Methods pattern is a complex configuration mainly composed of five candlesticks. The rising Three Methods pattern should occur in a bullish trend with the first candlestick being a big-bodied bullish one followed by three small-bodied bearish candlesticks typically contained within the range of the first candlestick. To confirm the pattern, one last big bullish candlestick must be printed with a close higher than the first candlestickâs high. This is just like a bullish breakout of a small consolidation.
Figure 4-12 illustrates a rising Three Methods.
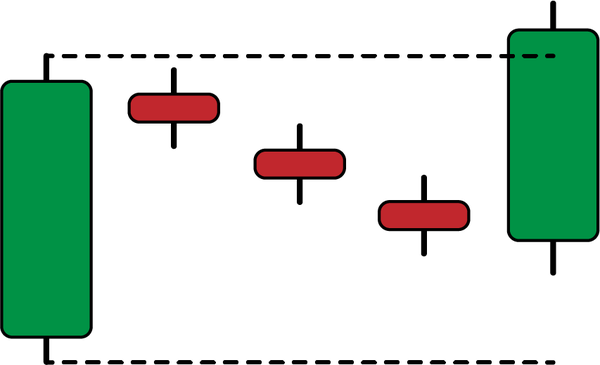
Figure 4-12. A rising Three Methods pattern
The falling Three Methods pattern should occur in a bearish trend with the first candlestick being a big-bodied bearish candlestick followed by three small-bodied bullish candlesticks typically contained within the range of the first candlestick. To confirm the pattern, one last big bearish candlestick must be printed with a close lower than the first candlestickâs low. This is just like a bearish breakout of a small consolidation. Figure 4-13 illustrates a falling Three Methods.
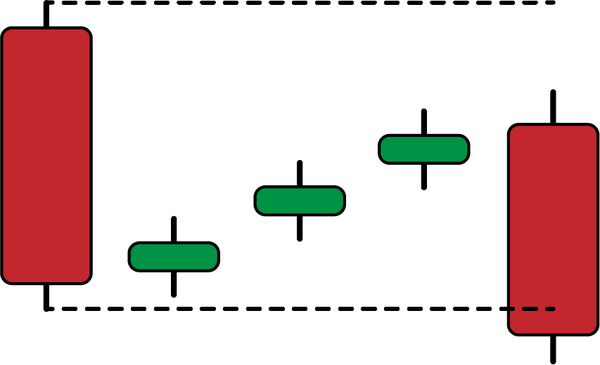
Figure 4-13. A falling Three Methods pattern
Psychologically speaking, the pattern relates to the concept of surpass or break as a confirmation of the initial move. Traders generally push the prices up until they begin to book their profits and thus close out of the positions. This activity has a smoothing effect on the price and should stabilize it through a phase called correction or consolidation.
In case the initial traders resume their buying or selling activity and manage to go beyond the range of consolidation, you can have a certain confidence that the move should continue.
The signal function for the Three Methods candlestick pattern can be written as follows:
defsignal(data,open_column,high_column,low_column,close_column,Âbuy_column,sell_column): Âdata=add_column(data,5)  Â Âforiinrange(len(data)):    Â   Âtry:     Â    Â# Bullish pattern     Âifdata[i,close_column]>data[i,open_column]and\      Âdata[i,close_column]>data[i-4,high_column]and\      Âdata[i,low_column]<data[i-1,low_column]and\      Âdata[i-1,close_column]<data[i-4,close_column]and\      Âdata[i-1,low_column]>data[i-4,low_column]and\      Âdata[i-2,close_column]<data[i-4,close_column]and\      Âdata[i-2,low_column]>data[i-4,low_column]and\      Âdata[i-3,close_column]<data[i-4,close_column]and\      Âdata[i-3,low_column]>data[i-4,low_column]and\      Âdata[i-4,close_column]>data[i-4,open_column]:         Â         Âdata[i+1,buy_column]=1          Â    Â# Bearish pattern     Âelifdata[i,close_column]<data[i,open_column]and\       Âdata[i,close_column]<data[i-4,low_column]and\       Âdata[i,high_column]>data[i-1,high_column]and\       Âdata[i-1,close_column]>data[i-4,close_column]and\       Âdata[i-1,high_column]<data[i-4,high_column]and\       Âdata[i-2,close_column]>data[i-4,close_column]and\       Âdata[i-2,high_column]<data[i-4,high_column]and\       Âdata[i-3,close_column]>data[i-4,close_column]and\       Âdata[i-3,high_column]<data[i-4,high_column]and\       Âdata[i-4,close_column]<data[i-4,open_column]:         Â         Âdata[i+1,sell_column]=-1          Â   ÂexceptIndexError:      Â     Âpass    Â Âreturndata
Figure 4-14 shows a signal chart on USDCAD.
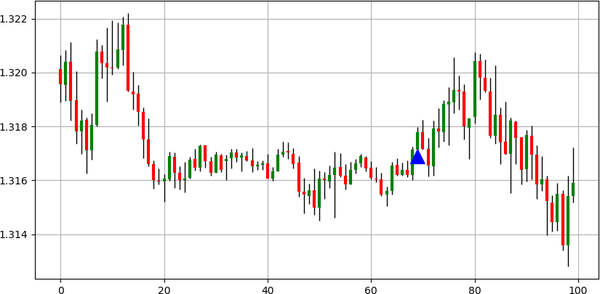
Figure 4-14. Signal chart on the USDCAD
The pattern is extremely rare and does not show much added value on its own. The results from the back-tests show very few signals generated even when making the conditions more flexible; therefore, this pattern remains mysterious.
Note
Depending on your data provider, some historical values may not exactly be the same and thus, you can see past patterns validated on data coming from a certain provider but not on data coming from another provider. This typically explains the slight differences in back-testing results when switching providers and brokers.
The Hikkake Pattern
Hikkake is a Japanese verb that means âto trickâ or âto trap,â and this pattern refers to an actual trap. The pattern is complex, being composed of around five candlesticks depending on the literature (some research shows that it could be a combination of multiple candlesticks but does not specify the number of candlesticks).
The bullish Hikkake (shown in Figure 4-15) starts with a bullish candlestick followed by a bearish candlestick completely embedded inside the first one. Then, two candlesticks must appear with a high that does not surpass the second candleâs high. Finally, a big bullish candlestick appears with a close that surpasses the high of the second candlestick. This serves as the validation of the pattern and the upside confirmation.
The bearish Hikkake starts with a bearish candlestick followed by a bullish candlestick completely embedded inside the first one. Then, two candlesticks must be printed with a low that does not surpass the second candleâs low. Finally, a big bearish candlestick must be printed with a close that breaks the low of the second candlestick. This serves as the validation of the pattern and the downside confirmation.
The psychology of the pattern is not hard to grasp even though it is subjective in nature. The term entrapment comes from the fact that a bullish Hikkake is historically a bearish trap for traders thinking that the market has seen a resistance and should continue lower. Therefore, whenever you see the final candlestick breaching the highs and validating the configuration, you can have a certain confidence that more strength is to come. This is because stops are getting taken out and because traders are looking at a market that is surpassing its resistance, which is theoretically a strong bullish signal.
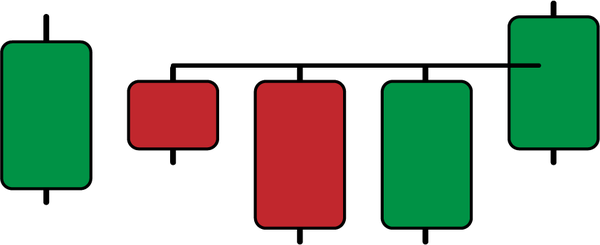
Figure 4-15. A bullish Hikkake
A bearish Hikkake (shown in Figure 4-16) can be compared to a bullish trap for traders who think that the market has seen a support and should now bounce. Therefore, whenever you see the final candlestick breaking the lows and validating the configuration, you can start changing the bias.
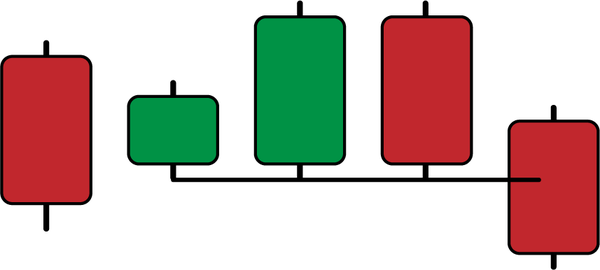
Figure 4-16. A bearish Hikkake
The signal function can be written as follows:
defsignal(data,open_column,high_column,low_column,close_column,Âbuy_signal,sell_signal): Âdata=add_column(data,5)  Â  Â Âforiinrange(len(data)):  Â   Âtry:    Â   Â Â# Bullish pattern     Âifdata[i,close_column]>data[i-3,high_column]and\       Âdata[i,close_column]>data[i-4,close_column]and\       Âdata[i-1,low_column]<data[i,open_column]and\       Âdata[i-1,close_column]<data[i,close_column]and\       Âdata[i-1,high_column]<=data[i-3,high_column]and\       Âdata[i-2,low_column]<data[i,open_column]and\       Âdata[i-2,close_column]<data[i,close_column]and\       Âdata[i-2,high_column]<=data[i-3,high_column]and\       Âdata[i-3,high_column]<data[i-4,high_column]and\       Âdata[i-3,low_column]>data[i-4,low_column]and\       Âdata[i-4,close_column]>data[i-4,open_column]:        Â         Âdata[i+1,buy_signal]=1        Â   Â Â# Bearish pattern     Âelifdata[i,close_column]<data[i-3,low_column]and\        Âdata[i,close_column]<data[i-4,close_column]and\        Âdata[i-1,high_column]>data[i,open_column]and\        Âdata[i-1,close_column]>data[i,close_column]and\        Âdata[i-1,low_column]>=data[i-3,low_column]and\        Âdata[i-2,high_column]>data[i,open_column]and\        Âdata[i-2,close_column]>data[i,close_column]and\        Âdata[i-2,low_column]>=data[i-3,low_column]and\        Âdata[i-3,low_column]>data[i-4,low_column]and\        Âdata[i-3,high_column]<data[i-4,high_column]and\        Âdata[i-4,close_column]<data[i-4,open_column]:    Â          Âdata[i+1,sell_signal]=-1         Â   ÂexceptIndexError:      Â     Âpass    Â Âreturndata
Figure 4-17 shows a generated signal on EURGBP. It is clear that this pattern is rare and does not have meaningful back-testing results.
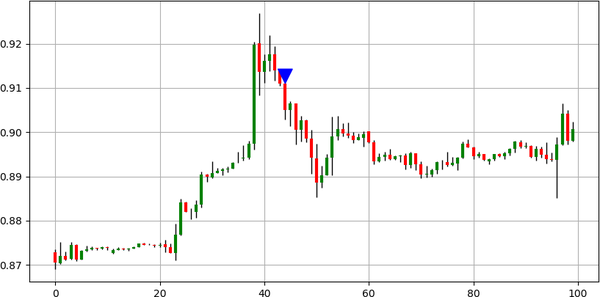
Figure 4-17. Signal chart on EURGBP
Because the pattern is quite rare, it does not have enough sufficient data to be evaluated properly. Surely, the conditions can be relaxed so that more signals appear, but theoretically, you would have to call it something else if you were to do that. Table 4-5 summarizes the performance.
|
Asset |
Hit Ratio |
Profit Factor |
Risk-Reward Ratio |
Signals |
|---|---|---|---|---|
|
EURUSD |
44.83% |
0.94 |
1.16 |
116 |
|
USDCHF |
47.66% |
0.74 |
0.81 |
107 |
|
GBPUSD |
49.57% |
1.55 |
1.57 |
115 |
|
USDCAD |
55.14% |
0.84 |
0.68 |
107 |
|
BTCUSD |
56.96% |
1.18 |
0.89 |
79 |
|
ETHUSD |
60.00% |
1.24 |
0.82 |
50 |
|
GOLD |
51.81% |
1.14 |
1.06 |
166 |
|
S&P500 |
83.33% |
6.01 |
1.20 |
12 |
|
FTSE100 |
53.33% |
2.06 |
1.80 |
15 |
The results show random performance, which likely means that the pattern is not predictive. The hit ratio of 83.33% on the S&P 500 is unlikely to be statistically correct since the algorithm detected only 12 signals in the past few years.
1 Remember, the Three Candles pattern is composed of three big candles. Therefore, you need to code the condition that they must have a minimum size.
Get Mastering Financial Pattern Recognition now with the O’Reilly learning platform.
O’Reilly members experience books, live events, courses curated by job role, and more from O’Reilly and nearly 200 top publishers.

