Chapter 4. The OpenTelemetry Architecture
Everyone knows that debugging is twice as hard as writing a program in the first place. So if you’re as clever as you can be when you write it, how will you ever debug it?
Brian W. Kernighan and P. J. Plauger1
OpenTelemetry consists of three kinds of components: instrumentation installed within applications, exporters for infrastructure such as Kubernetes, and pipeline components for sending all of this telemetry to a storage system. You can see how these components connect in Figure 4-1.
This chapter gives you a high-level overview of all the components that make up OpenTelemetry. After that, we’ll dive into the OpenTelemetry Demo application to see how the components fit together.
Application Telemetry
The most important source of telemetry is applications. This means that OpenTelemetry must be installed in every application for it to work properly. Regardless of whether you install it automatically by using an agent or manually by writing code, the components you’ll install are the same. Figure 4-2 shows how they fit together.
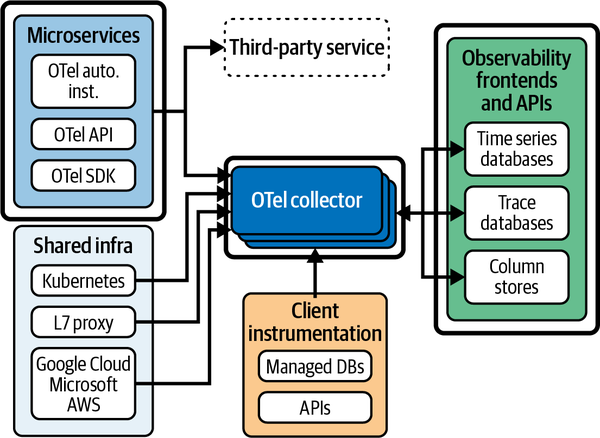
Figure 4-1. The relationship between OpenTelemetry and analysis components
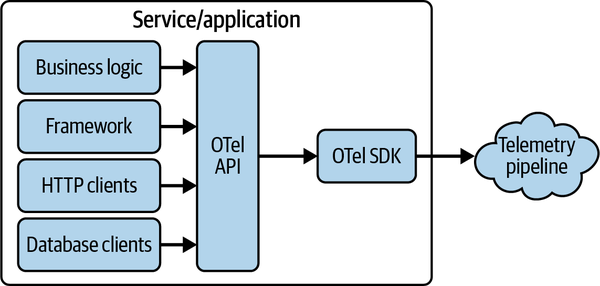
Figure 4-2. OpenTelemetry application architecture
Library Instrumentation
The most critical telemetry comes from OSS libraries such as frameworks, HTTP and RPC clients, and database clients. These libraries perform the heavy lifting in most applications, and often the telemetry from these libraries is sufficient to cover almost all the work that an application performs.
Today, most OSS libraries are not natively instrumented with OpenTelemetry. This means that the instrumentation for these libraries must be installed separately. OpenTelemetry provides instrumentation libraries for many popular OSS libraries.
The OpenTelemetry API
While library instrumentation is very useful, you will inevitably want to instrument critical pieces of application code and business logic. To do this, you use the OpenTelemetry API. The library instrumentation you install is also written with this API, so there is no fundamental difference between application instrumentation and library instrumentation.
In fact, the OpenTelemetry API has a special feature: it is safe to call even when OpenTelemetry is not installed within an application. This means that OSS libraries can include OpenTelemetry instrumentation that will automatically be enabled when OpenTelemetry is in use, and that will act as a zero-cost no-op when the library is installed in applications that don’t use OpenTelemetry. For more information on how to instrument OSS libraries, see Chapter 6.
The OpenTelemetry SDK
In order for OpenTelemetry API calls sent from libraries and application code to actually be processed, you must install the OpenTelemetry client. We refer to this client as the OpenTelemetry SDK. The SDK is a plug-in framework consisting of sampling algorithms, lifecycle hooks, and exporters that can be configured using environment variables or a YAML configuration file.
Instrumentation Is Critical!
When you think about installing OpenTelemetry in your application, it can be easy to think only about installing only the SDK. It’s important to remember that you also need instrumentation for all of your important libraries. As part of installation, be sure to audit your application and confirm that the necessary library instrumentation is available and is installed correctly.
In Chapter 5, we will dive deeper into the innards of these application components and guide you through a successful installation. For now, it’s enough to know that these components exist.
Infrastructure Telemetry
Applications run in an environment. In cloud computing, that environment consists of the host the application is running on and the platform used to manage application instances, along with other various networking and database services operated by your cloud provider. Infrastructure health is incredibly important, and large distributed systems have a lot of infrastructure. High-quality telemetry from these services is critical.
OpenTelemetry is slowly being added to Kubernetes and other cloud services. But even without OpenTelemetry, most infrastructure services produce some sort of useful telemetry. OpenTelemetry comes with a number of components that can be used to gather this existing data and add it into the pipeline of telemetry coming from applications. (For more information, see Chapter 7.)
Telemetry Pipelines
The telemetry collected from applications and infrastructure must be sent to an observability tool for storage and analysis. This can turn into a difficult problem in its own right. The amount of telemetry from a large distributed system under heavy load can be enormous. As a result, networking issues such as egress, load balancing, and backpressure can be significant.
In addition, large systems tend to be old systems. This means they may have a patchwork of observability tools in place, have a variety of data-handling requirements, and in general require telemetry to be heavily processed and diverted to various locations. The resulting topology can be very complicated.
To handle this, OpenTelemetry has two primary components: OpenTelemetry Protocol (OTLP), discussed in Chapter 3, and the Collector, which is covered in detail in Chapter 8.
What’s Not Included in OpenTelemetry
What OpenTelemetry does not include is almost as critical as what it does include. Long-term storage, analysis, GUIs, and other frontend components are not included and never will be.
Why? Standardization. While it is possible to come up with a stable, universal language for describing computer operations, the analysis part of observability will forever be evolving. OpenTelemetry’s goal is to work with all analysis tools and to encourage people to build many more advanced and novel tools in the future. As a result, the OpenTelemetry project will never be extended to include some form of “official” observability backend that would be treated as special or different from all the other observability systems in the world. This separation of concerns—standardized telemetry feeding into an ever-evolving landscape of analysis tools—is fundamental to how the OpenTelemetry project views the world.
Hands-On with the OpenTelemetry Demo
Up to this point, our discussion of OpenTelemetry has been very theoretical. To really understand how things fit together in practice, we need to look at an actual application and some real code.
First, here’s a quick recap of what you’ve learned so far:
-
OpenTelemetry provides APIs, SDKs, and an ecosystem of tools to create, collect, transform, and ensure the quality of telemetry data.
-
OpenTelemetry ensures that telemetry data is portable and interoperable.
-
Unlike the old “three pillars” model, OpenTelemetry braids tracing, metrics, logging, and resources together into a single data model. This creates regularized data that is highly correlated and of uniformly high quality.
-
OpenTelemetry Semantic Conventions ensure that telemetry from different libraries is consistent and of uniformly high quality.
-
OpenTelemetry is just telemetry. It is designed to send data to a variety of storage and analysis tools and enable newer, more advanced analysis tools to be built.
Clearly, OpenTelemetry is a lot of things and has a lot of moving parts. The goal of this book is not simply to teach you how to create a metric or start a span but to help you understand OpenTelemetry holistically. The best way to do that is to see it in action in a real application.
Helpfully, the OpenTelemetry project maintains a robust demo app specifically for this purpose. For the rest of the chapter, we are going to walk through a practical example of the OpenTelemetry architecture as implemented by this demo, Astronomy Shop. We’ll cover the following:
-
Installing and running the demo
-
Exploring the application architecture and its design
-
Using OpenTelemetry data to answer questions about the demo
You can follow along with just the book, but we highly recommend that you actually spin the demo up yourself. This hands-on approach will clear up a lot of questions.
Running the Demo
For this section, you’ll want a recent laptop or desktop computer, ideally with 16GB or more of RAM. You’ll also need around 20GB of disk space for all the container images. These instructions assume that you have Docker and Git available and configured.
Stay Up-to-Date
These instructions were written in late 2023 for OpenTelemetry Demo v1.6.0 using a 2022 MacBook Pro with an Apple Silicon M2 Max and 32GB of RAM. Look in the OpenTelemetry Demo Documentation for up-to-date installation instructions for newer versions of the demo or to learn how to install it on Kubernetes.
To install:
-
Navigate to the demo’s GitHub repository and clone it to your computer.
-
In a terminal, navigate to the root directory of the repository you just cloned and run
make start.
If this was successful, after several minutes you should see the following output in your terminal:
OpenTelemetry Demo is running.
Go to http://localhost:8080 for the demo UI.
Go to http://localhost:8080/jaeger/ui for the Jaeger UI.
Go to http://localhost:8080/grafana/ for the Grafana UI.
Go to http://localhost:8080/loadgen/ for the Load Generator UI.
Go to http://localhost:8080/feature/ for the Feature Flag UI.
In a web browser, navigate to localhost:8080, and you should see a web page that looks like Figure 4-3.
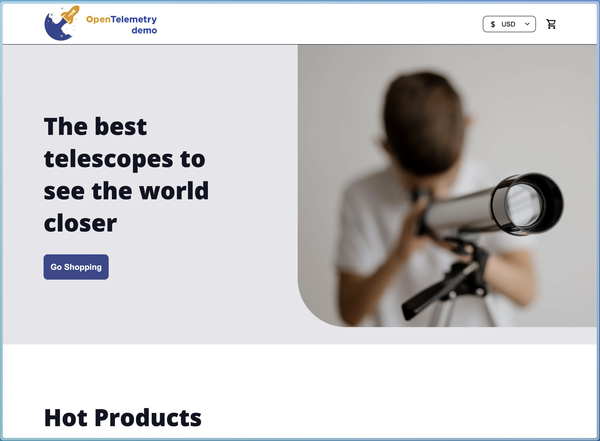
Figure 4-3. The OpenTelemetry Demo front page
If you see this, you’re good to go! If you encounter difficulties, check the instructions linked in the note “Stay Up-to-Date” for more information and troubleshooting assistance.
Architecture and Design
Astronomy Shop is a microservice-based ecommerce application composed of 14 separate services, as mapped in Figure 4-4.
The Astronomy Shop is intended to allow developers, operators, and other end users the ability to explore a “production-lite” deployment of a project. To create a useful demo with interesting observability examples, some things were included that you wouldn’t necessarily see in a “real” production application, such as code designed to simulate failures. Most real-world applications, even the cloud native ones, are significantly more homogeneous than the demo in terms of language and runtime, and a “real” application will usually work with more data layers and storage engines than the demo does.
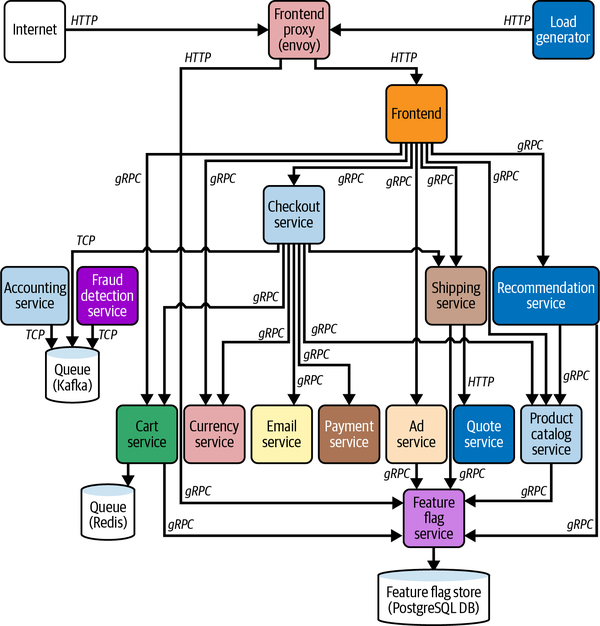
Figure 4-4. The OpenTelemetry Demo service
We can break the overall architecture down into two basic parts: observability concerns and application concerns. The application concerns are the services that handle business logic and functional requirements, such as the email service (which handles sending transactional emails to customers) and the currency service (which is responsible for converting between all supported currency values in the application).
Observability concerns are responsible for some part of the overall observability of the application—by collecting and transforming telemetry data, storing and querying it, or visualizing those queries. These concerns include the load generator, the OpenTelemetry Collector, Grafana, Prometheus, Jaeger, and OpenSearch. The load generator is also an observability concern, since it puts a consistent amount of load on the demo application to simulate what a “real-world” environment might look like.
Although the demo is written in a variety of programming languages, its services communicate with each other using a standard framework, in this case gRPC (or JSON Protobuffers over HTTP). This is intentional, for two reasons. First, many organizations (even ones without polyglot environments) standardize around a single RPC framework, such as gRPC. Second, OpenTelemetry supports gRPC and includes useful instrumentation for its libraries out of the box. This means you get a wealth of telemetry data “for free” just by using OpenTelemetry and gRPC.
Managing Application Performance with OpenTelemetry
To see what OpenTelemetry can do, let’s create an interesting problem for you to discover. Use your browser to navigate to the Feature Flag UI (http://localhost:8080/feature) and enable the cartServiceFailure and adServiceFailure flags by clicking Edit next to each, checking the Enabled checkbox, and then saving your changes. You’ll probably want to let the demo run for a few minutes before and after enabling these feature flags, in order to see what performance looks like before and after enabling them. Figure 4-5 shows what you should see in the Feature Flag UI after accomplishing this task.

Figure 4-5. The selected feature flags being enabled in the Feature Flag UI
After waiting a few minutes, you can start exploring the data. Grafana (http://localhost:8080/grafana/) has several prebuilt dashboards available; one of the more interesting ones is the Spanmetrics Demo Dashboard. This dashboard gives you an “APM-style” view of the services, showing the latency, error rate, and throughput of each route across all application services. What’s interesting is that this dashboard is generated not from metrics but from trace data, using the OpenTelemetry Collector’s spanmetrics connector. If you filter this dashboard to the Ad Service and Cart Service (Figure 4-6), you’ll notice that they have a slightly elevated error rate—but you’ll also see where exactly that error rate lies.
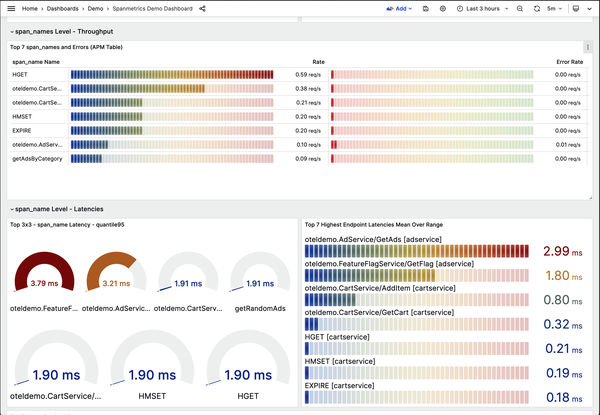
Figure 4-6. The Spanmetrics Dashboard in Grafana
You can see in the chart at bottom right in Figure 4-6 that the name of the span showing the higher error rate is oteldemo.AdService/GetAds. That’s a useful starting point for an investigation.
How would you normally figure out what’s causing this issue? Many people would reach for logs. But because OpenTelemetry is providing rich, high-context traces, you can take the two pieces of data you do have—the presence and the location of errors—and use those to search for traces that match.
In Grafana, you can explore trace data by going to the Explore item in the menu. Once there, select Jaeger from the drop-down menu near the top (it should say Prometheus by default), and then change to a Search query. Input the information that you know, as seen in Figure 4-7, and then click Run Query. You’ll see all the requests that include errors for that specific route. Inspecting these traces reveals that a small percentage of transactions are failing with a gRPC error. You could take that information and do further investigation, comparing it with memory or CPU utilization on the host or container.
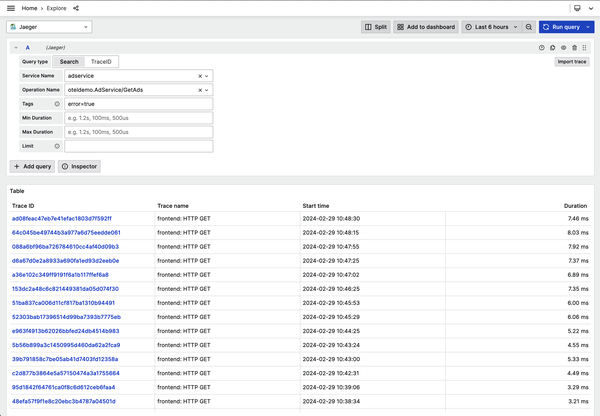
Figure 4-7. Exploring Jaeger trace data in Grafana
While this random error might not be terribly interesting, what is interesting is that the instrumentation required to get this result was free, so to speak. This is an example of automatic instrumentation (or zero-code instrumentation), in which an agent or a library adds instrumentation code without you having to write anything to enable it. If you look at the Dockerfile for the Ad Service, you can see that it downloads an agent as part of the build, copies it into the container, and runs it alongside the service. This means that on startup, the necessary instrumentation is added in without any work on the developer’s part.
A similar pattern exists in the Cart Service, and again, you don’t have to write the instrumentation required to discover it. In .NET, OpenTelemetry is integrated into the runtime itself—all you have to do is enable it. Look for yourself: open /src/cartservice/src/Program.cs in an editor and look at line 52. We’ve added some notes to the following code to help you understand what’s going on:
builder.Services.AddOpenTelemetry().ConfigureResource(appResourceBuilder) .WithTracing(tracerBuilder => tracerBuilder .AddRedisInstrumentation( options => options.SetVerboseDatabaseStatements = true) .AddAspNetCoreInstrumentation() .AddGrpcClientInstrumentation()
.AddHttpClientInstrumentation() .AddOtlpExporter())
.WithMetrics(meterBuilder => meterBuilder
.AddProcessInstrumentation() .AddRuntimeInstrumentation() .AddAspNetCoreInstrumentation()
![]() This adds OpenTelemetry libraries to the dependency injection container present in .NET applications.
This adds OpenTelemetry libraries to the dependency injection container present in .NET applications.
![]() This enables built-in instrumentation for gRPC clients.
This enables built-in instrumentation for gRPC clients.
![]() Here, we enable OTLP export to send the data to an OpenTelemetry Collector.
Here, we enable OTLP export to send the data to an OpenTelemetry Collector.
![]() We’re also getting metrics out—process metrics such as memory and garbage collection, HTTP server metrics, etc.
We’re also getting metrics out—process metrics such as memory and garbage collection, HTTP server metrics, etc.
In both cases, OpenTelemetry provides valuable telemetry at the framework level with very little effort on your part. In Chapter 5 we’ll go into more detail on the availability of this kind of automatic instrumentation in other languages—it’s not just for .NET and Java!
Finding Needles in Haystacks
Framework instrumentation gets you a lot, as we demonstrated in the last section. You can get a lot more, though, by adding in more instrumentation. Chapters 5 and 6 cover this in more detail, but let’s give you a taste of the difference. Figure 4-8 shows the difference between framework instrumentation alone and a combination of framework and custom instrumentation in a transaction between two services in the demo.
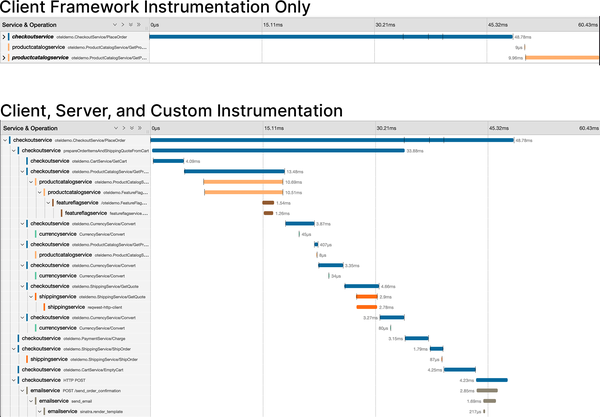
Figure 4-8. Two trace waterfalls of the same transaction. The first trace (at top) demonstrates client spans only; the second includes client, server, and custom spans.
Let’s investigate a problem that can be found only with custom instrumentation. If you go back to the Feature Flag UI (http://localhost:8080/feature) and enable productCatalogFailure, you’ll introduce a new issue to the demo. After a few minutes, you’ll notice that the error rate for several services is starting to creep up, especially for the frontend (Figure 4-9).
This is emblematic of a pretty common failure mode in distributed applications: the thing that’s failing isn’t necessarily the thing that has a problem. If this was a real application, your frontend team would probably be getting paged for that relatively high error rate. Your first port of call might be a basic health check for the frontend, which is available in the demo as the httpcheck.status metric. Querying that in Grafana, though, shows that everything is fine (Figure 4-10).
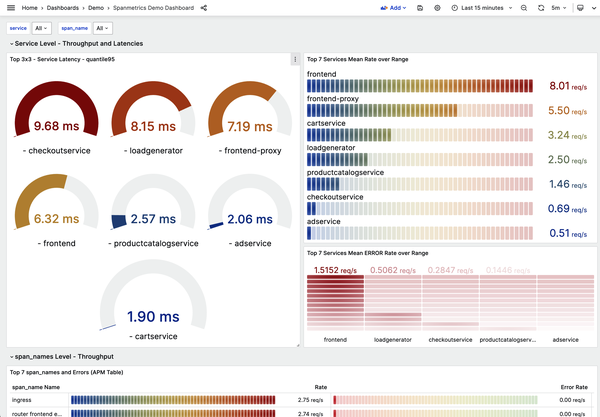
Figure 4-9. The Spanmetrics Dashboard showing error rates during a product catalog service failure
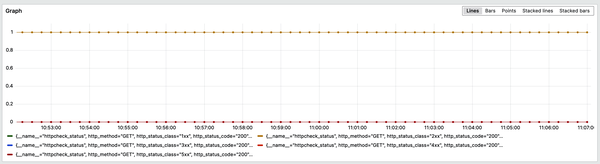
Figure 4-10. Querying the httpcheck.status metric in Grafana
This tells you that the web server isn’t having problems. Perhaps it’s the frontend service? If you had only metrics and logs to work with, you would need to start searching through log statements, trying to pick out the errors. Since span metrics are available, though, you can instead look for errors by route (Figure 4-11). By filtering for just frontend spans and restricting it to just errors, you can add up those errors across all the calls the frontend is making into the backend.
Here’s something interesting: the spike in errors is coming from the product catalog service! If you’re a frontend dev, you can breathe easy; it’s probably not your fault.
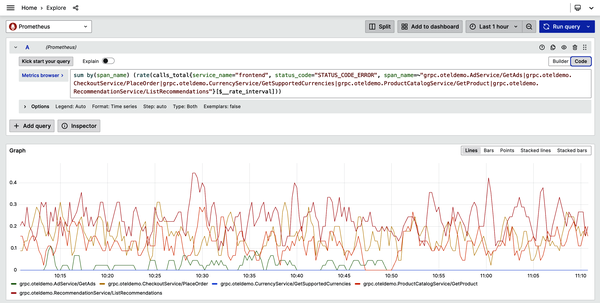
Figure 4-11. Filtering span metrics to find errors by route
Your next step in troubleshooting should be to investigate these specific errors. As before, you can search for spans matching the failure in Grafana or in Jaeger directly.
If you explore all of the traces that call oteldemo.ProductCatalogService/GetProduct, you may notice that the errors all have something in common: they happen only when the app.product.id attribute is a specific value. In Jaeger and Grafana alone, this fact can be somewhat challenging to discover; you have to compare many traces with each other, either manually or by using single trace comparisons. More advanced analysis tools—both open source and commercial—support aggregate analysis of spans and correlation detection. Using those, you could more easily see the specific value that leads to the error, reducing the time required to identify and remediate the problem.
Now, automatic instrumentation can’t know about the domain- or business-specific logic and metadata that matter to your service. You have to add that in yourself by extending the instrumentation. In this case, the product catalog uses gRPC instrumentation. You’ll want to attach useful soft context to the spans that it generates, like the particular product ID being requested. You can see where this attribute is set in lines 198 to 202 of the source code (/src/productcatalogservice/main.go):
func (p *productCatalog) GetProduct(ctx context.Context, req *pb.GetProductRequest)
(*pb.Product, error) {  span := trace.SpanFromContext(ctx)
  span.SetAttributes(
attribute.String("app.product.id", req.Id),
span.SetAttributes(
attribute.String("app.product.id", req.Id),  )
)
![]() In Go, OpenTelemetry context is carried in the Context.
In Go, OpenTelemetry context is carried in the Context.
![]() To modify an existing span or start a new one, you need to get the current span from the Context.
To modify an existing span or start a new one, you need to get the current span from the Context.
![]() Because OpenTelemetry is semantic, you need to strongly type attributes and their values.
Because OpenTelemetry is semantic, you need to strongly type attributes and their values.
There’s more to the demo than what we’ve covered here, including database requests, asynchronous work through Kafka, and infrastructure monitoring. You’d be well served to read through the services in the languages you’re most familiar with to get an idea of how you can use OpenTelemetry in practice and explore the data it emits. At the time of this writing, support for all OpenTelemetry features in the demo is somewhat spotty. Tracing works well everywhere, and metrics work in about half of the services. Logging support is offered in a handful of services right now, but by the time you read this, it should be more widespread.
Observability Pipelines in the Demo
The last thing to note about the demo is how it collects data. When possible, the demo prefers to push data from a process to an instance of the OpenTelemetry Collector. Filtering, batching, and creating metric views are all accomplished at the Collector rather than in the process itself.
This is done for two reasons. First, it’s a good idea to get telemetry out of your service as quickly as possible. Creating telemetry isn’t free; there’s some overhead. The more processing you do at the application level, the more overhead you create. This might be fine when things are running well, but unexpected load patterns (like the kind that happen during an incident) can have unexpected outcomes on a service’s performance profile. If your application crashes before you can export (or scrape) data, you lose those insights. That said, it’s also possible to create so much telemetry that it can overwhelm local network links and cause performance issues at a different layer of your system. There’s no absolute rule here—everyone will have different circumstances. Your best bet is to ensure that you enable good metamonitoring of your OpenTelemetry infrastructure. (You can see an example of this in the Collector dashboard included in the demo.) There’s a much more comprehensive discussion of observability pipelines in Chapter 8.
The New Observability Model
Now that you’ve seen an application that uses OpenTelemetry, let’s review how everything we’ve talked about so far fits together. The rest of this book will focus on more of the specifics. You can think of this section as the “end of the beginning.”
We talked in Chapter 1 about the “three browser tabs of observability,” but the concept is worth revisiting in more detail. People use observability tools out of necessity more than anything else. While it’s nice to wax philosophic about data modeling strategies or mapping systems to telemetry signals, they usually don’t have a big impact on your actual day-to-day work. If you think about them that way, then it makes sense as to why most tools are vertically integrated. They’re integrated because doing so is the most cost-efficient set of trade-offs for the people who build them.
Let’s take a specific example around metrics. If you’re building a metrics analysis and storage tool, then you’ll probably want to create some efficiencies in your system, especially for things that appear frequently. You can do this with strategies for clustering, reaggregation, and compaction. Accomplishing this, though, requires that you control the instrumentation and collection pipeline—you need to make sure you’re adding the right attributes to the right data. Other efficiencies come out of this: for instance, you could reduce the process overhead for generating metrics by moving attribute generation to an external process, stateless wire formats, and so forth.
A lot of that goes out the window once you’re dealing with a data pipeline you no longer control, though. This is why OpenTelemetry is such a big deal in the observability space: it breaks this fundamental model. The result is a new model of observability tooling that opens the door to significant innovation.
In the model pictured in Figure 4-12, the “new” way of doing things is built on a foundation of unified, universal instrumentation via OpenTelemetry. It combines telemetry from all your sources—greenfield code, legacy code, existing instrumentation, and business data from systems of record and other important sources. This data is then sent to (at least) one data store via OTLP.
OpenTelemetry acts as a universal conduit for telemetry data, allowing you to process and send telemetry streams based on any number of factors, such as the value of the data to your business or the use case you’d like to enable with it. It’s a critical building block for what can come next.
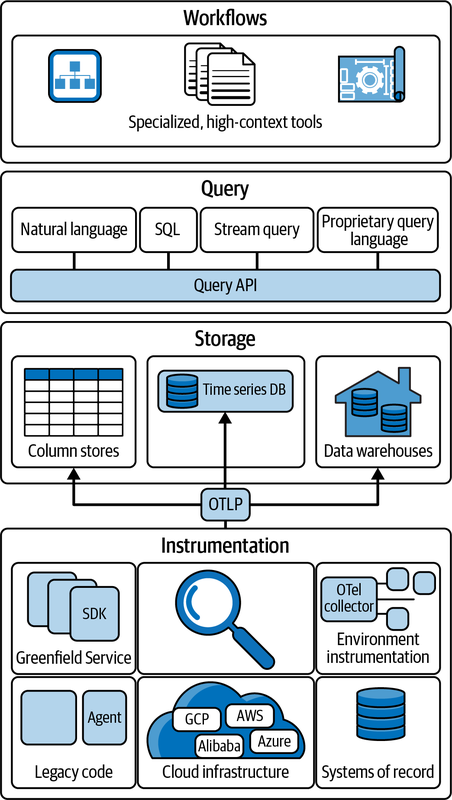
Figure 4-12. The new model of observability tools
Future observability platforms will offer capabilities such as universal query APIs, letting you seamlessly fetch telemetry data from a variety of data stores. Rather than being locked into a single query language, you’ll be able to use natural language—with assistance from AI tools—to easily find what you’re looking for. Rather than being restricted to large omnibus platforms, you’ll be able to select from a wide range of specific analysis tools designed to solve particular problems, thanks to the data portability OpenTelemetry offers.
OpenTelemetry isn’t going to solve these problems by itself, but it’s a critical part of the solution. In some ways, it’s designed more for this future of highly contextual data and tools capable of understanding it than the tools of today are.
You may have felt the dissonance between the “old” and “new” ways of doing things in the previous section. For as much as we’ve talked (and will continue to talk) about metrics and logs, a lot of the demo workflows are built around tracing. Some of this is because the tools that we have, such as Prometheus and Jaeger, just don’t support the sort of high-cardinality, highly contextual workflows that OpenTelemetry provides. All OpenTelemetry components are designed to work together and can be extended to level up your existing telemetry data without reinstrumentation. However, to really get the most value from this, your tools also need to support the concepts of high-cardinality data, correlation across hard and soft contexts, and unified telemetry.
As of this writing, there are excellent signs of progress in that direction. A raft of new observability tools have launched over the past couple of years, many of which rely exclusively on OpenTelemetry for instrumentation. These tools, built on open source column stores, are all well suited to the kind of highly contextual telemetry data that OpenTelemetry provides. Large organizations are adopting OpenTelemetry as well, including Microsoft and Amazon Web Services, both of which recently announced first-class support for OpenTelemetry (for Microsoft as part of Azure Monitor, and for Amazon as an OpenTelemetry-powered APM experience for EKS applications). Noncommercial tools are ramping up their OpenTelemetry support as well, with projects like OpenSearch and ClickHouse becoming more and more popular for storing OpenTelemetry data.
Conclusion
Understanding the basic building blocks of OpenTelemetry and seeing how they fit together in a real application is your first real step into practical OpenTelemetry. Now that you’ve gotten your feet wet, it’s time to dive into the details.
The rest of the book is dedicated to the specifics of how OpenTelemetry works and what you need to know to successfully instrument your applications, libraries, and infrastructure for observability. We’ll also cover practical advice on how to design telemetry pipelines and roll out observability to an organization, based on case studies from existing users. After each deep dive, we’ll include a checklist you can follow to help make sure your OpenTelemetry rollout is successful.
1 Brian W. Kernighan and P. J. Plauger, The Elements of Programming Style, 2nd ed. (New York: McGraw-Hill, 1978).
Get Learning OpenTelemetry now with the O’Reilly learning platform.
O’Reilly members experience books, live events, courses curated by job role, and more from O’Reilly and nearly 200 top publishers.

