Chapter 1. The State of Modern Observability
History is not the past but a map of the past, drawn from a particular point of view, to be useful to the modern traveler.
Henry Glassie, US historian1
This is a book about the difficult problems inherent to large-scale distributed computer systems, and about how to apply OpenTelemetry to help solve those problems.
Modern software engineering is obsessed with end-user experience, and end users demand blazing-fast performance. Surveys show that users will abandon ecommerce sites that take more than two seconds to load. You’ve probably spent a fair amount of time trying to optimize and debug application performance issues, and if you’re like us, you’ve been frustrated by how inelegant and inefficient this process can be. There’s either not enough data or too much of it, and what data there is can be riddled with inconsistencies or unclear measurements.
Engineers are also faced with stringent uptime requirements. That means identifying and mitigating any issues before they cause a meltdown, not just waiting for the system to fail. And it means moving quickly from triage to mitigation. To do that, you need data.
But you don’t need just any data; you need correlated data—data that is already organized, ready to be analyzed by a computer system. As you will see, data with that level of organization has not been readily available. In fact, as systems have scaled and become more heterogeneous, finding the data you need to analyze an issue has become even harder. If it was once like looking for a needle in a haystack, it’s now more like looking for a needle in a stack of needles.
OpenTelemetry solves this problem. By turning individual logs, metrics, and traces into a coherent, unified graph of information, OpenTelemetry sets the stage for the next generation of observability tools. And since the software industry is broadly adopting OpenTelemetry already, that next generation of tools is being built as we write this.
The Times They Are A-Changin’
Technology comes in waves. As we write this in 2024, the field of observability is riding its first real tsunami in at least 30 years. You’ve chosen a good time to pick up this book and gain a new perspective!
The advent of cloud computing and cloud native application systems has led to seismic shifts in the practice of building and operating complex software systems. What hasn’t changed, though, is that software runs on computers, and you need to understand what those computers are doing in order to understand your software. As much as the cloud has sought to abstract away fundamental units of computing, our ones and zeros are still using bits and bytes.
Whether you are running a program on a multiregion Kubernetes cluster or a laptop, you will find yourself asking the same questions:
- “Why is it slow?”
- “What is using so much RAM?”
- “When did this problem start?”
- “Where is the root cause?”
- “How do I fix this?”
The astronomer and science communicator Carl Sagan said, “You have to know the past to understand the present.”2 That certainly applies here: to see why a new approach to observability is so important, you first need to be familiar with traditional observability architecture and its limitations.
This may look like a recap of rudimentary information! But the observability mess has been around for so long that most of us have developed quite the pile of preconceptions. So even if you’re an expert—especially if you’re an expert—it is important to have a fresh perspective. Let’s start this journey by defining several key terms we will use throughout this book.
Observability: Key Terms to Know
First of all, what is observability observing? For the purposes of this book, we are observing distributed systems. A distributed system is a system whose components are located on different networked computers that communicate and coordinate their actions by passing messages to one another.3 There are many kinds of computer systems, but these are the ones we’re focusing on.
What Counts as Distributed?
Distributed systems aren’t just applications running in the cloud, microservices, or Kubernetes applications. Macroservices or “monoliths” that use service-oriented architecture, client applications that communicate with a backend, and mobile and web apps are all somewhat distributed and benefit from observability.
At the highest level, a distributed system consists of resources and transactions:
- Resources
-
These are all the physical and logical components that make up a system. Physical components, such as servers, containers, processes, RAM, CPU, and network cards, are all resources. Logical components, such as clients, applications, API endpoints, databases, and load balancers, are also resources. In short, resources are everything from which the system is actually constructed.
- Transactions
-
These are requests that orchestrate and utilize the resources the system needs to do work on behalf of the user. Usually, a transaction is kicked off by a real human, who is waiting for the task to be completed. Booking a flight, hailing a rideshare, and loading a web page are examples of transactions.
How do we observe these distributed systems? We can’t, unless they emit telemetry. Telemetry is data that describes what your system is doing. Without telemetry, your system is just a big black box filled with mystery.
Many developers find the word telemetry confusing. It’s an overloaded term. The distinction we draw in this book, and in systems monitoring in general, is between user telemetry and performance telemetry:
- User telemetry
-
Refers to data about how a user is interacting with a system through a client: button clicks, session duration, information about the client’s host machine, and so forth. You can use this data to understand how users are interacting with an ecommerce site, or the distribution of browser versions accessing a web-based application.
- Performance telemetry
-
This is not primarily used to analyze user behavior; instead, it provides operators with statistical information about the behavior and performance of system components. Performance data can come from different sources in a distributed system and offers developers a “breadcrumb trail” to follow, connecting cause with effect.
In plainer terms, user telemetry will tell you how long someone hovered their mouse cursor over a Checkout button in an ecommerce application. Performance telemetry will tell you how long it took for that checkout button to load in the first place, and which programs and resources the system utilized along the way.
Underneath user and performance telemetry are different types of signals. A signal is a particular form of telemetry. Event logs are one kind of signal. System metrics are another kind of signal. Continuous profiling is another. These signal types each serve a different purpose, and they are not really interchangeable. You can’t derive all the events that make up a user interaction just by looking at system metrics, and you can’t derive system load just by looking at transaction logs. You need multiple kinds of signals to get a deep understanding of your system as a whole.
Each signal consists of two parts: instrumentation—code that emits telemetry data—within the programs themselves, and a transmission system for sending the data over the network to an analysis tool, where the actual observing occurs.
This raises an important distinction: it’s common to conflate telemetry and analysis, but it’s important to understand that the system that emits the data and the system that analyzes the data are separate from each other. Telemetry is the data itself. Analysis is what you do with the data.
Finally, telemetry plus an analysis equals observability. Understanding the best way to combine these two pieces into a useful observability system is what this book is all about.
A Brief History of Telemetry
Fun fact: it’s called telemetry because the first remote diagnostic systems transmitted data over telegraph lines. While people often think of rockets and 1950s aerospace when they hear the term telemetry, if that was where the practice had started, it would have been called radiometry. Telemetry was actually first developed to monitor power plants and public power grids—early but important distributed systems!
Of course, computer telemetry came later. The specific history of user and performance telemetry maps to changes in software operations, and to the ever-increasing processing power and network bandwidth that have long driven those trends. Understanding how computer telemetry signals came to be and how they evolved is an important part of understanding their current limitations.
The first and most enduring form of telemetry was logging. Logs are text-based messages meant for human consumption that describe the state of a system or service. Over time, developers and operators improved how they stored and searched these logs by creating specialized databases that were good at full-text search.
While logging did tell you about individual events and moments within a system, understanding how that system was changing over time required more data. A log could tell you that a file couldn’t be written because the storage device was out of space, but wouldn’t it be great if you could track available storage capacity and make a change before you ran out of space?
Metrics are compact statistical representations of system state and resource utilization. They were perfect for the job. Adding metrics made it possible to build alerting on data, beyond errors and exceptions.
As the modern internet took off, systems became more complex, and performance became more critical. A third form of telemetry was added: distributed tracing. As transactions grew to include more and more operations and more and more machines, localizing the source of a problem became more critical. Instead of just looking at individual events—logs—tracing systems looked at entire operations and how they combined to form transactions. Operations have a start time and an end time. They also have a location: on which machine did a particular operation occur? Tracking this made it possible to localize the source of latency to a particular operation or a machine. However, because of resource constraints, tracing systems tended to be heavily sampled and ended up recording only a small fraction of the total number of transactions, which limited their usefulness beyond basic performance analysis.
The Three Browser Tabs of Observability
While there are other useful forms of telemetry, the primacy of these three systems—logs, metrics, and tracing—led to the concept known today as the “three pillars of observability.”4 The three pillars are a great way to describe how we currently practice observability—but they’re actually a terrible way to design a telemetry system!
Traditionally, each form of observability—telemetry plus analysis—was built as a completely separate, siloed system, as described in Figure 1-1.
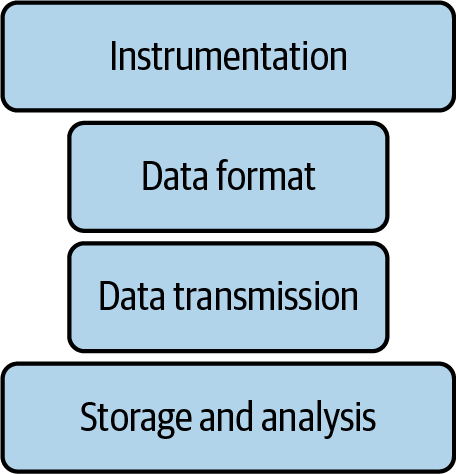
Figure 1-1. A pillar of observability
A logging system consists of logging instrumentation, a log transmission system, and a log analysis tool. A metrics system consists of metrics instrumentation, a metrics transmission system, and a metrics analysis tool. The same is true for tracing—hence the three pillars described in Figure 1-2.
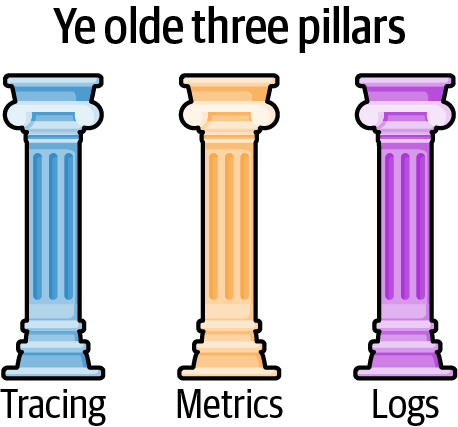
Figure 1-2. The three pillars of observability
This is basic vertical integration: each system is built to purpose, end to end. It makes sense that observability has been built this way—it’s been evolving over time, with each piece added as it was needed. In other words, observability is structured this way for no better reason than historical accident. The simplest way to implement a logging system or a metrics system is to do it in isolation, as a standalone system.
So, while the term “three pillars” does explain the way traditional observability is architected, it is also problematic—it makes this architecture sound like a good idea! Which it isn’t. It’s cheeky, but I prefer a different turn of phrase—the “three browser tabs of observability.” Because that’s what you’re actually getting.
Emerging Complications
The problem is that our systems are not composed of logging problems or metrics problems. They are composed of transactions and resources. When a problem occurs, these are the only two things we can modify: developers can change what the transactions do, and operators can change what resources are available. That’s it.
But the devil is in the details. It’s possible for a simple, isolated bug to be confined to a single transaction. But most production problems emerge from the way many concurrent transactions interact.
A big part of observing real systems involves identifying patterns of bad behavior and then extrapolating to figure out how certain patterns of transactions and resource consumption cause these patterns. That’s really difficult to do! It’s very hard to predict how transactions and resources will end up interacting in the real world. Tests and small-scale deployments aren’t always useful tools for this task, because the problems you are trying to solve do not appear outside of production. These problems are emergent side effects, and they are specific to the way that the physical reality of your production deployment interacts with the system’s real users.
This is a pickle! Clearly, your ability to solve these problems depends on the quality of the telemetry your system is emitting in production.
The Three Pillars Were an Accident
You can definitely use metrics, logs, and traces to understand your system. Logs and traces help you reconstruct the events that make up a transaction, while metrics help you understand resource usage and availability.
But useful observations do not come from looking at data in isolation. You can’t look at a single data point, or even a single data type, and understand anything about emergent behavior. You’ll almost never find the root cause of a problem just by looking at logs or metrics. The clues that lead us to answers come from finding correlations across these different data streams. So, when investigating a problem, you tend to pivot back and forth between logs and metrics, looking for correlations.
This is the primary problem with the traditional three pillars approach: these signals are all kept in separate data silos. This makes it impossible to automatically identify correlations between changing patterns in our transaction logs and changing patterns in our metrics. Instead, you end up with three separate browser tabs, and each one contains only a portion of what you need.
Vertical integration makes things even worse: if you want to spot correlations across metrics, logs, and traces, you need these connections to be present in the telemetry your systems are emitting. Without unified telemetry, even if you were able to store these separate signals in the same database, you would still be missing key identifiers that make correlations reliable and consistent. So the three pillars are actually a bad design! What we need is an integrated system.
A Single Braid of Data
How do you triage your systems once you’ve noticed a problem? By finding correlations. How do you find correlations? There are two ways—with humans and with computers:
- Human investigation
-
Operators sweep through all the available data, building a mental model of the current system. Then, in their heads, they try to identify how all the pieces might be secretly connected. Not only is this approach mentally exhausting, but it’s also subject to the limitations of human memory. Think about it: they’re literally looking for correlations by using their eyeballs to look at squiggly lines. In addition, human investigation suffers as organizations grow larger and systems become more complex. Turning something you see in a squiggly line into an actionable insight becomes harder when the required knowledge is distributed around the world.
- Computer investigation
-
The second way to find correlations is by using computers. Computers may not be good at forming hypotheses and finding root causes, but they are very good at identifying correlations. That’s just statistical mathematics.
-
But again, there’s a catch: computers can find correlations only between connected pieces of data. And if your telemetry data is siloed, unstructured, and inconsistent, then the assistance computers can offer you will be very limited. This is why human operators are still using their eyeballs to scan for metrics while also trying to memorize every line in every config file.
Instead of three separate pillars, let’s use a new metaphor: a single braid of data. Figure 1-3 shows my favorite way of thinking about high-quality telemetry. We still have three separate signals—there’s no conflating them—but the signals have touch points that connect everything into a single graphical data structure.
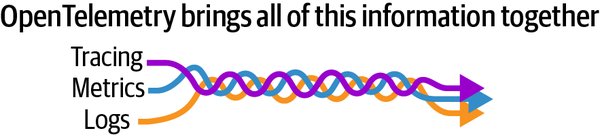
Figure 1-3. A braid of signals, making it easier to find correlations between them
With a telemetry system like this, it’s possible for computers to walk through the graph, quickly finding distant but important connections. Unified telemetry means it’s finally possible to have unified analysis, which is critical to developing a deep understanding of the emergent problems inherent to live production systems.
Does such a telemetry system exist? It does. And it’s called OpenTelemetry.
Conclusion
The world of observability is in the process of changing for the better, and at the heart of that change will be a newfound ability to correlate across all forms of telemetry: traces, metrics, logs, profiling, everything. Correlation is the key to unlocking the workflows and automation that we desperately need to keep up with this world of ever expanding complex systems.
This change is already happening, but it will take some time for the transition to be complete and for observability products to explore the kind of features that this new data unlocks. We are only at the beginning. But since the heart of this transition is a shift to a new kind of data, and since OpenTelemetry is now the widely agreed upon source of that data, understanding OpenTelemetry means understanding the future of observability in general.
This book will be your guide to learning OpenTelemetry. It is not meant to be a replacement for OpenTelemetry documentation, which can be found on the project’s website. Instead, this book explains the philosophy and design of OpenTelemetry and offers practical guidance on how to wield it effectively.
In Chapter 2, we explain the value proposition OpenTelemetry brings, and how your organization benefits from replacing proprietary instrumentation with instrumentation based on open standards.
In Chapter 3, we take a deeper dive into the OpenTelemetry model and discuss the primary observability signals of traces, metrics, and logs, along with how they’re linked via context.
In Chapter 4, we get hands-on with OpenTelemetry in the OpenTelemetry Demo, giving you an overview of its components and of how OpenTelemetry fits into an observability stack.
In Chapter 5, we dive into instrumenting an application and provide a checklist to help ensure that everything works and that the telemetry is high-quality.
In Chapter 6, we discuss instrumenting OSS libraries and services and explain why library maintainers should care about observability.
In Chapter 7, we review the options for observing software infrastructure—cloud providers, platforms, and data services.
In Chapter 8, we go into detail on how and why to build different types of observability pipelines using the OpenTelemetry Collector.
In Chapter 9, we provide advice on how to deploy OpenTelemetry across your organization. Since telemetry—especially tracing—is a cross-team issue, there are organizational pitfalls when rolling out a new observability system. This chapter will provide strategies and advice on how to ensure a successful rollout.
Finally, our appendices include helpful resources on the structure of the OpenTelemetry project itself, as well as links to further reading and other titles.
If you are brand new to OpenTelemetry, we strongly suggest reading up through Chapter 4 first. After that, the chapters can be read in any order. Feel free to skip to whichever section is most relevant to the task you need to accomplish.
1 Henry Glassie, Passing the Time in Ballymenone: Culture and History of an Ulster Community (Philadelphia: University of Pennsylvania Press, 1982).
2 Carl E. Sagan (author and presenter), in Cosmos: A Personal Voyage, season 1, episode 2, “One Voice in the Cosmic Fugue,” produced by Adrian Malone (Arlington, VA: Public Broadcasting Service, 1980).
3 Andrew S. Tanenbaum and Maarten van Steen, Distributed Systems: Principles and Paradigms (Upper Saddle River, NJ: Prentice Hall, 2002).
4 Cindy Sridharan, Distributed Systems Observability (Sebastopol, CA: O’Reilly, 2018).
Get Learning OpenTelemetry now with the O’Reilly learning platform.
O’Reilly members experience books, live events, courses curated by job role, and more from O’Reilly and nearly 200 top publishers.

