Chapter 4. The bpf() System Call
As you saw in Chapter 1, when user space applications want the kernel to do something on their behalf, they make requests using the system call API. It therefore makes sense that if a user space application wants to load an eBPF program into the kernel, there must be some system calls involved. In fact, there’s a system call named bpf(), and in this chapter I’ll show you how it’s used to load and interact with eBPF programs and maps.
It’s worth noting that the eBPF code running in the kernel does not use syscalls to access maps. The syscall interface is only used by user space applications. Instead, eBPF programs use helper functions to read and write to maps; you already saw examples of this in the previous two chapters.
If you go on to write eBPF programs yourself, there’s a good chance you won’t directly call these bpf() system calls yourself. There are libraries that I’ll discuss later in the book that offer higher-level abstractions to make things easier. That said, those abstractions generally map pretty directly to the underlying syscall commands you’ll see in this chapter. Whatever library you’re using, you’ll need a grasp of the underlying operations—loading a program, creating and accessing maps, and so on—that you’ll see in this chapter.
Before I show you examples of bpf() system calls, let’s consider what the manpage for bpf() says, which is that bpf() is used to “perform a command on an extended BPF map or program.” It also tells us that bpf()’s signature is as follows:
intbpf(intcmd,unionbpf_attr*attr,unsignedintsize);
The first argument to bpf(), cmd, specifies which command to perform. The bpf() syscall doesn’t just do one thing—there are lots of different commands that can be used to manipulate eBPF programs and maps. Figure 4-1 shows an overview of some of the common commands the user space code might use to load eBPF programs, create maps, attach programs to events, and access the key–value pairs in a map.
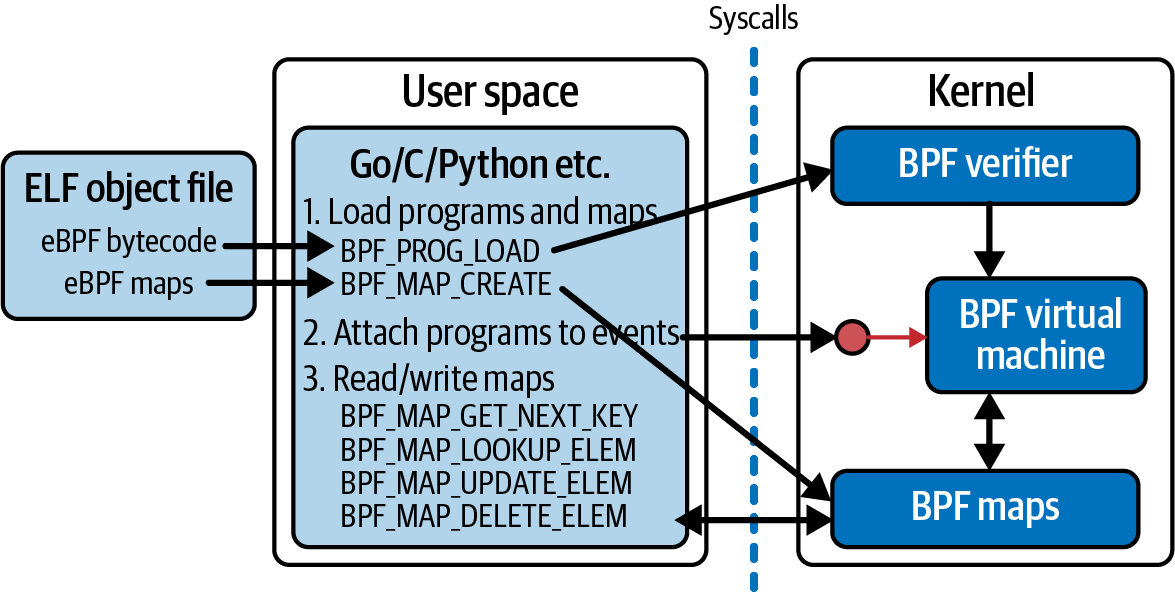
Figure 4-1. A userspace program interacts with eBPF programs and maps in the kernel using syscalls
The attr argument to the bpf() syscall holds whatever data is needed to specify the parameters for the command, and size indicates how many bytes of data there are in attr.
You already met strace in Chapter 1, when I used it to show how user space code makes many requests across the syscall API. In this chapter I’ll use it to demonstrate how the bpf() syscall is used. The output from strace includes the arguments to each syscall, but to keep the example output in this chapter from being too cluttered, I’ll omit lots of the details from the attr arguments unless they are particularly interesting.
Note
You’ll find the code, along with instructions for setting up an environment to run it in, at github.com/lizrice/learning-ebpf. The code for this chapter is in the chapter4 directory.
For this example I’m going to use a BCC program called hello-buffer-config.py, which builds on the examples you saw in Chapter 2. Like the hello-buffer.py example, this program sends a message to the perf buffer whenever it runs, conveying information from the kernel to user space about execve() syscall events. What’s new in this version is that it allows for different messages to be configured for each user ID.
Here’s the eBPF source code:
structuser_msg_t{charmessage[12];};BPF_HASH(config,u32,structuser_msg_t);BPF_PERF_OUTPUT(output);structdata_t{intpid;intuid;charcommand[16];charmessage[12];};inthello(void*ctx){structdata_tdata={};structuser_msg_t*p;charmessage[12]="Hello World";data.pid=bpf_get_current_pid_tgid()>>32;data.uid=bpf_get_current_uid_gid()&0xFFFFFFFF;bpf_get_current_comm(&data.command,sizeof(data.command));p=config.lookup(&data.uid);if(p!=0){bpf_probe_read_kernel(&data.message,sizeof(data.message),p->message);}else{bpf_probe_read_kernel(&data.message,sizeof(data.message),message);}output.perf_submit(ctx,&data,sizeof(data));return0;}

- This line indicates that there’s a structure definition,
user_msg_t, for holding a 12-character message. 
- The BCC macro
BPF_HASHis used to define a hash table map calledconfig. It will hold values of typeuser_msg_t, indexed by keys of typeu32, which is the right size for a user ID. (If you don’t specify the types for the keys and values, BCC defaults tou64for both.) 
- The perf buffer output is defined in exactly the same way as in Chapter 2. You can submit arbitrary data to a buffer, so there’s no need to specify any data types here…

- …although in practice, in this example the program always submits a
data_tstructure. This is also unchanged from the Chapter 2 example. 
- Most of the rest of the eBPF program is unchanged from the
hello()version you saw earlier. 
- The only difference is that having used a helper function to get the user ID, the code looks for an entry in the
confighash map with that user ID as the key. If there is a matching entry, the value contains a message that gets used instead of the default “Hello World.”
The Python code has two additional lines:
b["config"][ct.c_int(0)]=ct.create_string_buffer(b"Hey root!")b["config"][ct.c_int(501)]=ct.create_string_buffer(b"Hi user 501!")
These define messages in the config hash table for user IDs 0 and 501, which correspond to the root user and my user ID on this virtual machine. This code uses Python’s ctypes package to ensure that the key and value have the same types as those used in the C definition of user_msg_t.
Here’s some illustrative output from this example, along with the commands I ran in a second terminal to obtain it:
Terminal 1                             Terminal 2
$ ./hello-buffer-config.py
37926 501 bash Hi user 501!            ls
37927 501 bash Hi user 501!            sudo ls
37929 0 sudo Hey root!
37931 501 bash Hi user 501!            sudo -u daemon ls
37933 1 sudo Hello World
Now that you’ve got an idea of what this program does, I’d like to show you the bpf() system calls that are used when it runs. I’ll run it again using strace, specifying -e bpf to indicate that I am only interested in seeing the bpf() syscall:
$ strace -e bpf ./hello-buffer-config.py
The output you’ll see if you try this yourself shows several calls to this syscall. For each, you’ll see the command indicating what the bpf() syscall should do. The broad outline looks like this:
bpf(BPF_BTF_LOAD, ...) = 3
bpf(BPF_MAP_CREATE, {map_type=BPF_MAP_TYPE_PERF_EVENT_ARRAY…) = 4
bpf(BPF_MAP_CREATE, {map_type=BPF_MAP_TYPE_HASH...) = 5
bpf(BPF_PROG_LOAD, {prog_type=BPF_PROG_TYPE_KPROBE,...prog_name="hello",...) = 6
bpf(BPF_MAP_UPDATE_ELEM, ...}
...
Let’s examine them one by one. Neither you, the reader, nor I have infinite patience, so I won’t discuss every single argument to every single call! I’ll focus on the parts that I think really help to tell the story of what’s happening when a user space program interacts with an eBPF program.
Loading BTF Data
The first call to bpf() that I see looks like this:
bpf(BPF_BTF_LOAD, {btf="\237\353\1\0...}, 128) = 3
In this case the command you can see in the output is BPF_BTF_LOAD. This is just one of a set of valid commands that are (at least at the time of this writing) most comprehensively documented within the kernel source code.1
It’s possible that you won’t see a call with this command if you’re using a relatively old Linux kernel, as it relates to BTF, or BPF Type Format.2 BTF allows eBPF programs to be portable across different kernel versions so that you can compile a program on one machine and use it on another, which might be using a different kernel version and hence have different kernel data structures. I’ll discuss this in more detail in Chapter 5.
This call to bpf() is loading a blob of BTF data into the kernel, and the return code from the bpf() system call (3 in my example) is a file descriptor that refers to that data.
Note
A file descriptor is an identifier for an open file (or file-like object). If you open a file (with the open() or openat() system call) the return code is a file descriptor, which is then passed as an argument to other syscalls such as read() or write() to perform operations on that file. Here the blob of data isn’t exactly a file, but it is given a file descriptor as an identifier that can be used for future operations that refer to it.
Creating Maps
The next bpf() creates the output perf buffer map:
bpf(BPF_MAP_CREATE, {map_type=BPF_MAP_TYPE_PERF_EVENT_ARRAY, , key_size=4,
value_size=4, max_entries=4, ... map_name="output", ...}, 128) = 4
You can probably guess from the command name BPF_MAP_CREATE that this call creates an eBPF map. You can see that the type of this map is PERF_EVENT_ARRAY and it is called output. The keys and values in this perf event map are 4 bytes long. There’s also a limit of four key–value pairs that can be held in this map, defined by the field max_entries; I’ll explain why there are four entries in this map later in this chapter. The return value of 4 is the file descriptor for the user space code to access the output map.
The next bpf() system call in the output creates the config map:
bpf(BPF_MAP_CREATE, {map_type=BPF_MAP_TYPE_HASH, key_size=4, value_size=12,
max_entries=10240... map_name="config", ...btf_fd=3,...}, 128) = 5
This map is defined to be a hash table map, with keys that are 4 bytes long (which corresponds to a 32-bit integer that can be used to hold a user ID) and values that are 12 bytes long (which matches the length of the msg_t structure). I didn’t specify the size of the table, so it has been given BCC’s default size of 10,240 entries.
This bpf() system call also returns a file descriptor, 5, which will be used to refer to this config map in future syscalls.
You can also see the field btf_fd=3, which tells the kernel to use the BTF file descriptor 3 that was obtained earlier. As you’ll see in Chapter 5, BTF information describes the layout of data structures, and including this in the definition of the map means there’s information about the layout of the key and value types used in this map. This is used by tools like bpftool to pretty-print map dumps, making them human readable—you saw an example of this in Chapter 3.
Loading a Program
So far you have seen the example program using syscalls to load BTF data into the kernel and create some eBPF maps. The next thing it does is load the eBPF program being loaded into the kernel with the following bpf() syscall:
bpf(BPF_PROG_LOAD, {prog_type=BPF_PROG_TYPE_KPROBE, insn_cnt=44,
insns=0xffffa836abe8, license="GPL", ... prog_name="hello", ...
expected_attach_type=BPF_CGROUP_INET_INGRESS, prog_btf_fd=3,...}, 128) = 6
Quite a few of the fields here are interesting:
The
prog_typefield describes the program type, which here indicates that it’s intended to be attached to a kprobe. You’ll learn more about program types in Chapter 7.The
insn_cntfield means “instruction count.” This is the number of bytecode instructions in the program.The bytecode instructions that make up this eBPF program are held in memory at the address specified in the
insnsfield.This program was specified as GPL licensed so that it can use GPL-licensed BPF helper functions.
The program name is
hello.The
expected_attach_typeofBPF_CGROUP_INET_INGRESSmight seem surprising, because that sounds like something to do with ingress network traffic, but you know this eBPF program is going to be attached to a kprobe. In fact, theexpected_attach_typefield is only used for some program types, andBPF_PROG_TYPE_KPROBEisn’t one of them.BPF_CGROUP_INET_INGRESSjust happens to be the first in the list of BPF attachment types,3 so it has the value0.The
prog_btf_fdfield tells the kernel which blob of previously loaded BTF data to use with this program. The value3here corresponds to the file descriptor you saw returned from theBPF_BTF_LOADsyscall (and it’s the same blob of BTF data used for theconfigmap).
If the program had failed verification (which I’ll discuss in Chapter 6), this syscall would have returned a negative value, but here you can see it returned the file descriptor 6. To recap, at this point the file descriptors have the meanings shown in Table 4-1.
| File descriptor | Represents |
|---|---|
3 |
BTF data |
4 |
output perf buffer map |
5 |
config hash table map |
6 |
hello eBPF program |
Modifying a Map from User Space
You already saw the line in the Python user space source code that configures special messages that will be displayed for the root user with user ID 0, and for the user with ID 501:
b["config"][ct.c_int(0)]=ct.create_string_buffer(b"Hey root!")b["config"][ct.c_int(501)]=ct.create_string_buffer(b"Hi user 501!")
You can see these entries being defined in the map through syscalls like this:
bpf(BPF_MAP_UPDATE_ELEM, {map_fd=5, key=0xffffa7842490, value=0xffffa7a2b410,
flags=BPF_ANY}, 128) = 0
The BPF_MAP_UPDATE_ELEM command updates the key–value pair in a map. The BPF_ANY flag indicates that if the key doesn’t already exist in this map, it should be created. There are two of these calls, corresponding to the two entries configured for two different user IDs.
The map_fd field identifies which map is being operated on. You can see that in this case it’s 5, which is the file descriptor value returned earlier when the config map was created.
File descriptors are assigned by the kernel for a particular process, so this value of 5 is only valid for this particular user space process in which the Python program is running. However, multiple user space programs (and multiple eBPF programs in the kernel) can all access the same map. Two user space programs that access the same map structure in the kernel might very well be assigned different file descriptor values; equally, two user space programs might have the same file descriptor value for entirely different maps.
Both the key and the value are pointers, so you can’t tell the numeric value of either the key or the value from this strace output. You could, however, use bpftool to view the map’s contents and see something like this:
$ bpftool map dump name config
[{
        "key": 0,
        "value": {
            "message": "Hey root!"
        }
    },{
        "key": 501,
        "value": {
            "message": "Hi user 501!"
        }
    }
]
How does bpftool know how to format this output? For example, how does it know the value is a structure, with a field called message that contains a string? The answer is that it uses the definitions in the BTF information included on the BPF_MAP_CREATE syscall that defined this map. You’ll see more details on how BTF conveys this information in the next chapter.
You’ve now seen how user space interacts with the kernel to load programs and maps and to update the information in a map. In the sequence of syscalls you have seen up to this point, the program hasn’t yet been attached to an event. This step has to happen; otherwise, the program will never be triggered.
Fair warning: different types of eBPF programs get attached to different events in a variety of different ways! Later in this chapter I’ll show you the syscalls used in this example to attach to the kprobe event, and in this case it doesn’t involve bpf(). In contrast, in the exercises at the end of this chapter I will show you another example where a bpf() syscall is used to attach a program to a raw tracepoint event.
Before we get to those details, I’d like to discuss what happens when you quit running the program. You’ll find that the program and maps are automatically unloaded, and this happens because the kernel is keeping track of them using reference counts.
BPF Program and Map References
You know that loading a BPF program into the kernel with the bpf() syscall returns a file descriptor. Within the kernel, this file descriptor is a reference to the program. The user space process that made the syscall owns this file descriptor; when that process exits, the file descriptor gets released, and the reference count to the program is decremented. When there are no references left to a BPF program, the kernel removes the program.
An additional reference is created when you pin a program to the filesystem.
Pinning
You already saw pinning in action in Chapter 3, with the following command:
bpftool prog load hello.bpf.o /sys/fs/bpf/hello
Note
These pinned objects aren’t real files persisted to disk. They are created on a pseudo filesystem, which behaves like a regular disk-based filesystem with directories and files. But they are held in memory, which means they will not remain in place over a system reboot.
If bpftool were to allow you to load the program without pinning it, that would be pointless, because the file descriptor gets released when bpftool exits, and if there are zero references, the program would get deleted, so nothing useful would have been achieved. But pinning it to the filesystem means there is an additional reference to the program, so the program remains loaded after the command completes.
The reference counter also gets incremented when a BPF program is attached to a hook that will trigger it. The behavior of these reference counts depends on the BPF program type. You’ll learn more about these program types in Chapter 7, but there are some that relate to tracing (like kprobes and tracepoints) and are always associated with a user space process; for these types of eBPF programs, the kernel’s reference count gets decremented when that process exits. Programs that are attached within the network stack or cgroups (short for “control groups”) aren’t associated with any user space process, so they stay in place even after the user space program that loads them exits. You already saw an example of this when loading an XDP program with the ip link command:
ip link set dev eth0 xdp obj hello.bpf.o sec xdp
The ip command has completed, and there is no definition of a pinned location, but nevertheless, bpftool will show you that the XDP program is loaded in the kernel:
$ bpftool prog list
…
1255: xdp  name hello  tag 9d0e949f89f1a82c  gpl
        loaded_at 2022-11-01T19:21:14+0000  uid 0
        xlated 48B  jited 108B  memlock 4096B  map_ids 612
The reference count for this program is nonzero, because of the attachment to the XDP hook that persisted after the ip link command completed.
eBPF maps also have reference counters, and they get cleaned up when their reference count drops to zero. Each eBPF program that uses a map increments the counter, as does each file descriptor that user space programs might hold to the map.
It’s possible that the source code for an eBPF program might define a map that the program doesn’t actually reference. Suppose you wanted to store some metadata about a program; you could define it as a global variable, and as you saw in the previous chapter, this information gets stored in a map. If the eBPF program doesn’t do anything with that map, there won’t automatically be a reference count from the program to the map. There’s a BPF(BPF_PROG_BIND_MAP) syscall that associates a map with a program so that the map doesn’t get cleaned up as soon as the user space loader program exits and is no longer holding a file descriptor reference to the map.
Maps can also be pinned to the filesystem, and user space programs can gain access to the map by knowing the path to the map.
Note
Alexei Starovoitov wrote a good description of BPF reference counters and file descriptors in his blog post “Lifetime of BPF Objects”.
Another way to create a reference to a BPF program is with a BPF link.
BPF Links
BPF links provide a layer of abstraction between an eBPF program and the event it’s attached to. A BPF link itself can be pinned to the filesystem, which creates an additional reference to the program. This means the user space process that loaded the program into the kernel can terminate, leaving the program loaded. The file descriptor for the user space loader program gets freed up, decreasing the count of references to the program, but the reference count will be nonzero because of the BPF link.
You’ll get an opportunity to see BPF links in action if you follow the exercises at the end of this chapter. For now, let’s get back to the sequence of bpf() syscalls used by hello-buffer-config.py.
Additional Syscalls Involved in eBPF
To recap, so far you have seen bpf() syscalls that add the BTF data, program and maps, and map data to the kernel. The next thing the strace output shows relates to setting up the perf buffer.
Note
The rest of this chapter dives relatively deeply into the syscall sequences involved when using perf buffers, ring buffers, kprobes, and map iterations. Not all eBPF programs need to do these things, so if you’re in a hurry or you’re finding it a bit too detailed, feel free to skip to the chapter summary. I won’t be offended!
Initializing the Perf Buffer
You have seen the bpf(BPF_MAP_UPDATE_ELEM) calls that add entries into the config map. Next, the output shows some calls that look like this:
bpf(BPF_MAP_UPDATE_ELEM, {map_fd=4, key=0xffffa7842490, value=0xffffa7a2b410,
flags=BPF_ANY}, 128) = 0
These look very similar to the calls that defined the config map entries, except in this case the map’s file descriptor is 4, which represents the output perf buffer map.
As before, the key and the value are pointers, so you can’t tell the numeric value of either the key or the value from this strace output. I see this syscall repeated four times with identical values for all the parameters, though there’s no way of knowing whether the values the pointers hold have changed between each call. Looking at these BPF_MAP_UPDATE_ELEM bpf() calls leaves some unanswered questions about how the buffer is set up and used:
Why are there four calls to
BPF_MAP_UPDATE_ELEM? Does this relate to the fact that theoutputmap was created with a maximum of four entries?After these four instances of
BPF_MAP_UPDATE_ELEM, no morebpf()syscalls appear in thestraceoutput. That might seem a little odd, because the map is there so that the eBPF program can write data every time it is triggered, and you’ve seen data being displayed by the user space code. That data is clearly not being retrieved from the map withbpf()syscalls, so how is it obtained?
You’ve also yet to see any evidence of how the eBPF program is getting attached to the kprobe event that triggers it. To get the explanation for all these concerns, I need strace to show a few more syscalls when running this example, like this:
$ strace -e bpf,perf_event_open,ioctl,ppoll ./hello-buffer-config.py
For brevity, I’m going to ignore calls to ioctl() that aren’t specifically related to the eBPF functionality of this example.
Attaching to Kprobe Events
You’ve seen that file descriptor 6 was assigned to represent the eBPF program hello once it was loaded into the kernel. To attach the eBPF program to an event, you also need a file descriptor representing that particular event. The following line from the strace output shows the creation of the file descriptor for the execve() kprobe:
perf_event_open({type=0x6 /* PERF_TYPE_??? */, ...},...) = 7
According to the manpage for the perf_event_open() syscall, it “creates a file descriptor that allows measuring performance information.” You can see from the output that strace doesn’t know how to interpret the type parameter with the value 6, but if you examine that manpage further, it describes how Linux supports dynamic types of Performance Measurement Unit:
…there is a subdirectory per PMU instance under /sys/bus/event_source/devices. In each subdirectory there is a type file whose content is an integer that can be used in the type field.
Sure enough, if you look under that directory, you’ll find a kprobe/type file:
$ cat /sys/bus/event_source/devices/kprobe/type
6
From this, you can see that the call to perf_event_open() has a type set to the value 6 to indicate that it’s a kprobe type of perf event.
Unfortunately, strace doesn’t output the details that would conclusively show that the kprobe is attached to the execve() syscall, but I hope there is enough evidence here to convince you that that’s what the file descriptor returned here represents.
The return code from perf_event_open() is 7, and this represents the file descriptor for the kprobe’s perf event, and you know that file descriptor 6 represents the hello eBPF program. The manpage for perf_event_open() also explains how to use ioctl() to create the attachment between the two:
PERF_EVENT_IOC_SET_BPF[...] allows attaching a Berkeley Packet Filter (BPF) program to an existing kprobe tracepoint event. The argument is a BPF program file descriptor that was created by a previousbpf(2)system call.
This explains the following ioctl() syscall that you’ll see in the strace output, with arguments referring to the two file descriptors:
ioctl(7, PERF_EVENT_IOC_SET_BPF, 6) = 0
There is also another ioctl() call that turns the kprobe event on:
ioctl(7, PERF_EVENT_IOC_ENABLE, 0) = 0
With this in place, the eBPF program should be triggered whenever execve() is run on this machine.
Setting Up and Reading Perf Events
I already mentioned that I see four calls to bpf(BPF_MAP_UPDATE_ELEM) related to the output perf buffer. With the additional syscalls being traced, the strace output shows four sequences, like this:
perf_event_open({type=PERF_TYPE_SOFTWARE, size=0 /* PERF_ATTR_SIZE_??? */,
config=PERF_COUNT_SW_BPF_OUTPUT, ...}, -1, X, -1, PERF_FLAG_FD_CLOEXEC) = Y

ioctl(Y, PERF_EVENT_IOC_ENABLE, 0)      = 0

bpf(BPF_MAP_UPDATE_ELEM, {map_fd=4, key=0xffffa7842490, value=0xffffa7a2b410,
flags=BPF_ANY}, 128) = 0
I’ve used X to indicate where the output shows values 0, 1, 2, and 3 in the four instances of this call. Referring to the manpage for the perf_event_open() syscall, you’ll see that this is the cpu, and the field before it is pid or process ID. From the manpage:
pid == -1 and cpu >= 0
This measures all processes/threads on the specified CPU.
The fact that this sequence happens four times corresponds to there being four CPU cores in my laptop. This, at last, is the explanation for why there are four entries in the “output” perf buffer map: there is one for each CPU core. It also explains the “array” part of the map type name BPF_MAP_TYPE_PERF_EVENT_ARRAY, as the map doesn’t just represent one perf ring buffer but an array of buffers, one for each core.
If you write eBPF programs, you won’t need to worry about details like handling the number of cores, as this will be taken care of for you by any of the eBPF libraries discussed in Chapter 10, but I think it’s an interesting aspect of the syscalls you see when you use strace on this program.
The perf_event_open() calls each return a file descriptor, which I’ve represented as Y; these have the values 8, 9, 10, and 11. The ioctl() syscalls enable the perf output for each of these file descriptors. The BPF_MAP_UPDATE_ELEM bpf() syscalls set the map entry to point to the perf ring buffer for each CPU core to indicate where it can submit data.
User space code can then use ppoll() on all four of these output stream file descriptors so that it can get the data output, whichever core happens to run the eBPF program hello for any given execve() kprobe event. Here’s the syscall to ppoll():
ppoll([{fd=8, events=POLLIN}, {fd=9, events=POLLIN}, {fd=10, events=POLLIN},
{fd=11, events=POLLIN}], 4, NULL, NULL, 0) = 1 ([{fd=8, revents=POLLIN}])
As you’ll see if you try running the example program yourself, these ppoll() calls block until there is something to read from one of the file descriptors. You won’t see the return code written to the screen until something triggers execve(), which causes the eBPF program to write data that user space retrieves using this ppoll() call.
In Chapter 2 I mentioned that if you have a kernel of version 5.8 or above, BPF ring buffers are now preferred over perf buffers.4 Let’s take a look at a modified version of the same example code that uses a ring buffer.
Ring Buffers
As discussed in the kernel documentation, ring buffers are preferred over perf buffers partly for performance reasons, but also to ensure that the ordering of data is preserved, even if the data is submitted by different CPU cores. There is just one buffer, shared across all cores.
There aren’t many changes needed to convert hello-buffer-config.py to use a ring buffer. In the accompanying GitHub repo you’ll find this example as chapter4/hello-ring-buffer-config.py. Table 4-2 shows the differences.
| hello-buffer-config.py | hello-ring-buffer-config.py |
|---|---|
BPF_PERF_OUTPUT(output); |
BPF_RINGBUF_OUTPUT(output, 1); |
output.perf_submit(ctx, &data, sizeof(data)); |
output.ringbuf_output(&data, sizeof(data), 0); |
b["output"]. |
b["output"]. |
b.perf_buffer_poll() |
b.ring_buffer_poll() |
As you’d expect, since these changes relate only to the output buffer, the syscalls related to loading the program and the config map and attaching the program to the kprobe event all remain unchanged.
The bpf() syscall that creates the output ring buffer map looks like this:
bpf(BPF_MAP_CREATE, {map_type=BPF_MAP_TYPE_RINGBUF, key_size=0, value_size=0,
max_entries=4096, ... map_name="output", ...}, 128) = 4
The major difference in the strace output is that there is no sign of the series of four different perf_event_open(), ioctl(), and bpf(BPF_MAP_UPDATE_ELEM) system calls that you observed during the setup of a perf buffer. For a ring buffer, there’s just the one file descriptor shared across all CPU cores.
At the time of this writing, BCC is using the ppoll mechanism I showed earlier for perf buffers, but it uses the newer epoll mechanism to wait for data from the ring buffer. Let’s use this as an opportunity to understand the difference between ppoll and epoll.
In the perf buffer example, I showed hello-buffer-config.py generating a ppoll() syscall, like this:
ppoll([{fd=8, events=POLLIN}, {fd=9, events=POLLIN}, {fd=10, events=POLLIN},
{fd=11, events=POLLIN}], 4, NULL, NULL, 0) = 1 ([{fd=8, revents=POLLIN}])
Notice that this passes in the set of file descriptors 8, 9, 10, and 11 from which the user space process wants to retrieve data. Every time this poll event returns data, another call has to be made to ppoll() to set up the same set of file descriptors all over again. When using epoll, the file descriptor set is managed in a kernel object.
You can see this in the following sequence of epoll-related system calls made when hello-ring-buffer-config.py is setting up access to the output ring buffer.
First, the user space program asks for a new epoll instance to be created in the kernel:
epoll_create1(EPOLL_CLOEXEC) = 8
This returns file descriptor 8. Then there is a call to epoll_ctl(), which tells the kernel to add file descriptor 4 (the output buffer) to the set of file descriptors in that epoll instance:
epoll_ctl(8, EPOLL_CTL_ADD, 4, {events=EPOLLIN, data={u32=0, u64=0}}) = 0
The user space program uses epoll_pwait() to wait until data is available in the ring buffer. This call only returns when data is available:
epoll_pwait(8, [{events=EPOLLIN, data={u32=0, u64=0}}], 1, -1, NULL, 8) = 1
Of course, if you’re writing code using a framework like BCC (or libbpf or any of the other libraries I’ll describe later in this book), you really don’t need to know these underlying details about how your user space application gets information from the kernel via perf or ring buffers. I hope you’ve found it interesting to get a peek under the covers to see how these things work.
However, you might well find yourself writing code that accesses a map from user space, and it might be helpful to see an example of how this is achieved. Earlier in this chapter, I used bpftool to examine the contents of the config map. Since it’s a utility that runs in user space, let’s use strace to see what syscalls it’s making to retrieve this information.
Reading Information from a Map
The following command shows an extract of the bpf() syscalls that bpftool makes while reading the contents of the config map:
$ strace -e bpf bpftool map dump name config
As you’ll see, the sequence consists of two main steps:
Iterate through all the maps, looking for any with the name
config.If a matching map is found, iterate through all the elements in that map.
Finding a Map
The output starts with a repeated sequence of similar calls, as bpftool walks through all the maps looking for any with the name config:
bpf(BPF_MAP_GET_NEXT_ID, {start_id=0,...}, 12) = 0
bpf(BPF_MAP_GET_FD_BY_ID, {map_id=48...}, 12) = 3
bpf(BPF_OBJ_GET_INFO_BY_FD, {info={bpf_fd=3, ...}}, 16) = 0

bpf(BPF_MAP_GET_NEXT_ID, {start_id=48, ...}, 12) = 0
bpf(BPF_MAP_GET_FD_BY_ID, {map_id=116, ...}, 12) = 3
bpf(BPF_OBJ_GET_INFO_BY_FD, {info={bpf_fd=3...}}, 16) = 0
BPF_MAP_GET_NEXT_IDgets the ID of the next map after the value specified instart_id.BPF_MAP_GET_FD_BY_IDreturns the file descriptor for the specified map ID.BPF_OBJ_GET_INFO_BY_FDretrieves information about the object (in this case, the map) referred to by the file descriptor. This information includes its name sobpftoolcan check whether this is the map it is looking for.- The sequence repeats, getting the ID of the next map after the one in step 1.
There’s a group of these three syscalls for each map loaded into the kernel, and you should also see that the values used for start_id and map_id match the IDs of those maps. The repeated pattern ends when there are no more maps left to look at, which results in BPF_MAP_GET_NEXT_ID returning a value of ENOENT, like this:
bpf(BPF_MAP_GET_NEXT_ID, {start_id=133,...}, 12) = -1 ENOENT (No such file or
directory)
If a matching map has been found, bpftool holds its file descriptor so that it can read the elements out of that map.
Reading Map Elements
At this point bpftool has a file descriptor reference to the map(s) it’s going to read from. Let’s look at the syscall sequence for reading that information:
bpf(BPF_MAP_GET_NEXT_KEY, {map_fd=3, key=NULL,
next_key=0xaaaaf7a63960}, 24) = 0
bpf(BPF_MAP_LOOKUP_ELEM, {map_fd=3, key=0xaaaaf7a63960,
value=0xaaaaf7a63980, flags=BPF_ANY}, 32) = 0
[{
        "key": 0,
        "value": {
            "message": "Hey root!"
        }
bpf(BPF_MAP_GET_NEXT_KEY, {map_fd=3, key=0xaaaaf7a63960,
next_key=0xaaaaf7a63960}, 24) = 0
bpf(BPF_MAP_LOOKUP_ELEM, {map_fd=3, key=0xaaaaf7a63960,
value=0xaaaaf7a63980, flags=BPF_ANY}, 32) = 0
    },{
        "key": 501,
        "value": {
            "message": "Hi user 501!"
        }
bpf(BPF_MAP_GET_NEXT_KEY, {map_fd=3, key=0xaaaaf7a63960,
next_key=0xaaaaf7a63960}, 24) = -1 ENOENT (No such file or directory)
    }
]
+++ exited with 0 +++
- First, the application needs to find a valid key that is present in the map. It does this with the
BPF_MAP_GET_NEXT_KEYflavor of thebpf()syscall. Thekeyargument is a pointer to a key, and the syscall will return the next valid key after this one. By passing in a NULL pointer, the application is requesting the first valid key in the map. The kernel writes the key into the location specified by thenext_keypointer. - Given a key, the application requests the associated value, which gets written to the memory location specified by
value. - At this point,
bpftoolhas the contents of the first key–value pair, and it writes this information to the screen. - Here,
bpftoolmoves on to the next key in the map, retrieves its value, and writes out this key–value pair to the screen. - The next call to
BPF_MAP_GET_NEXT_KEYreturnsENOENTto indicate that there are no more entries in the map. - Here,
bpftoolfinalizes the output written to screen and exits.
Notice that here, bpftool has been assigned file descriptor 3 to correspond to the config map. This is the same map that hello-buffer-config.py refers to with file descriptor 4. As I’ve mentioned already, file descriptors are process specific.
This analysis of how bpftool behaves shows how a user space program can iterate through the available maps and through the key–value pairs stored in a map.
Summary
In this chapter you saw how user space code uses the bpf() syscall to load eBPF programs and maps. You saw programs and maps being created using the BPF_PROG_LOAD and BPF_MAP_CREATE commands.
You learned that the kernel keeps track of the number of references to eBPF programs and maps, releasing them when the reference count drops to zero. You were also introduced to the concepts of pinning BPF objects to a filesystem and using BPF links to create additional references.
You saw an example of BPF_MAP_UPDATE_ELEM being used to create entries in a map from user space. There are similar commands—BPF_MAP_LOOKUP_ELEM and BPF_MAP_DELETE_ELEM—for retrieving and deleting values from a map. There is also the command BPF_MAP_GET_NEXT_KEY for finding the next key that’s present in a map. You can use this to iterate through all the valid entries.
You saw examples of user space programs making use of perf_event_open() and ioctl() for attaching eBPF programs to kprobe events. The attachment method can be very different for other types of eBPF programs, and some of them even use the bpf() system call. For example, there’s a bpf(BPF_PROG_ATTACH) syscall that can be used to attach cgroup programs, and bpf(BPF_RAW_TRACEPOINT_OPEN) for raw tracepoints (see Exercise 5 at the end of this chapter).
I also showed how you can use BPF_MAP_GET_NEXT_ID, BPF_MAP_GET_FD_BY_ID, and BPF_OBJ_GET_INFO_BY_FD to locate map (and other) objects held by the kernel.
There are some other bpf() commands that I haven’t covered in this chapter, but what you have seen here is enough to get a good overview.
You also saw some BTF data being loaded into the kernel, and I mentioned that bpftool uses this information to understand the format of data structures so that it can print them out nicely. I didn’t explain yet what BTF data looks like or how it’s used to make eBPF programs portable across kernel versions. That’s coming up in the next chapter.
Exercises
Here are a few things you can try if you’d like to explore the bpf() syscall further:
Confirm that the
insn_cntfield from aBPF_PROG_LOADsystem call corresponds to the number of instructions that are output if you dump the translated eBPF bytecode for that program usingbpftool. (This is as documented on the manpage for thebpf()system call.)Run two instances of the example program so that there are two maps called
config. If you runbpftool map dump name config, the output will include information about the two different maps as well as their contents. Run this understrace, and follow the use of different file descriptors through the syscall output. Can you see where it’s retrieving information about a map and where it’s retrieving the key–value pairs stored within it?Use
bpftool map updateto modify theconfigmap while one of the example programs is running. Usesudo -u usernameto check that these configuration changes are picked up by the eBPF program.While hello-buffer-config.py is running, use
bpftoolto pin the program to the BPF filesystem, like this:bpftool prog pin name hello /sys/fs/bpf/hi
Quit the running program, and check that the hello program is still loaded in the kernel using
bpftool prog list. You can clean up the link by removing the pin withrm /sys/fs/bpf/hi.Attaching to a raw tracepoint is considerably more straightforward at the syscall level than attaching to a kprobe, as it simply involves a
bpf()syscall. Try converting hello-buffer-config.py to attach to the raw tracepoint forsys_enter, using BCC’sRAW_TRACEPOINT_PROBEmacro (if you did the exercises in Chapter 2, you’ll already have a suitable program you can use). You won’t need to explicitly attach the program in the Python code, as BCC will take care of it for you. Running this understrace, you should see a syscall similar to this:bpf(BPF_RAW_TRACEPOINT_OPEN, {raw_tracepoint={name="sys_enter", prog_fd=6}}, 128) = 7The tracepoint in the kernel has the name
sys_enter, and the eBPF program with file descriptor6is being attached to it. From now on, whenever execution in the kernel reaches that tracepoint, it will trigger the eBPF program.Run the opensnoop application from BCC’s set of libbpf tools. This tool sets up some BPF links that you can see with
bpftool, like this:$ bpftool link list 116: perf_event prog 1849 bpf_cookie 0 pids opensnoop(17711) 117: perf_event prog 1851 bpf_cookie 0 pids opensnoop(17711)Confirm that the program IDs (1849 and 1851 in my example output here) match the output from listing the loaded eBPF programs:
$ bpftool prog list
...
1849: tracepoint  name tracepoint__syscalls__sys_enter_openat
        tag 8ee3432dcd98ffc3  gpl run_time_ns 95875 run_cnt 121
        loaded_at 2023-01-08T15:49:54+0000  uid 0
        xlated 240B  jited 264B  memlock 4096B  map_ids 571,568
        btf_id 710
        pids opensnoop(17711)
1851: tracepoint  name tracepoint__syscalls__sys_exit_openat
        tag 387291c2fb839ac6  gpl run_time_ns 8515669 run_cnt 120
        loaded_at 2023-01-08T15:49:54+0000  uid 0
        xlated 696B  jited 744B  memlock 4096B  map_ids 568,571,569
        btf_id 710
        pids opensnoop(17711)
While opensnoop is running, try pinning one of these links with
bpftool link pin id 116 /sys/fs/bpf/mylink(using one of the link IDs you see output frombpftool link list). You should see that even after you terminate opensnoop, both the link and the corresponding program remain loaded in the kernel.If you skip ahead to the example code for Chapter 5, you’ll find a version of hello-buffer-config.py written using the libbpf library. This library automatically sets up a BPF link to the program that it loads into the kernel. Use
straceto inspect thebpf()system calls that it makes, and seebpf(BPF_LINK_CREATE)system calls.
1 If you want to see the full set of BPF commands, they’re documented in the linux/bpf.h header file.
2 BTF was introduced upstream in the 5.1 kernel, but it has been back-ported on some Linux distributions, as you can see from this discussion.
3 These are defined in the bpf_attach_type enumerator in linux/bpf.h.
4 A reminder that for more information on the difference, read Andrii Nakryiko’s “BPF ring buffer” blog post.
Get Learning eBPF now with the O’Reilly learning platform.
O’Reilly members experience books, live events, courses curated by job role, and more from O’Reilly and nearly 200 top publishers.

