Chapter 17. Introducing D3ââThe Story of a Bar Chart
In Chapter 16, we imagined our Nobel Prize visualization by breaking it into component elements. In this chapter, I will gently introduce you to D3 by showing you how to build the bar chart we need (Figure 17-1).
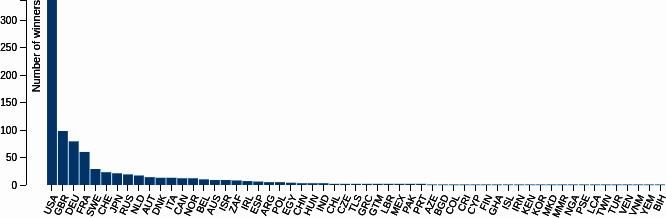
Figure 17-1. This chapterâs target bar chart
D3 is much more than a charting library. Itâs a library you use to build charting libraries, among other things. So why am I introducing you to D3 by way of that ultra-conventional visualization, the bar chart? First, because there should be a little thrill in crafting one from scratch for the first time, having total control over the look and feel of the chart and being unconstrained by whatever prejudices a particular charting library has. And second, because it just happens to be a great way to cover the fundamental elements of D3, particularly data joining and the enter-exit-remove update pattern, now nicely encapsulated by D3âs newish join method. If you get those fundamentals in place, youâre well on your way to employing the full power and expressivity D3 offers, and producing something more novel than a bar chart.
Weâll be using some of the webdev covered in Chapter 4, particularly the SVG graphics that are D3âs specialty (see âScalable Vector Graphicsâ). You can try out the code snippets using an online editor like CodePenâs or VizHubâs ...
Get Data Visualization with Python and JavaScript, 2nd Edition now with the O’Reilly learning platform.
O’Reilly members experience books, live events, courses curated by job role, and more from O’Reilly and nearly 200 top publishers.

