Chapter 16. Building a Visualization
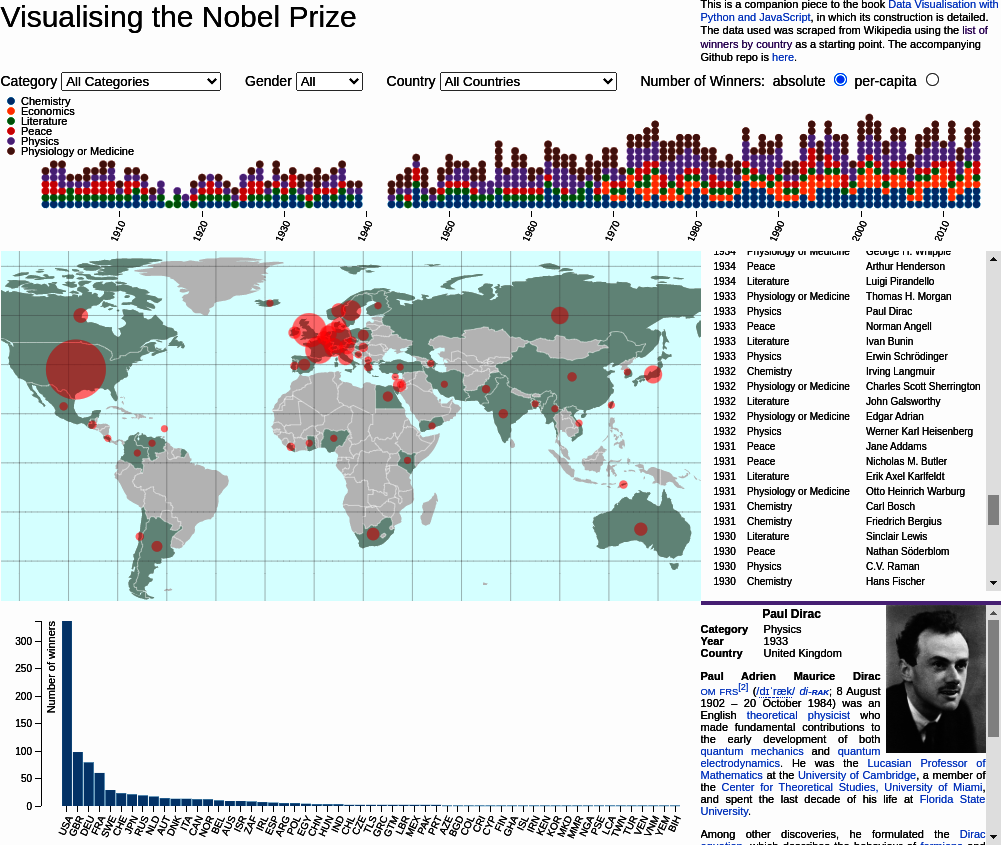
In Chapter 15, we used the results of our pandas exploration of the Nobel Prize dataset (see Chapter 11) to imagine a visualization. Figure 16-1 shows the visualization we imagined, and in this chapter weâll see how to go about building it, leveraging the power of JavaScript and D3.

Figure 16-1. Our target, a Nobel Prize visualization
Iâll show how the visual elements we conceived combine to transform our freshly cleaned and processed Nobel dataset into an interactive web visualization, deployable to billions of devices at the flick of a switch. But before going into the details, letâs have a look at the core components of a modern web visualization.
Preliminaries
Before beginning to build the Nobel visualization, letâs consider the core components that will be used and how we will organize our files.
Core Components
As we saw in âA Basic Page with Placeholdersâ, building a modern web visualization requires four key components:
-
An HTML skeleton upon which to hang our JavaScripted creation
-
One or more CSS files to govern the look and feel of the dataviz
-
The JavaScript files themselves, including any third-party libraries you might need (D3 being our biggest dependency)
-
And last but not least, the data to be transformed, ideally in the JSON or CSV (if wholly static data) format
Before we start looking at our dataviz ...
Get Data Visualization with Python and JavaScript, 2nd Edition now with the O’Reilly learning platform.
O’Reilly members experience books, live events, courses curated by job role, and more from O’Reilly and nearly 200 top publishers.

