Chapter 4. Getting to Know Microsoft Dataverse
In Chapter 3, we used Power Apps to create a simple app to track our own professional skills. We used an Excel spreadsheet stored in OneDrive for Business to save and keep track of those skills, and our Power App was responsible for reading from and writing to that spreadsheet. We also saw how the approach that we used created forms so that we can see our entries and select from that list. We even saw that we could create new skills and edit existing skills. With that foundation, you can go on to create a lot of other personal apps—but apps that are meant to be shared with others tend to be more complex, particularly in the way that data is saved. That’s where Microsoft Dataverse (among other potential services) comes in.
So what is Microsoft Dataverse? Dataverse is a secure database, but like everything else in the Power Platform, it’s designed to take away a lot of the complexity behind setting up a proper database. It allows you to create tables of information, and you can define relationships between those tables. Dataverse will also help you out by creating a series of common standard columns as part of your tables, like Created By, Created On, Modified By, Status, and more. The benefit of this is that you’ll have columns that you can use for auditing and reporting; these columns are often overlooked by new users, so you won’t have to worry about circling back to add them in if you forgot a few.
As we saw in Figure 2-7, Dataverse comes with quite a lot of features that span security, logic, data, storage, and integration. Dataverse tables and data are stored in the cloud, and you can control who has access to that data. It also comes with a series of preconfigured tables with columns, views, and forms already defined. You can build apps, flows, and reports that can access Dataverse’s centrally managed data, and you can access that data from services outside of the Power Platform as well.
We’re going to dive right into Microsoft Dataverse by creating our own tables and seeing how we can store data. After our setup, we’ll walk through why Dataverse is important and how we can use it within the Power Platform.
Creating an Environment
The first thing that you need when creating a Dataverse database is an environment. Environments are essentially containers where you can store apps and data. They also provide a way to secure your data by allowing you to use role-based access.
Go to the Power Platform Admin center by clicking the gear icon in the top-right corner of a Power Platform service like Power Apps and selecting “Admin center” (Figure 4-1).
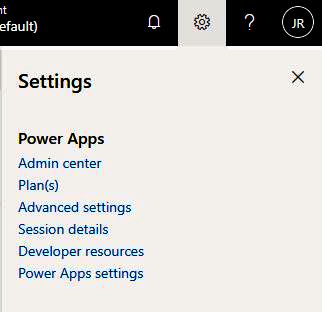
Figure 4-1. The Power Platform “Admin center” link
Once you’re in the Power Platform Admin center, you’ll see a list of your environments. To create a new one, simply click New in the menu just above the Environments header (Figure 4-2).

Figure 4-2. The Environments list
A pane will appear to the right, and from there, you will be able to create a new environment (Figure 4-3). In this pane, you’ll provide a name to help identify your environment. Next, you’ll choose from a set of types, select the region where your environment will reside, provide a description of your environment, and toggle whether or not you would like a database to be created for the environment.
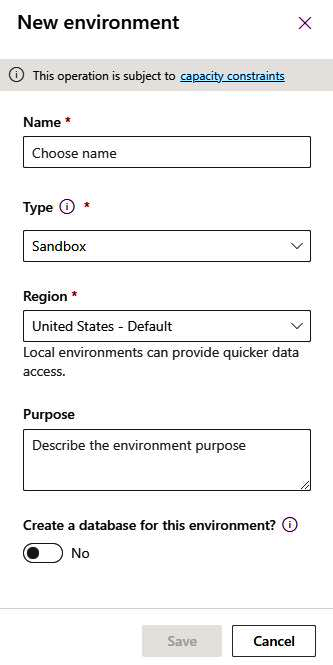
Figure 4-3. Creating a new environment
The types that you can choose from are Sandbox, Trial, and Production. Sandbox is used for testing or development purposes and is not meant to be used within the business. Trial can be used for short-term testing or proof-of-concept work that you don’t intend to keep. Trial environments will expire in 30 days and will automatically be removed. Production environments are meant for data and solutions that you intend to keep around and use within your business.
Choosing “Yes” for “Create a database for this environment?” will allow you to make some additional configurations. Set the language and currency to your preferred settings, and the rest can be left to their defaults. Note that there are options to deploy sample apps and data and to restrict the environment to certain people. Click the Save button when you’re ready (Figure 4-4).
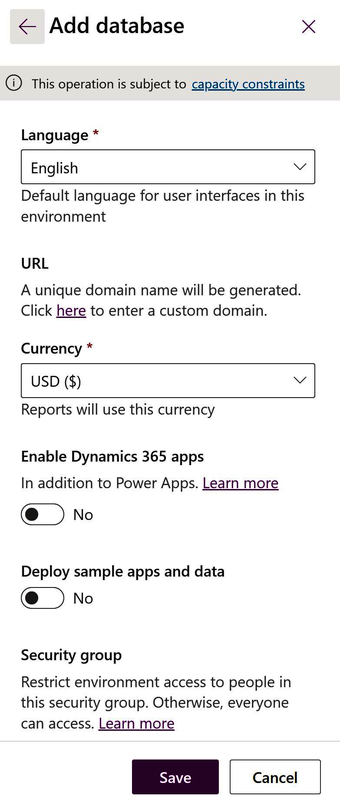
Figure 4-4. Configuring the database
Creating Tables
In the previous section, you set up an environment with a database instance. Now that you have a database, you can start adding tables where you can store your data, define relationships, and create business rules. If you’re new to concepts like databases and tables, we’re simply going to be creating tables of information. Those tables will contain rows and columns, similar to a SharePoint list. When we create columns, we will be able to define what type of data can go into that column, and we’ll also be able to create columns that look up information from other tables. This is how we’ll define relationships between tables.
Let’s begin by creating some tables that we will use to store information. If you followed along in the previous chapter, we created an app that tracked your skills using a spreadsheet that was saved to OneDrive for Business. That app was used to demonstrate how you can replace spreadsheets with apps while still making use of those spreadsheets. That app was meant for personal use, but using a spreadsheet as a way to store data for multiple people isn’t something that I would recommend. We’re now going to build out tables that can be used to store our skills and the skills of others, and we’ll also take this opportunity to expand and improve how we’re collecting that data.
We will again start by navigating to Power Apps, where you will see an item in the left navigation menu titled either Data or Dataverse. If we expand that and click Tables, we’ll see a list of tables that have already been created for us (Figure 4-5). These are common tables that people may build, and we can use them to build our solutions. It’s worth taking a look around to see how they’re structured. When you’re done, click the “New table” button at the top of the page.
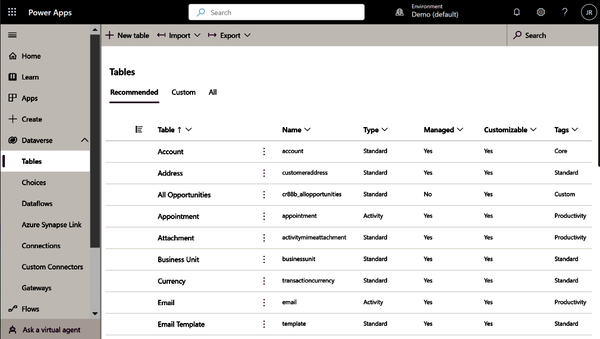
Figure 4-5. Dataverse tables
You’ll then be able to provide some information about your table, like its display name, which you will want to write in singular form (examples: Skill, Account, Contact) in order to follow the naming convention used by the other tables. We’ll call our table Skill. As you enter that value, you’ll immediately notice that the “Plural display name” field will begin to autopopulate with a plural version of the table name, as will the Name field, which will use a prefix to ensure that the table is unique in the event that someone else tries to create a table with the same name (Figure 4-6).
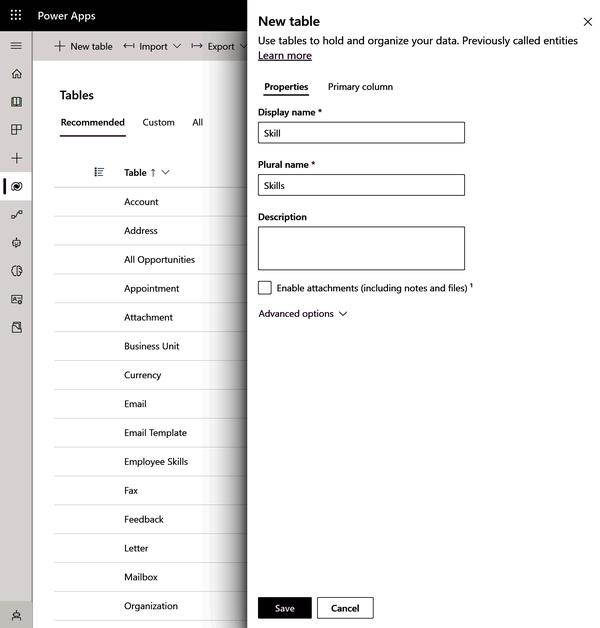
Figure 4-6. Creating the Skill table
You’ll also notice a Primary column tab in Figure 4-6 where you can name a primary column. This will be our unique identifier for any row of data. We’ll leave that field as is, and we’ll leave all the other settings with the default values. Hit Save, and you’ll have your new Skill table (Figure 4-7). When the table is created, you’ll see information about the table, including its properties, table schema or structure, data experiences (forms, views, etc.) and more. At this point, a single column has been defined in your table: the Name column. You’ll also see a lot of fields other than the primary column that get created automatically. This is Dataverse simplifying and automating the creation of common columns that can be used for auditing and other scenarios. That’s fantastic, as it allows you to focus on what you’re trying to build but protects you by filling in gaps that you may forget about and have to return to later.

Figure 4-7. The Skill table with additional columns automatically populated by Dataverse
We now have a Skill table that we only provided a single column for, not including the 18 additional columns that were autogenerated for us. This table will be used to keep a list of possible skills to select, but it won’t be used to keep track of each employee’s recorded skills. For that, we’ll create a new table called Employee Skills.
Expand Data or Dataverse in the lefthand menu (whichever option you see on your screen), click Tables, then click “New table” at the top of the page.
When the “New table” pane opens up, enter the following information:
- Display name: Employee Skills
- Plural name: Employee Skills
The rest can be left with the default values, and you can hit the Save button.
Before we move forward, let’s talk a little bit about the Employee Skills table and why we created it. We want to be able to capture the skills of more than one person, so the Employee Skills table will capture similar data to that of our first Power App (created at the end of Chapter 3): skills, proficiency ratings, and any notes that we want to include about a specific skill. Our original app was intended for just a single person to use, so there wasn’t any validation and the skills were entered manually. This meant nothing would stop you from entering the same information multiple times. For example, you could enter SharePoint, Sharepoint, and sharepoint, and they would all be recorded as individual items.
For an app that serves multiple people or an entire business, you’ll want to have more control over the data, especially if you plan to do any reporting on it. Take the example that I just provided where there were three different spellings for SharePoint. If you had to generate a report that told you how many employees had SharePoint experience, you might have 10 that spelled it properly (with a capital S and a capital P), 3 people that spelled it with a lowercase p, and 2 people that spelled it with all lowercase letters. If you’re not careful, you might search for only one of the spellings and get a partial list of employees with that skill.
In our scenario, the Skill table that we created first will contain the list of approved skills that the company wants to capture, and the Employee Skills table will be used to record individual skills.
Adding Columns and Creating Relationships
At this point, all we have are two tables (Skill and Employee Skills), and each has the default columns that come with a Dataverse table. The Skill table doesn’t need any additional columns, since all it really needs is the skill name—Dataverse took care of adding any other fields that we might need. For example, the table has a Skill column so that we can uniquely identify each individual skill and a Created By column, which we may be able to use to look up who created a new skill. There’s also a Status column, which is of type Choice and is set up with two choices, Active and Inactive. You could potentially use that column to limit which skills an employee can select. If your company no longer works with a specific product like SharePoint 2003 and no longer wishes to capture it, rather than deleting the record—which would impact any records that referenced that skill—you could set it to Inactive and add some logic to make sure that future entries don’t show it as an option. Additionally, when you’re creating reports, you could limit the results by only returning values for active skills.
To create new columns in the Employee Skills table, we can click on Columns in the Schema section, which will take us to a page containing the list of columns associated with the table. At the top of the page will be a New Column button. As you can see, the “Column properties” pane (Figure 4-8) looks very similar to the “New table” pane that we saw previously.
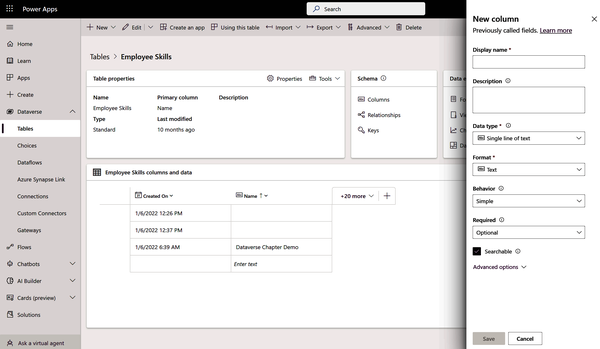
Figure 4-8. Adding a new column to Employee Skills
We’re going to create three columns using the following configuration, with everything else left at the default settings. The first column that we’re going to create is the Skill Name column, which will be a lookup into our Skill table. That will be where we get our list of possible skills to choose from. When creating the Skill Name column, the following column properties will be used:
- Display name: Skill Name
- Data type: Lookup
- Related table: Skill
- Required: Business required
Once the Skill Name column is complete, we’ll click the Save button and then click the “New column” button again so that we can create the next column, which will be our Proficiency column. This column will be a Choice field, which is similar to a lookup except that the values are self-contained within the table. In other words, the choices that we define are part of the column that belongs to Employee Skills, not values that are coming from another table altogether. The following list shows the column properties that will be used for the Proficiency column:
- Display name: Proficiency
- Data type: Choice
- Required: Business recommended
Before we can save these changes, we’ll need to define what our Choices are for this column. After you select Choice as your data type, a new drop-down menu will appear underneath that field called “Sync this choice with.” The drop-down will provide a list of existing Choice fields, which is great for reusability. We want to click New Choice underneath the dropdown, which will allow us to define our own reusable set of choices. After clicking New Choice (Figure 4-9), we’ll be presented with another pane where we can provide the display name (we’ll use “Proficiency”) and items.
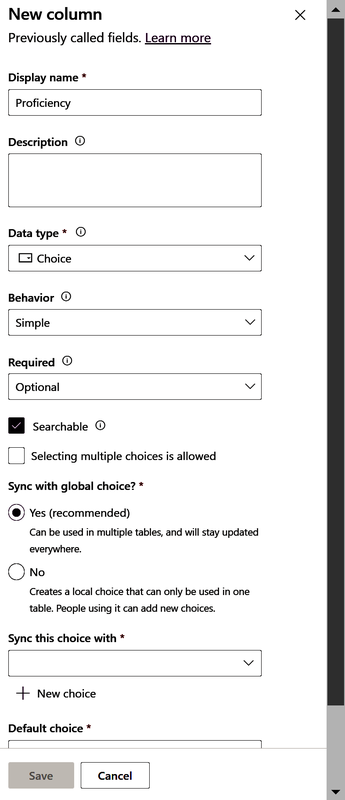
Figure 4-9. Creating reusable choices
In the Items section, we’re simply going to enter our first choice and click “New choice” to add the next. In our case, we only have three items: Beginner, Intermediate, and Expert (Figure 4-10). Once you’re done, you can click the Save button at the bottom of the pane.
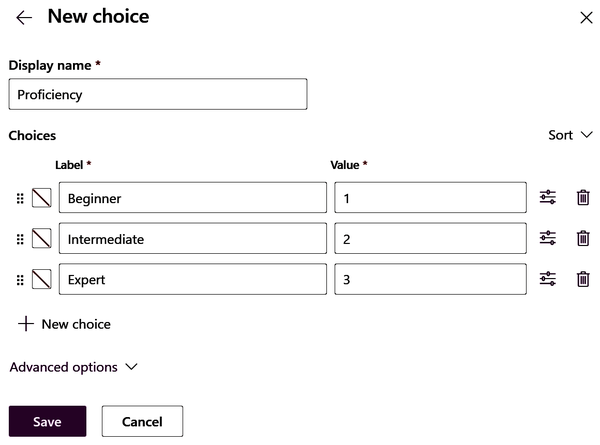
Figure 4-10. Defining your choices
Finally, you’ll want to verify your settings and click Done. As you can see in Figure 4-11, underneath the Choice field, we can specify a default value. In this example, I’m setting the default to Beginner and expect the person using the tool to choose the right value for them.

Figure 4-11. The configured Choice column
The last column we want to create is a Notes column that will simply allow us to enter any additional information we might want to add about a particular skill. The following list shows the column properties that will be used for the Notes column:
- Display name: Notes
- Data type: Text Area
- Required: Optional
Our Employee Skills table should look like Figure 4-12 when we’re all done.
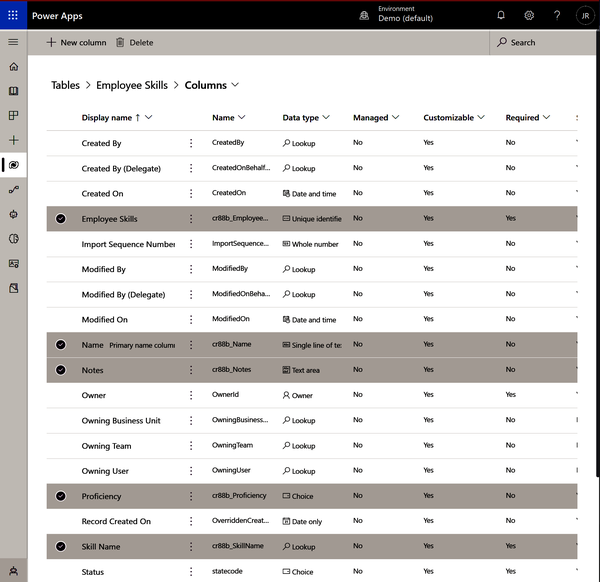
Figure 4-12. The Employee Skills table with new columns
Adding Data to the Tables
Our tables are set up now. We have a Skill table that simply requires a name, and we have an Employee Skills table that is going to capture each employee’s skills, proficiency, and notes. We also have a relationship between the two tables, by way of the Skill Name column that we created a lookup for. Let’s go ahead and create a few values in the tables, and later we’ll look at how to add data via forms.
We’re going to begin with the Skill table. Once you’re in the table, you’ll notice the columns and data section at the bottom of the page (Figure 4-13). Here, you can directly enter data, add columns, and show or hide existing columns, but you won’t be able to delete rows from here. To the right, you’ll see an Edit button. Click the Edit button to go to a page that will display the same table with additional capabilities like the ability to delete rows.
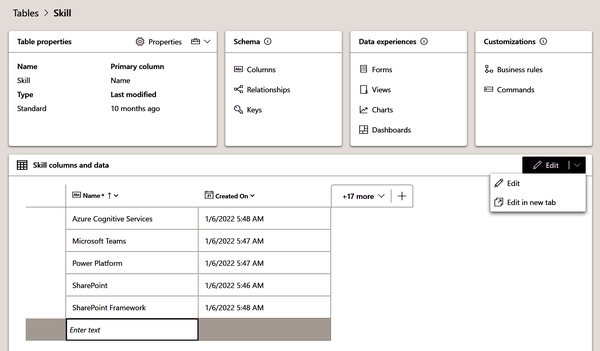
Figure 4-13. The Skill table
When the edit page opens, you’ll be able to enter new values (Figure 4-14). Simply click inside an empty cell in the Name column. Your entries will automatically save as you go. There’s a “New row” button, which you can use to continue adding skills, but you’ll also notice that as you enter values at the end, an additional empty row will appear just after so that you can continue to easily add records. Go ahead and add a few.
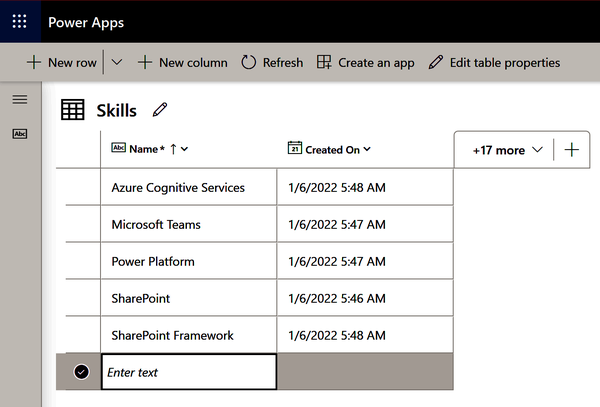
Figure 4-14. Adding a new skill
When you go back to the Skill table’s main page, you’ll see your new records in the columns and data section (Figure 4-15).
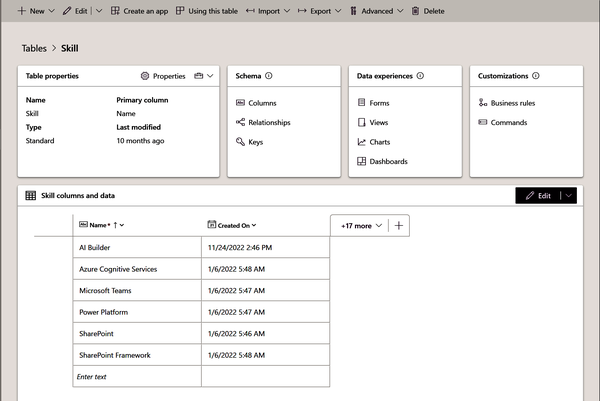
Figure 4-15. The Skill table with data
Similarly, we can enter rows in the Employee Skills table, and if we show the Skill Name column, we’ll see a drop-down showing our available options based on the entries from the Skills table (Figure 4-16). These entries that we’ve been making are being applied directly to the table, but in the next section, we’ll take a closer look at creating forms that can be used in Model-Driven Apps as a way for the business to update the records in our tables.
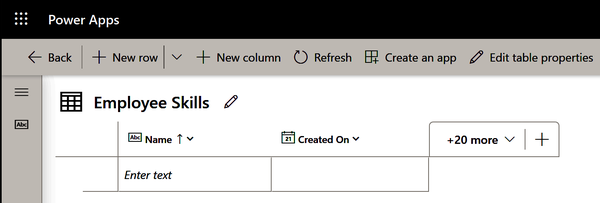
Figure 4-16. The Employee Skills table
Editing Forms for Tables
In the previous section, we saw how we could add data to tables. In this section, we’ll expand on that by looking at forms and how we can modify them with the columns that we want users to enter. From the Employee Skills table’s main page, go to the “Data experiences” section and click on Forms to get to the forms page, as seen in Figure 4-17. Here, you’ll see a few forms that are created for us. Click on the word “Information” in the row that shows the Main form type, and that will take you to the form editor.
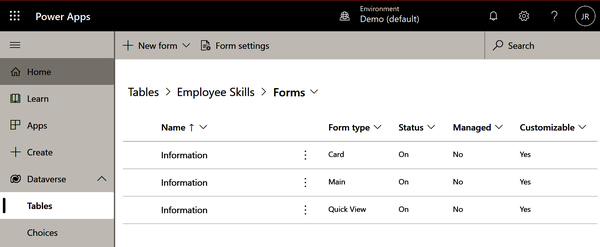
Figure 4-17. Employee Skills Forms
The screen shown in Figure 4-18 should look very familiar. We’re back in Power Apps and editing a canvas, but with a much more streamlined user interface. In the tree view panel, you can see that we have a header, which is the first two lines of text in our canvas. Next, you’ll see a tab control that is named General, which we need to provide a name for (as seen on the righthand side, where the Name field is showing as required). I’m going to name mine EmployeeSkillsMain. Moving back to the left pane, we see fields that will be shown in the form: Name, Skill Name, and Owner. If we want to add more, we need to click the “Form field” button at the top of the page.
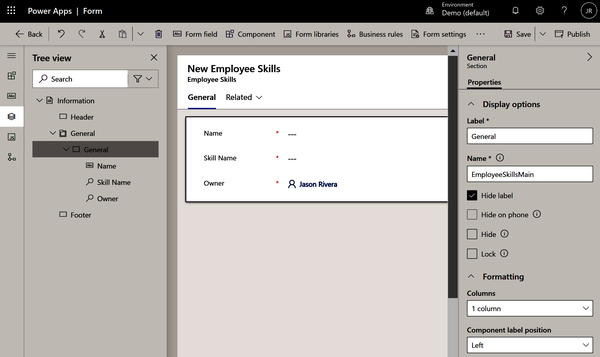
Figure 4-18. Editing a form
After we click this button, a list of possible table columns will appear to the left (Figure 4-19).
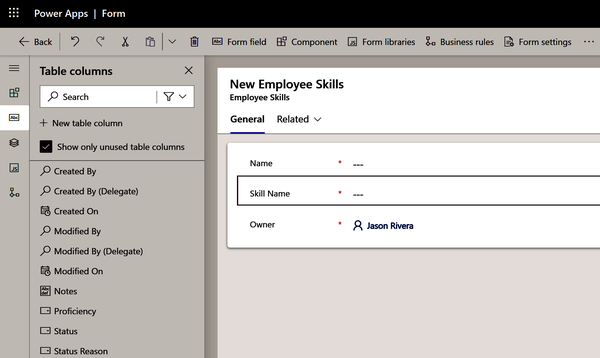
Figure 4-19. Form fields
Click on the fields that you want to add to the form, and they will start to appear. I selected the fields that we created, which were Skill Name, Proficiency, and Notes (Figure 4-20). Once added, be sure to save your changes and publish them to make them visible, using the buttons at the top right. Remember, when you create a table, it starts you off with one column, and ours was called Name. That column is obviously not our lookup column.
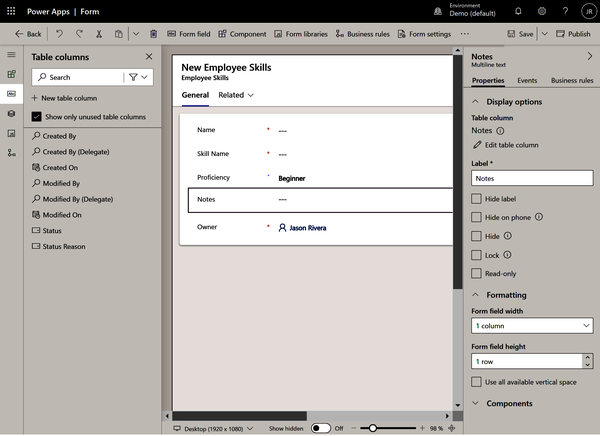
Figure 4-20. New form fields added
When the Employee Skills form is added to an app, it will look like the form seen in Figure 4-21. We’ll see our Skill Name column, which is a lookup to the Skill table, so we’ll have a drop-down of possible values. Below that is the Proficiency field, which will also have a drop-down but displaying values that belong to the field itself. We also have our Notes field, which simply accepts text. Notice that the table’s Name column is required, so we have to enter a value here. Skill Name is also required, so you’ll see the red asterisk next to it. Proficiency is recommended, so it has a plus sign instead.
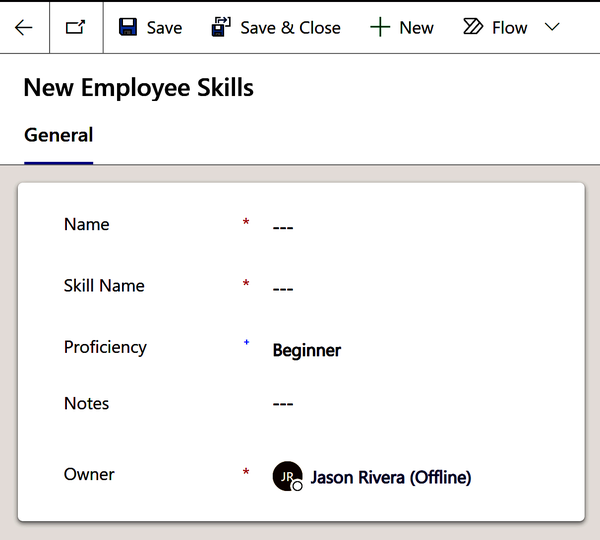
Figure 4-21. New Employee Skills with our desired columns
If we expand the Skill Name drop-down, we can see that our predefined set of skills are all there to choose from (Figure 4-22). This is a great way to control the list so that your data is consistent and centralized.
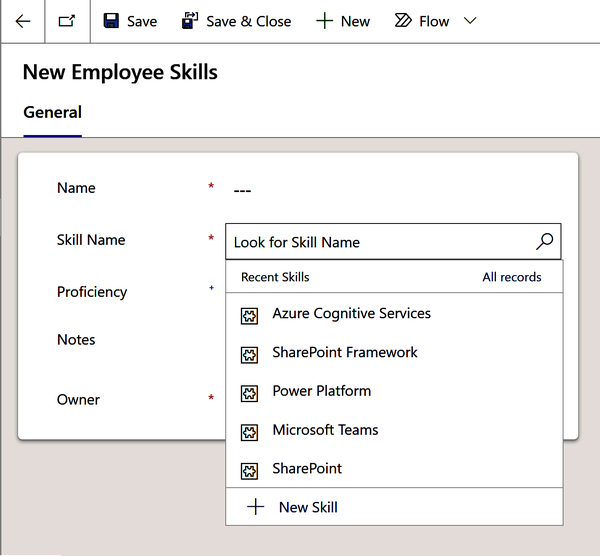
Figure 4-22. The Skill lookup drop-down
We’ve covered quite a bit of information in this chapter, and we could go into much more detail. So far, we’ve only talked about how to set up databases, tables, columns, and forms. In the next section, we’ll make some minor tweaks to what we’ve built so far and walk through creating a model-driven app, which, as you learned in Chapter 3, is one of the three types of apps that you can build using Power Apps. Our model-driven app will give us a way to interact with the tables that we’ve created so far.
Dataverse and Model-Driven Apps
In the previous chapter, we walked through the process of creating a canvas app based on an Excel spreadsheet. The canvas app allowed us to create any number of screens and drag-and-drop text boxes, drop-downs, buttons, labels, etc., anywhere on the page. We have quite a bit of control over how a canvas app is laid out. Model-driven apps take a different approach. They focus on the data first and depend on Dataverse, whereas canvas apps work with a variety of data sources including Dataverse. With model-driven apps, you focus on the tables, the forms, and the views, and those will drive your user experience. Because you won’t be focusing on creating screens, input controls, buttons, navigation controls, and more, your app’s interface can be created faster than with a canvas app. Model-driven apps limit how much control you have over the look and feel, but this allows you to be hyperfocused on what’s most important: the data.
Before we dive into creating a model-driven app, we should go back and do a few cleanup tasks to make our upcoming app look better. Those tasks include:
- Removing/hiding the unnecessary Name column from the Employee Skills table
- Creating a view that filters the Employee Skills table for records where the Status is Active and the Owner is the current user
Let’s begin by removing the unnecessary column. If we go back to our Employee Skills table and, on the Columns tab, click on the Name column that was originally created for us, we can start to make some changes (Figure 4-23). Find the drop-down titled Required, and change its value from Business Required to Optional. We’re not going to be using this field for anything, so this will ensure that we don’t need to enter a value into the field. Since this field was created as a primary column, it can’t be deleted. Click Save after you’ve made this change.
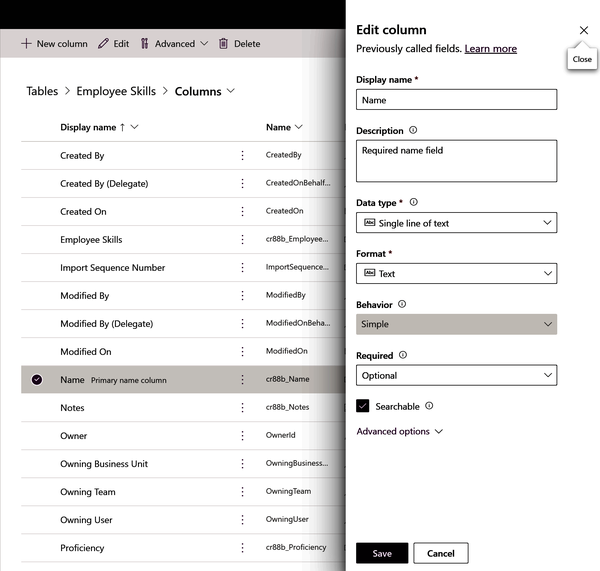
Figure 4-23. Setting the Name column to optional
Now that it’s not required and we don’t plan to use it, we’re going to want to remove it from the form. To do this, we’ll go back to the Forms tab and edit the Main form. Once we’re back in the form editor, we can click on the field that we no longer want to see in our tree view on the left. Then its properties will show up in the pane to the right (Figure 4-24). If we check the Hide option, in the Properties pane, that field will no longer be visible on the form when someone is entering or editing content.
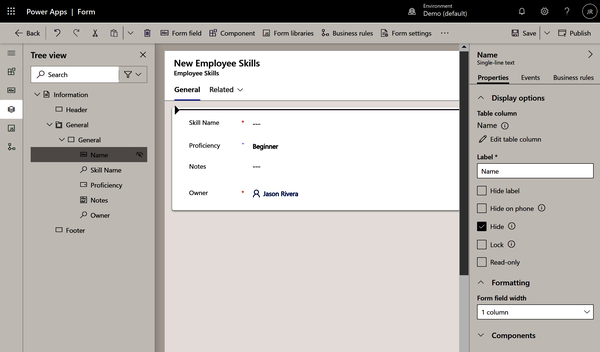
Figure 4-24. Hiding fields
Next, we want to create a view. We haven’t done this yet, but it’s very straightforward. Go to the Employee Skills table and under the “Data experiences” section, click on the Views link (Figure 4-25). Once on the Views page, click the “New view” button at the top of the page.
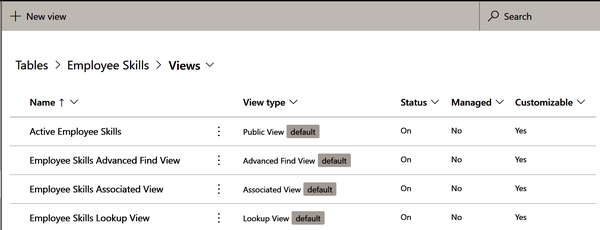
Figure 4-25. Employee Skills Views
We’ll then need to provide a name for our view. Call it My Active Skills and hit the Create button (Figure 4-26).
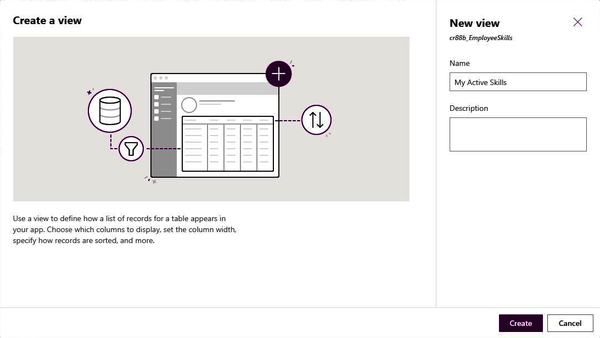
Figure 4-26. Creating a new view
The next page will be our View page (Figure 4-27), where we can define what we want to see and add any sorting and filtering. By default, the view will start with the Name field that we decided to make optional and hide.
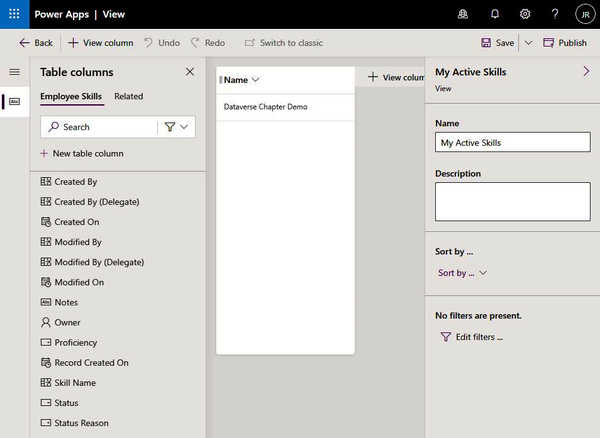
Figure 4-27. The view editor
If we click the “View column” button next to the table’s header, we’ll be given the option of adding columns from a pick list (Figure 4-28).
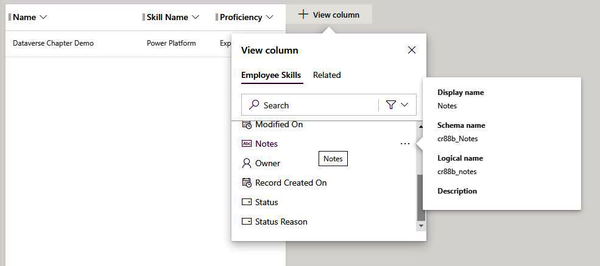
Figure 4-28. Adding columns to a view
To remove a column, click on the down arrow next to the column header and select Remove (Figure 4-29).
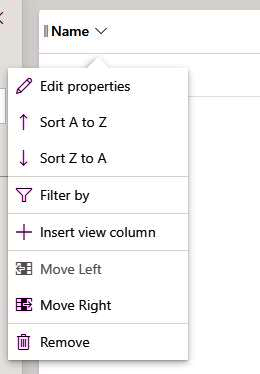
Figure 4-29. Removing a column
Once all of the desired columns have been added and removed, we can apply our filter. In the pane on the right, you’ll see an “Edit filters” link (Figure 4-30). Click on that, and you’ll be able to apply filters to limit the records that are shown.
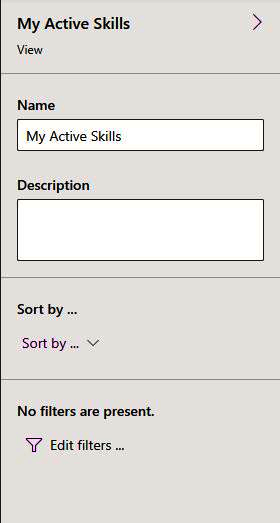
Figure 4-30. View filtering
Next, we’ll want to add a new row for each filter that we’re going to apply. In this case, we’re going to apply two filters (Figure 4-31). The first will be a filter on the Status to show only items that are Active. We don’t currently have a mechanism to set an employee’s skill to Inactive because we haven’t exposed that field in our form, but if we decide to make it so that the app allows people to remove skills from their list rather than deleting them, they can set them to Inactive and they won’t see them in their list. The other filter is on the Owner field: we simply want to select “Equals current user” so that we’re not seeing other people’s skills in our own views. Once that’s complete, hit the OK button.
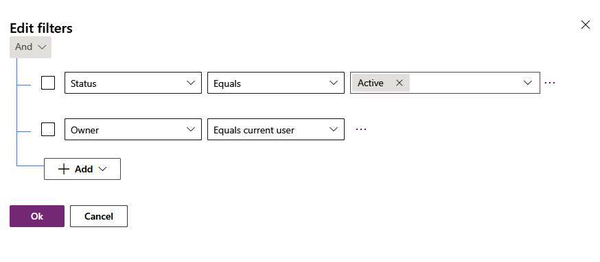
Figure 4-31. Editing filters
Finally, be sure to save and publish your view. We’ve now completed a few minor cleanup tasks, and it’s time to start creating our model-driven app.
Let’s Build a Model-Driven App!
In this section we’re going to build a model-driven app, which uses our data to build a collection of views, forms, and pages for us. In Power Apps, click on the Create button on the left menu, followed by the Blank App button on the next page. Next, click the Create button under “Blank app based on Dataverse” (Figure 4-32).
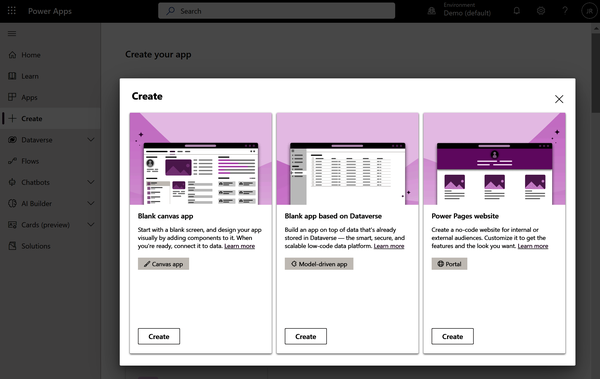
Figure 4-32. Creating a model-driven app
Next, we’ll need to provide a name and an optional description, and again click the Create button (Figure 4-33).
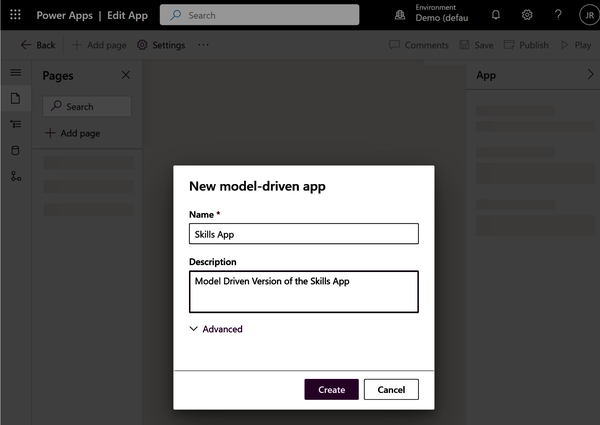
Figure 4-33. Provide a name and description for the app
When the editor opens, we’ll have a blank page to work with. Here is where we will begin to incorporate the tables that we’ve been working on. Click the page icon and then click “Add page” (Figure 4-34).
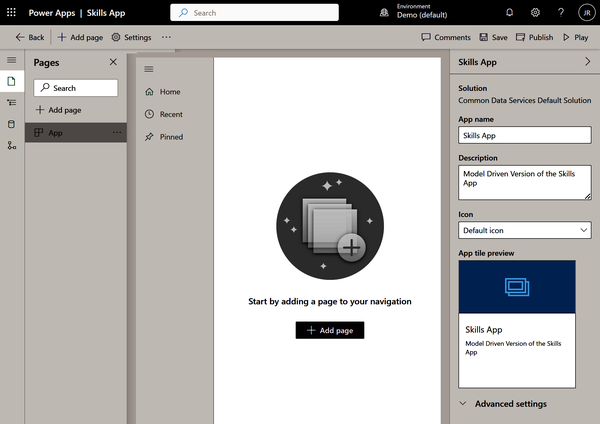
Figure 4-34. The model-driven app editor
We want to create a new page based on views and forms associated with the tables we created earlier. You can also create dashboards to display charts and custom pages, which are canvases that you can introduce into your app. Select “Table based view and form,” then click the Next button (Figure 4-35).
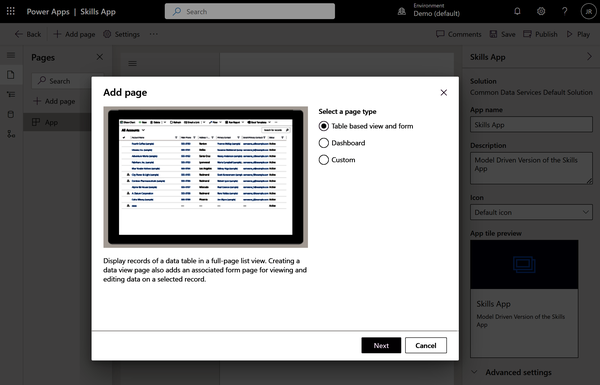
Figure 4-35. Select the page type
The next screen, shown in Figure 4-36, allows us to select the tables that we want to incorporate into our app. Search for and select the two tables that we’ve been working with, then click the Add button.
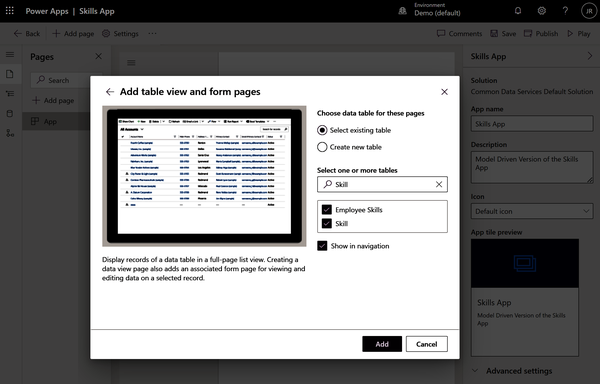
Figure 4-36. Select the tables
After a few moments, the app will render with any data stored in the tables. Figure 4-37 shows the data from the Employee Skills page. The My Active Skills view, which we created to filter the items that we own, is what we’re viewing. Clicking the arrow next to the My Active Skills header will allow us to choose from other views.
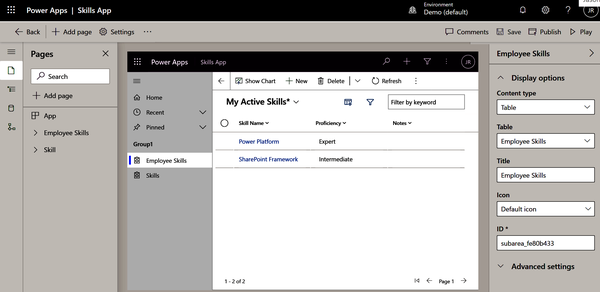
Figure 4-37. Model-driven app showing our skills tables
From here, the rest of the user experience is similar to what we experienced when we were creating and viewing items from the Dataverse forms, except that we’re rendering them from an app (Figure 4-38).
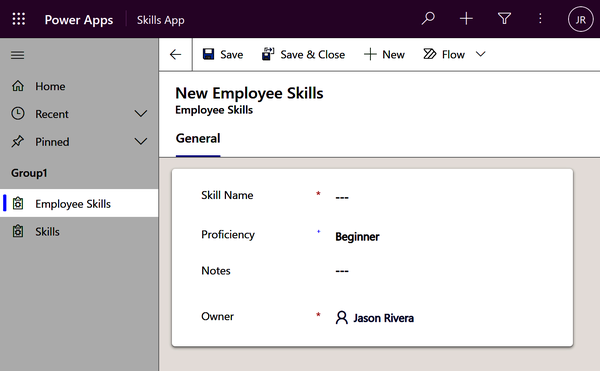
Figure 4-38. Adding a new employee skill
One final housekeeping task is to provide meaningful names whenever possible. As you’re building tables and controls, you typically have opportunities to name them. In Figure 4-38, we see that the app’s left navigation menu shows Employee Skills and Skills under the Group1 heading, which is not a meaningful heading for the app’s users. As shown in Figure 4-39, we can change this by clicking the navigation icon to the far left of the page. This will display the Navigation pane, where we can select our group header. This will open a pane on the right where we can see the title and provide a new name. In general, it is good practice for provide meaningful names to groups, tables, screens, and components. A good naming convention makes things easier for app users and will be helpful if you have to revisit the app in the future.
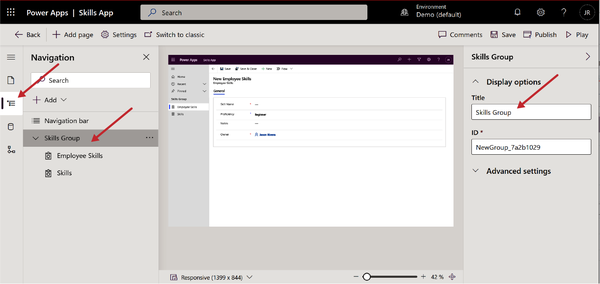
Figure 4-39. Changing a group’s name
One more subtle thing we can do is to change the icons for our pages. This is a simple way to provide a visual indicator that helps an app user navigate your app. In the Navigation page, we can click on a page much like we did with the group heading, and in the pane to the right we will now see an icon drop-down (Figure 4-40) where we can switch from the default icon to a web resource by selecting “Use web resource.”
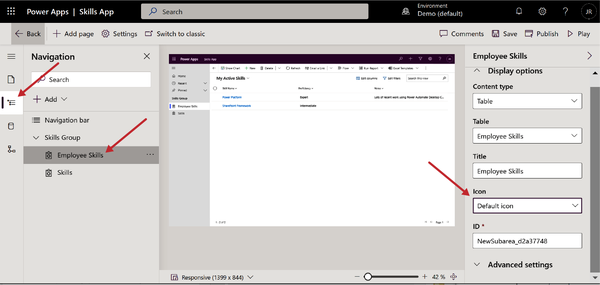
Figure 4-40. Changing a Page icon
After we make this selection in the Icon drop-down, a “Select icon” button will appear. Clicking this will display a list of icons that we can choose from (Figure 4-41). Select the User Icon, then click the Select button (you may need to scroll down to see this).
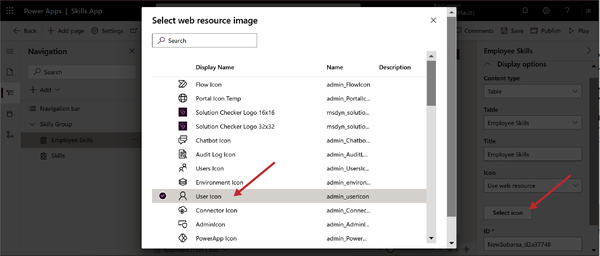
Figure 4-41. Selecting an icon for our page
Figure 4-42 shows the final result, with the User Icon next to the Employee Skills page in the Navigation pane. You can also see this from the app user’s perspective, next to the Employee Skills link within the Power App.
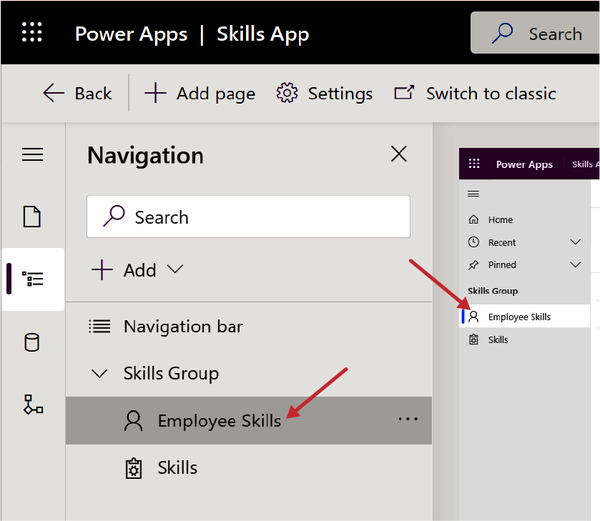
Figure 4-42. New icon presented next to our page
Conclusion
In this chapter, we dove right into Microsoft Dataverse by creating a couple of database tables linked together via a lookup column. We were working with a small and simple solution, but you can probably already see how powerful model-driven apps can be when you are creating a system that stores data in multiple tables with different forms, views, and relationships.
After creating our tables, we walked through the process of editing their forms, changing their views, and populating data. We then took those concepts and turned them into an app. When you’re working with larger systems like a customer relationship management system, you can see how having a tool like this can help you rapidly create new solutions that tie together information about sales, accounts, projects, and more.
In the next chapter, we’re going to switch gears a little bit and move away from apps to start talking about process automation via Power Automate. We’ll take a look at how this works, what can trigger a flow to run, approvals, and more.
Get Building Solutions with the Microsoft Power Platform now with the O’Reilly learning platform.
O’Reilly members experience books, live events, courses curated by job role, and more from O’Reilly and nearly 200 top publishers.

