Chapter 9. Tooltips
Tooltips are the information that appears when you hover over a mark on a visualization; they are automatically available on each chart you build. Primarily, they help provide the information in the chart in a text format. Tooltips can also be used to provide additional information that isn’t included in the chart.
This is what the default tooltip looks like:

9.1 Basic Tooltips
Basic tooltips can be left unchanged and not formatted, but sometimes you can end up with extra fields that you might not need in a tooltip. You can edit a basic tooltip in a variety of ways, from stating the facts to forming sentences—this depends on the use case.
Problem
You want to edit and format the default tooltip as well as add information.
Solution
-
Start with a horizontal bar chart showing Sub-Category by Sales, sorted in descending order (see Recipe 3.1).
-

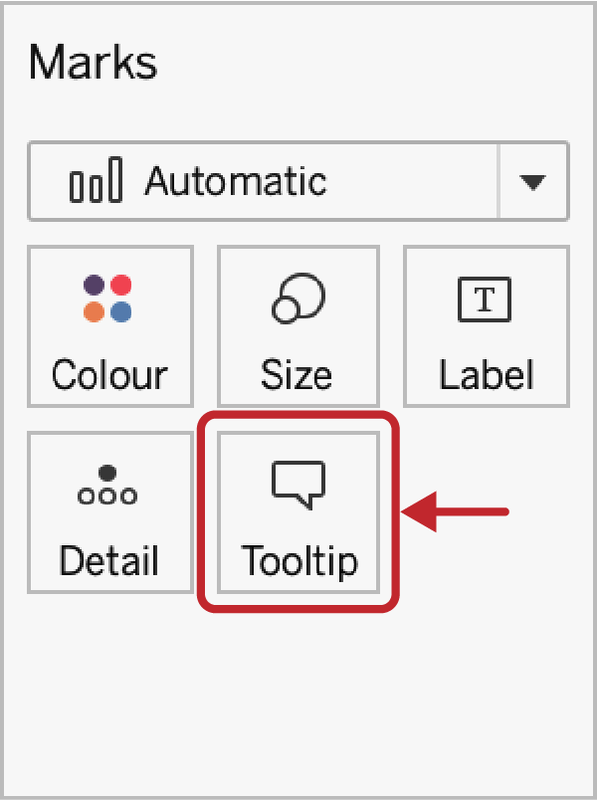
On the Marks card, click the Tooltip property:
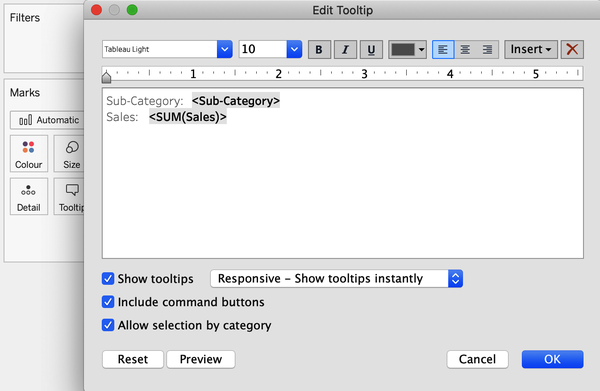
An automatic pop-up box pens that will look like this:

Tip
The gray shaded text is dynamic per individual mark you hover over, whereas the unshaded text is static and will appear the same on every mark.
-
At the top of this box, you have options to edit the font, size, and ...
Get Tableau Desktop Cookbook now with the O’Reilly learning platform.
O’Reilly members experience books, live events, courses curated by job role, and more from O’Reilly and nearly 200 top publishers.

