Chapter 3. Bar Charts
A bar chart is one of the most commonly used chart types. It allows the human eye to compare differences between length or height, which is one of the preattentive attributes. A bar chart is split by categorical data and shows a continuous measure. There are two types of basic bar charts: horizontal and vertical. Bar charts have other variations, including stacked bar charts, diverging bar charts, and histograms.
3.1 Horizontal Bar Chart
Problem
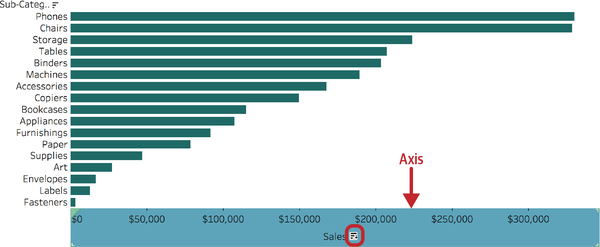
You need to create a horizontal bar chart that shows, from highest to lowest, the continuous measure of Sum of Sales broken down by the categorical dimension of Sub-Category.
Solution
You have three options for this solution. Here is option 1:
-
Create a new sheet.
-

Using the Superstore sales data, double-click Sub-Category:
-
Drag the Sales measure to the Columns shelf:

-
Hover over the axis to display a sorting bar icon. Click the sorting icon to create a descending bar chart:

Here is option 2:
-
Create a new sheet.
-
Double-click Sales (1).
-
Double-click Sub-Category (2). This creates a vertical bar chart:
-
To convert this to a horizontal bar chart, click the “Swap Rows and Columns” button (1) in the toolbar. ...
Get Tableau Desktop Cookbook now with the O’Reilly learning platform.
O’Reilly members experience books, live events, courses curated by job role, and more from O’Reilly and nearly 200 top publishers.

