Chapter 1. Introduction to Data
Before you start to use Tableau, you will need data. Data comes in many different shapes and sizes, from Microsoft Excel files to databases. Data is all around us, and more and more companies need the ability to see and understand their data, which is Tableau’s focus. Tableau Desktop has a variety of data connection options, from files to databases to saved data connections. This chapter will explore how to connect and use different data sets within your Tableau workbook.
1.1 Connecting to Data
When you first open Tableau, you will see the Start Page. The Start Page consists of three panes: Connect, Open (and recently connected workbooks), and Discover.
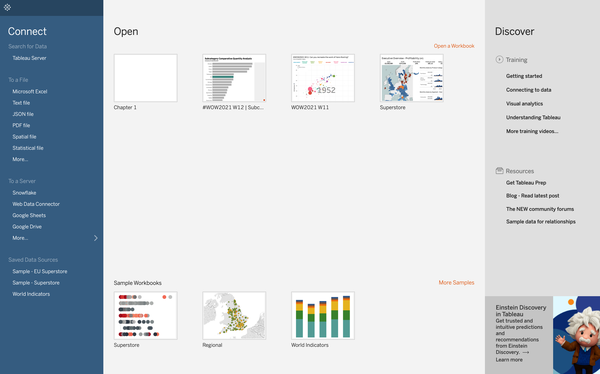
Within the Connect pane, you can see four sections: Search for Data, To a File, To a Server, and Saved Data Sources.
1.2 Searching for Data
The Search for Data option allows you to connect to a data source that has been published onto your Tableau Server or Tableau Online platform.
Solution
-
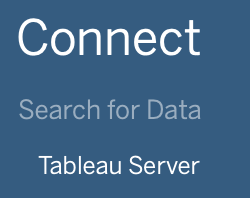
On the Start Page, click Tableau Server:
-
This will ask you to log in to your Tableau Server instance. (For more information, refer to your Tableau Server Administrator.)
-
Once you have connected to your Tableau Server instance, you will see this pop-up box that lists all the data sources available on your server. You can select one and click Connect:

-
This will connect to that data source and take you to the Tableau Workspace:

Discussion
Your company might have a set of trusted data sources that you should be using to do your analysis, which is why you would want to connect to the Tableau Server data source. I could write a whole book on how to set up your Tableau Server data sources, but this book is focused on Tableau Desktop. If you want to prepare your data sources using Tableau Prep, Carl Allchin’s Tableau Prep (O’Reilly) will get you started.
If you want to know more about Tableau Server, ask your IT department or your Tableau Server Administrator.
1.3 Connecting to a File
Connecting to a file is probably the most common way that people connect to data, especially when they are first starting to use and understand Tableau.
Solution
-
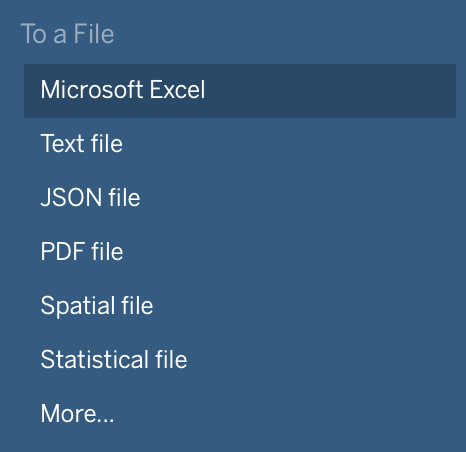
On the Start Page, under the To a File section, click Microsoft Excel:
-
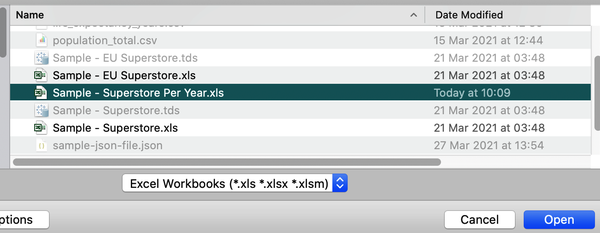
This will bring up the File Explorer on Microsoft Windows (Finder on Mac) to allow you to search for the Excel file:
-
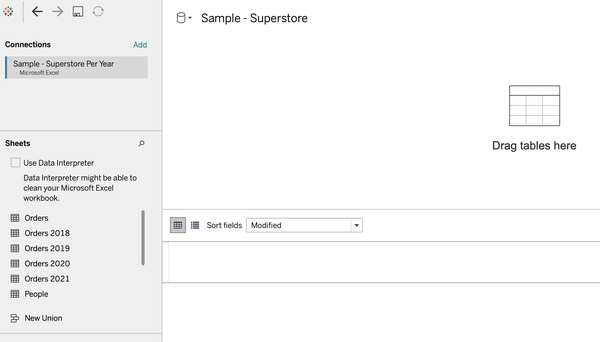
Once you have clicked Open, Tableau will take you to the next page, the data source page:
-
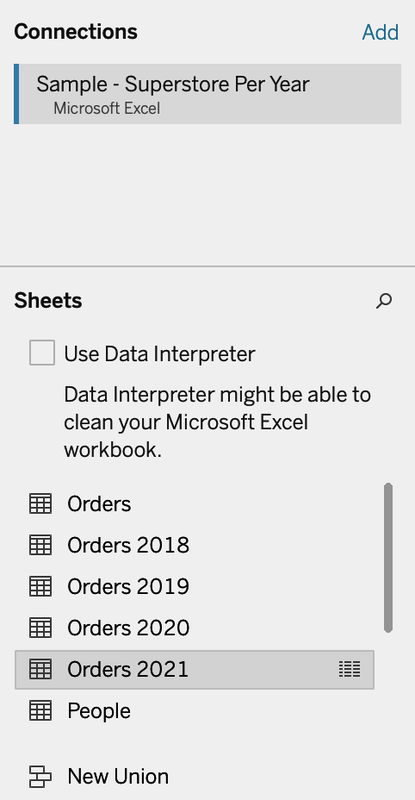
This Excel file has several sheets, which are different tabs in the file. We want to use the Orders 2021 sheet:
-
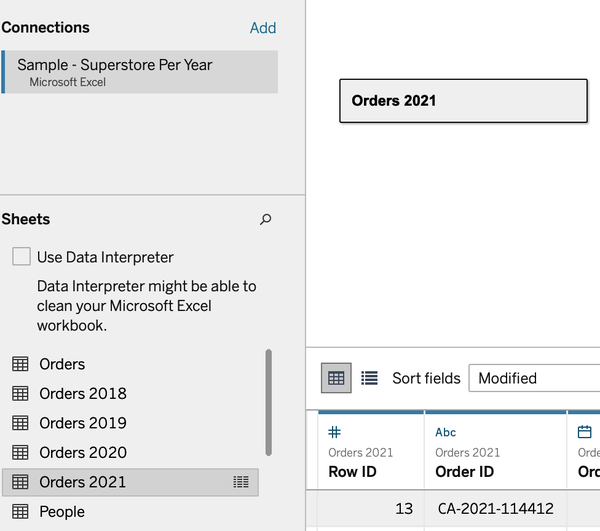
Double-click the Orders 2021 sheet to automatically add it to the canvas within the data source page:
You are now ready to start your analysis on 2021 orders:
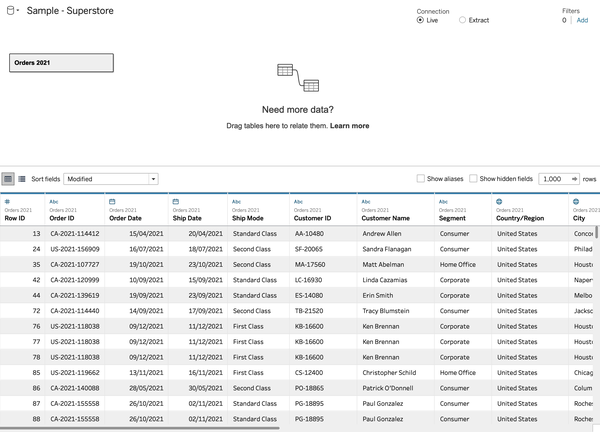
Discussion
Connecting to a file is the easiest way to get started with Tableau Desktop because it still gives you several different file types. We connected to a Microsoft Excel file, but you can also connect to other files: Text, JSON, PDF, Spatial, Statistical, and More. When you select a specific type, the search box that pops up will allow you to click only that specific type of file; therefore, if you are unsure of the file (for example, whether it’s a CSV or Excel), use the More option instead. Also, Tableau has its own file type called Hyper files, and you can connect to these through the More option as well.
We double-click a sheet to add it to the view. You can also drag and drop to the canvas section in the middle:
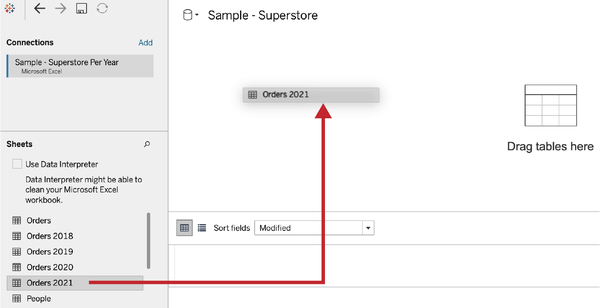
When you’ve brought your data onto the canvas, you will see the data grid at the bottom. This allows you to preview a sample of the data before you start your analysis:
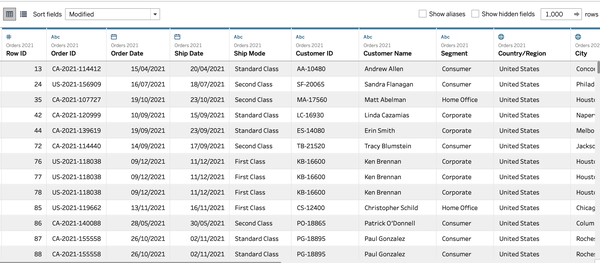
When connecting to the different file types, there might be slightly different settings.
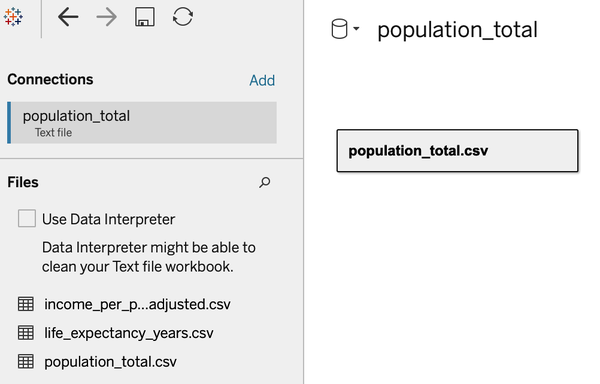
A CSV (comma-separated values) connection will automatically bring the CSV onto the data source canvas once you click Open, and the left pane will show all the CSV files in the same location as the one you have opened:
When connecting to a JSON file, Tableau will ask you to select the schema you want to bring into the view, which allows you to bring in certain levels of detail from your JSON files:

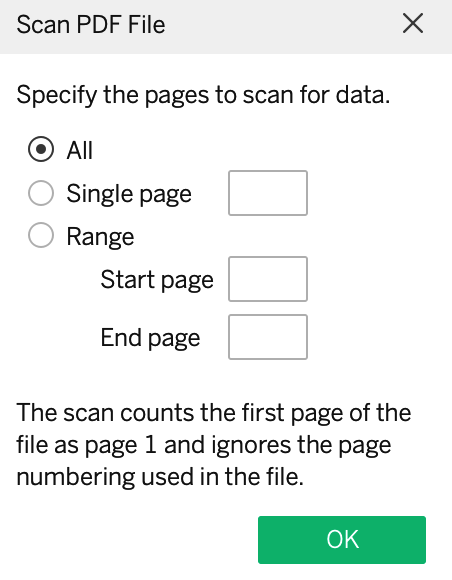
When connecting to a PDF file, Tableau will ask you which pages you would like to look at. The PDF input will look for tables within the structure of the PDF:
If you need to connect to a spatial file or a statistical file, once you have connected, Tableau will automatically bring in the file to the data canvas (like when connecting to a CSV), unless there are multiple tabs/sheets, in which case you will have to add the sheet to the canvas manually.
1.4 Messy Data Sources
When you are new to working with data, you will appreciate a clean and tidy data source, but sometimes you might be given a messy data source or one that needs cleaning. This could range from simple data preparation to something more complex.
Problem
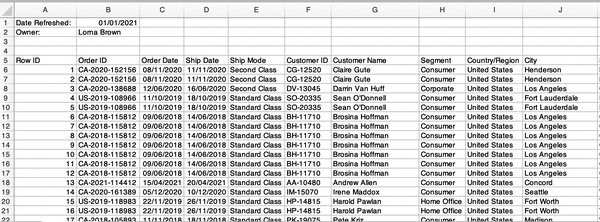
You want to connect to a formatted Excel spreadsheet that is nicely styled for Excel use, where the actual headers do not start in the first row:
Solution
-
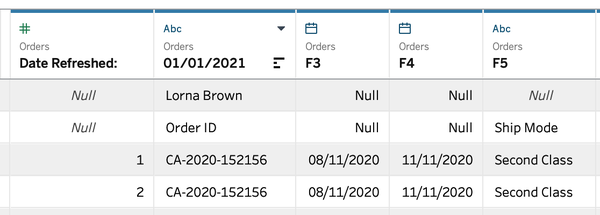
Connect to the Excel spreadsheet, and when you add the Orders sheet to the canvas, you will notice that in the data grid the data hasn’t been brought in correctly:
-
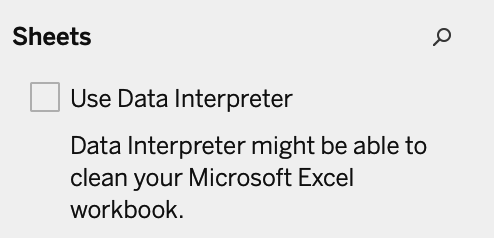
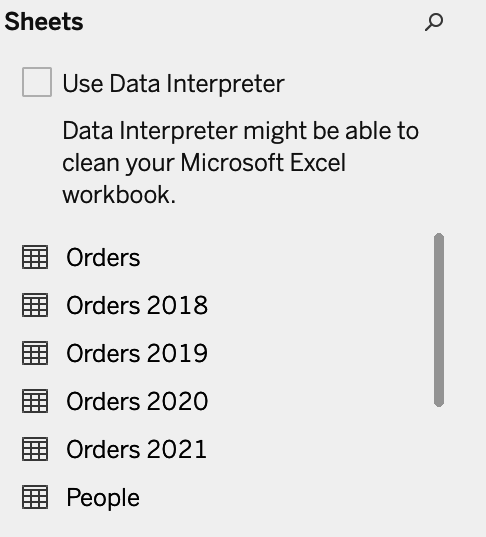
To rectify this, in the left pane under Sheets, find the Use Data Interpreter checkbox:
-
Check this box to have the Data Interpreter look at your file and try to understand what data you actually want to use. Tableau then removes the unnecessary rows that don’t match the other rows:
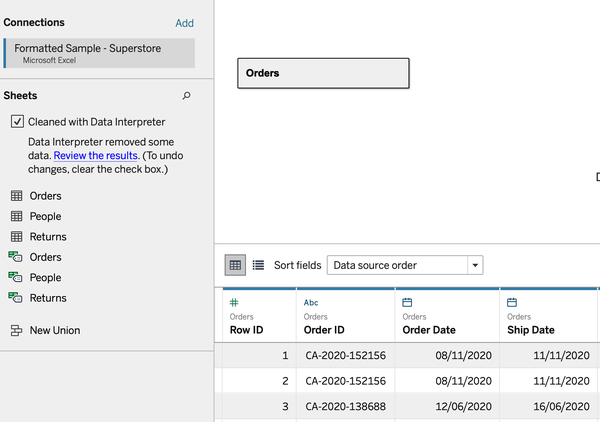
Discussion
When you are using the Data Interpreter, Tableau also gives you the option to review the results:

When you select “Review the results,” Tableau will automatically open an Excel spreadsheet to show you the changes made:
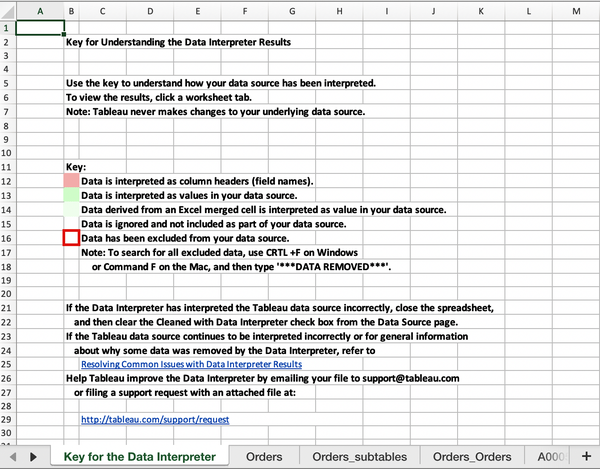
Using the Data Interpreter will not change your raw underlying data; it will change only the data that is being viewed and used in Tableau.
1.5 Connecting to a Server
Connecting to a server is different from searching for data through Tableau Server. This type of connection allows Tableau to connect to databases or cloud-based data, like Google Sheets.
Problem
You want to connect to a Google Sheet.
Solution
-
In the Connect pane, under To a Server, select More, and then select Google Sheets:
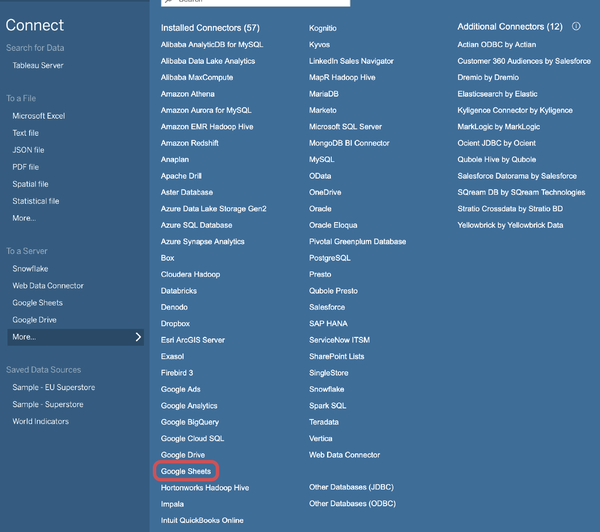
-
Tableau will open a browser window and ask you to log in to your Google account; log in.
-

Google will ask you to give authorization to allow Tableau to see and download all of your Google Drive files:
-
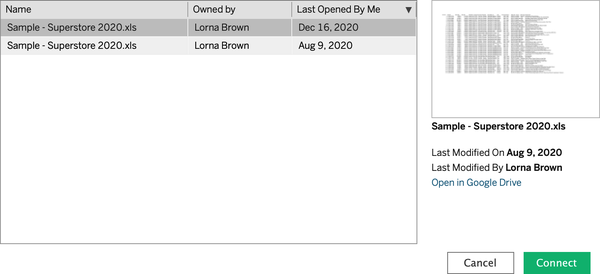
Once you have trusted Tableau, you are able to see the Google Sheets associated with your account. You can use any data source and click Connect:
Discussion
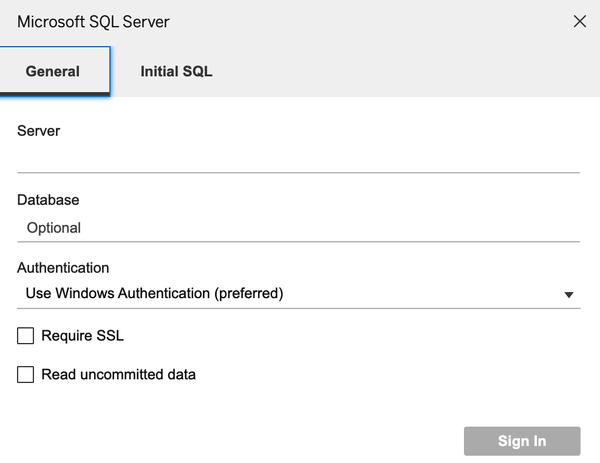
To a Server allows you to connect to different database types and cloud-based data. If you want to connect to a specific server, you will need to provide connection details to the Server IP or connection string and a username and password:
If you are connecting to a database for the first time, you might need to download the associated driver. If you do need to install a driver, Tableau will tell you where to go to get the driver.
1.6 Saved Data Sources
The final section on the Connect pane on the Start Page is for connecting to Saved Data Sources.
Problem
You want to connect to a saved data source, and you want to add a new saved data source for instant reusable access.
Solution
-
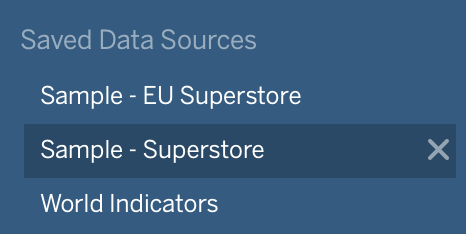
In the Connect pane, select one of the Saved Data Sources. This will take you straight to a new worksheet ready to start your analysis.
-
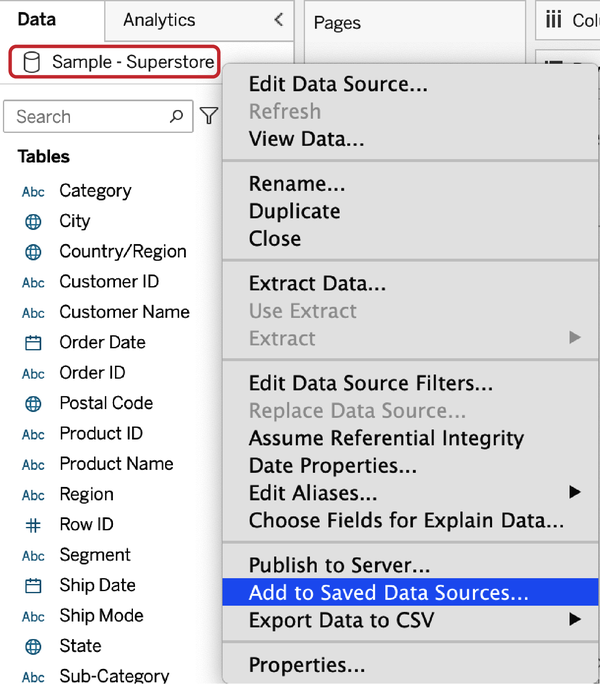
To add a data source to your Saved Data Sources, right-click Data at the top left of the Tableau interface and choose “Add to Saved Data Sources” (see Chapter 2 for more information).
-
Tableau will then ask you to save this file into your Tableau Repository as a .tds file, which is a Tableau Data Source file. Save this connection, and the file will appear under the Saved Data Sources section on the Connect pane.
1.7 Connecting to Secondary Data Sets: The Data Model
A data model is like a diagram telling Tableau how to query your data. The data model consists of two layers: the logical layer and the physical layer. When you first connect to any data within Tableau, you start in the logical layer. If you want to add additional data, you will have to decide between the logical or physical layer.
The logical layer uses Tableau’s data model to create relationships between two or more data tables based on one or more fields in each data table. Relationships are dynamic and flexible, as they query the data only when fields are being used from that table. Relationships also allow your data to be at different levels of detail, using many-to-many situations.
In the physical layer, you can create joins and/or unions with data. The physical layer is not dynamic and flexible like the logical layer and is best suited for data that is at the same level of detail, therefore creating a one-to-one join type. If you use the physical layer for data at different levels of detail, you could cause duplication in your data. See “Joining Your Data: The Physical Layer” for more information about joining data.
Relating Your Data: Logical Layer
As mentioned, when you first connect to data, you are automatically in the logical layer. Deciding which layer you need will depend on the type of data you are using. Logical layers are especially useful when your data has varying levels of detail. For example, in Superstore Sales, the Orders table has one row per order per product, so the Customer ID/Name is repeated over several rows:

You may now want to add customer details data to find out more about your customers. This relationship will not be one-to-one because Customer ID appears more than once in the Orders data set. This is where we can use relationships.
Problem
You want to relate your orders data to your customer details data to allow analysis on the customer details.
Solution
-
We first need to add this additional data to our Data Source page. To do this, click Add (next to Connections) and select Microsoft Excel:
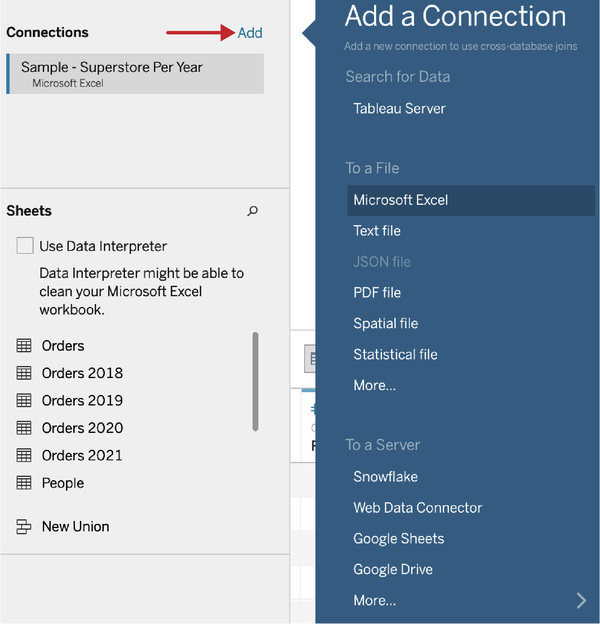
-
On selection of the file type, you will be asked to find your file:
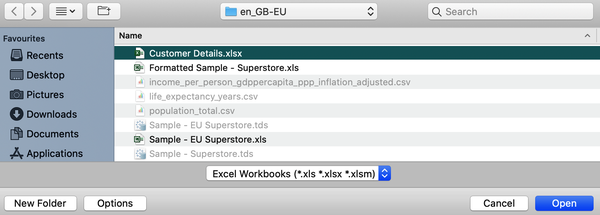
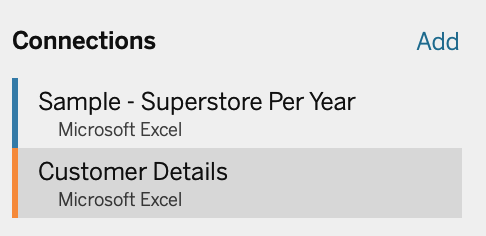
In the left pane, you will now have two data sources connected. Now we have both data sources, and we need to create the relationship.
-
To do this, drag and drop the Customer Details sheet onto the data source canvas, which creates an orange connection, known as a noodle:

Tableau now gives you a pop-up box to ask you how you want to relate your data:
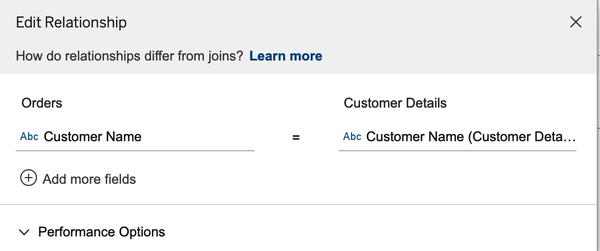
-
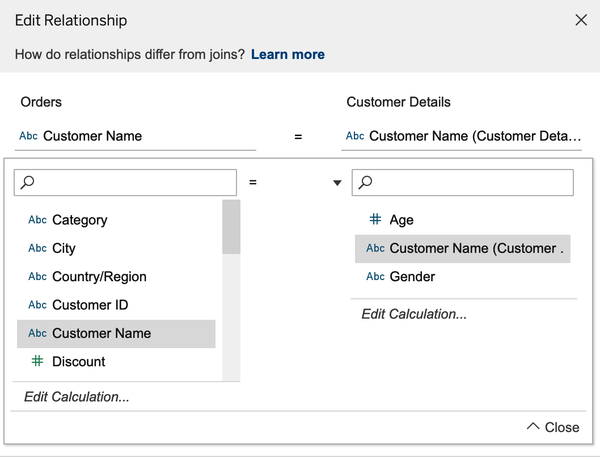
In this case, Tableau has automatically picked up the field that is common from both data sets. But if this option is empty because the field names are named differently, you can tell Tableau which fields you want to relate your data to:
-
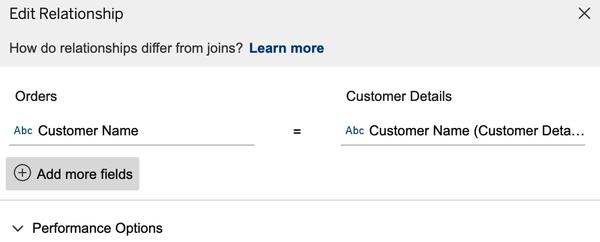
Finally, if you have more than one field you want to relate to, you can select the “Add more fields” option to define the second relationship:
Discussion
A relationship allows you to relate your data at different levels of detail and is the default way to connect multiple tables. For example, you have data at an individual orders level, but you have sales target data on a monthly basis. With relationships, you can create a relationship calculation.
Creating Relationship Calculations
Solution
-
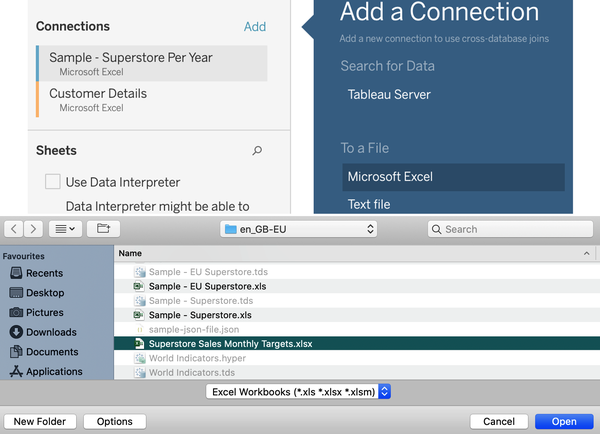
Add a new data connection to the Monthly Targets data:
-
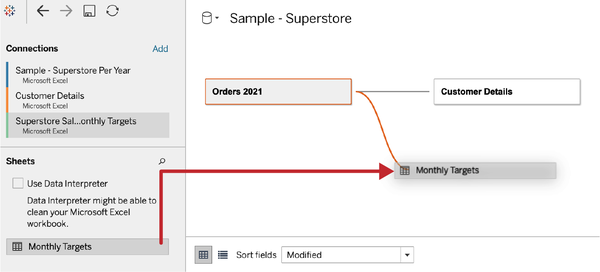
Drag the Monthly Targets data to the data source canvas:
-
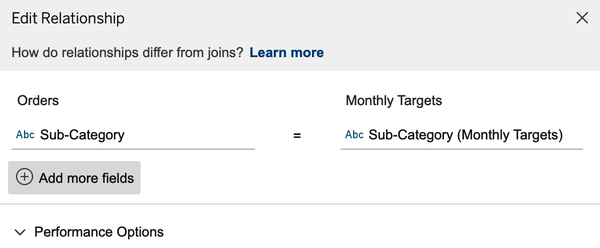
This will pop up for you to define the relationship between the data sets. Tableau has automatically found that Sub-Category is a common field. But to add a relationship calculation, select “Add more fields”:
-
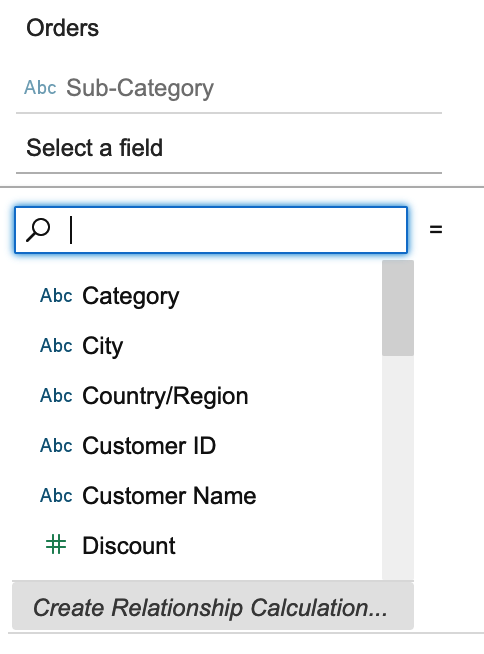
This will populate the drop-down of the current fields in the data. At the bottom, select Create Relationship Calculation.
-
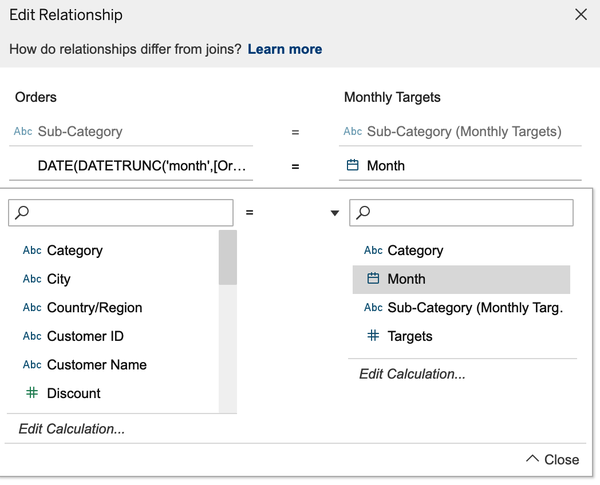
Once you have selected the Create Relationship calculation, you should use this calculation, which uses Tableau’s DATETRUNC function to aggregate the Order Date to the specific level. This could be year, quarter, month, or week/day (for more information about dates, see Chapter 5).

-
Now you can select the Month field from the Monthly Targets data:
Discussion
The reason you want to create a relationship calculation could be that your original data doesn’t contain the correct field that you need to relate to. If you don’t have this option, you need to make sure you are in Tableau version 2020.3 or above.
Now that you have your targets data included, you’ll notice that the targets go back to 2018, but we have brought in only our 2021 data.
Unioning Your Data: The Physical Layer
Our Excel file has multiple tabs for each year of our data; this is a common Excel approach. The tabs all have the same structure of data, but they contain different years. We need the ability to stack the Excel tabs on top of each other to get the full date range in our data set. To do that, we need to use a technique called a union. A union stacks data on top of each other when the data has a common set of fields. This happens within the physical layer of the data model.
Problem
You want to bring several tabs of orders data within Excel together to create one large orders data set.
Solution
-
To get to the physical layer editor, right-click the Orders 2021 logical layer. and select Open, or double-click the primary table:

-
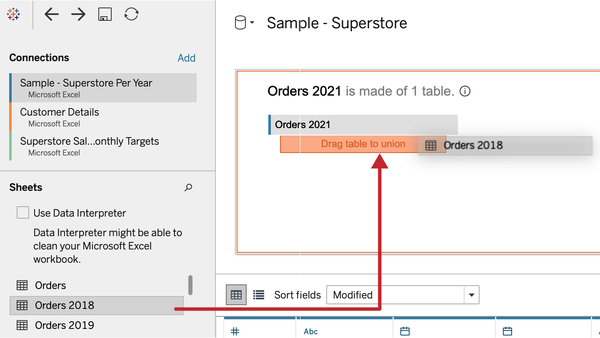
From here, you can drag and drop the specific sheets underneath the 2021 sheet, which will create a union. As the box suggests, drag the table to union the data:
-
Repeat for the sheets Orders 2019 and Orders 2020.
-
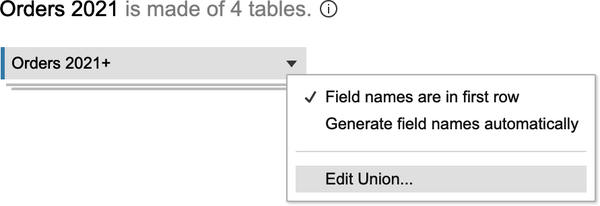
If you find you have added too many sheets, you can edit the union by right-clicking Orders 2021+ and selecting Edit Union:
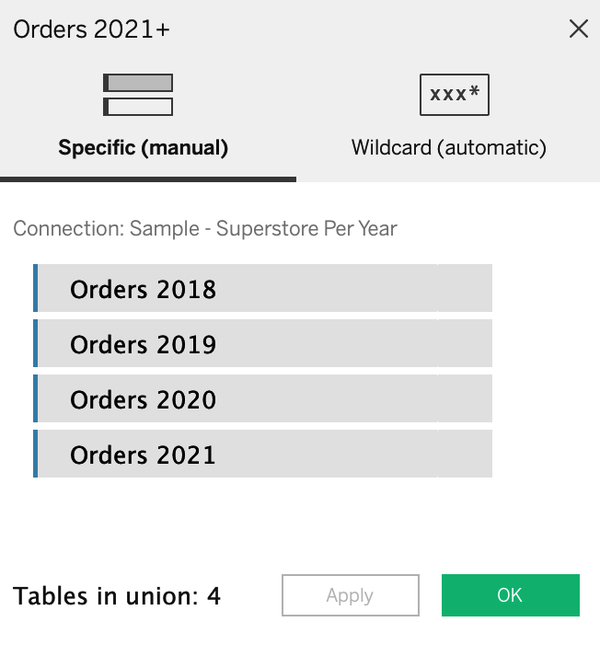
This shows you which sheets are now stacked on top of each other:
Discussion
A union is bringing similarly structured data together by stacking different files or tabs on top of each other.
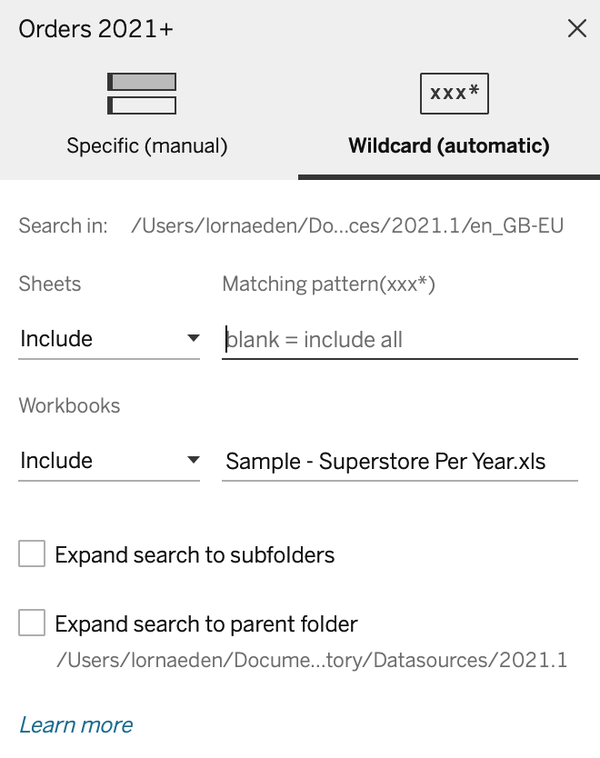
You can also create a wildcard union. A wildcard union follows a naming convention you suggest, and then it will bring those sheets together. When you go to edit a union, you will see an option at the top for “Wildcard (automatic)”:
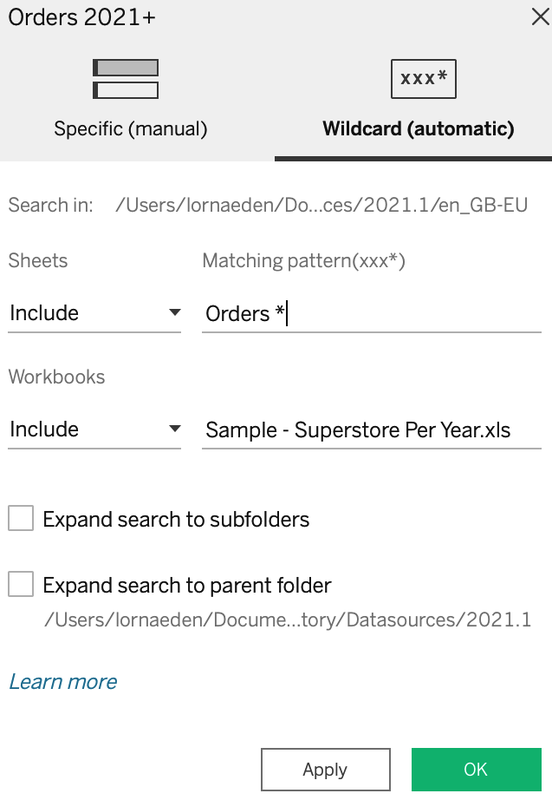
Within the settings, you can tell Tableau how you want to define the wildcard with a specific pattern. All of our sheets in this example start with “Orders” followed by the year:
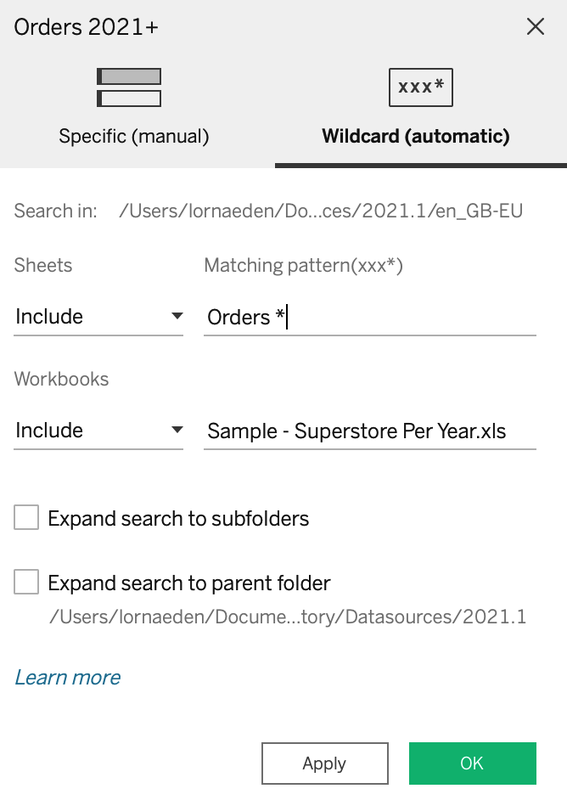
Therefore, in the matching pattern we can use “Orders *”. The asterisk is a symbol for any character.
This will then bring all the sheets together and is useful if you update the Excel file with a new year. Tableau will automatically bring that sheet as well, whereas you would have to manually add the new year’s sheet to the specific union.
There are two ways you can see you have created a union. First, the tab you dropped onto the canvas has changed to look stacked. Second, by scrolling to the farthest right columns in the data preview reveals two new fields called Sheet and Table Name, to show you which rows of data are from which table.
Once you are happy with your union, click the close icon to close the physical layer:

Finally, you can rename any physical or logical layer by right-clicking a block and selecting Rename:

Unioning is great when you have multiple data sources that have the same common fields. But what if you want to add additional fields to your data that you know won’t duplicate your data?
Joining Your Data: The Physical Layer
In addition to unioning, you can also join your data inside the physical layer. Joining data gives you the ability to add additional columns to your data set. With the data model, you might find that you don’t need to join your data, especially when you have data that isn’t a unique record, which is known as a many-to-many relationship. A join is still useful if you have a one-to-many or a one-to-one relationship.
Problem
You want to join your orders data, by region, to include the area manager for each region.
Solution
-
Open the Orders logical layer to get to the physical layer:

-
Double-click the People table; this will automatically create a join:
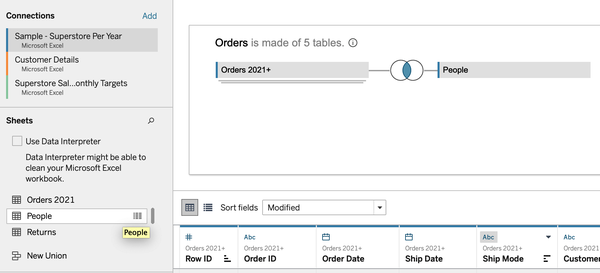
-
This has created a join based on a common field in both data sets. To find out which one, click the Venn diagram in the middle of the two tables:
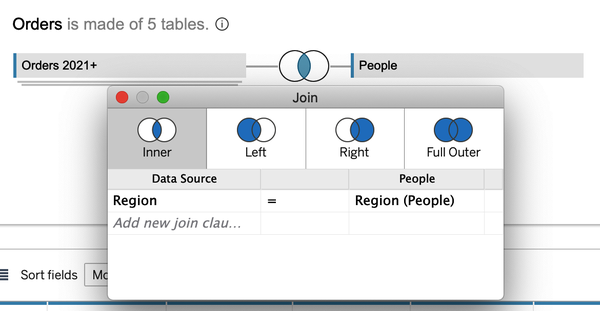
Warning
Using the default inner join type could result in mismatched rows being excluded. See the Discussion for more information about join types.
-
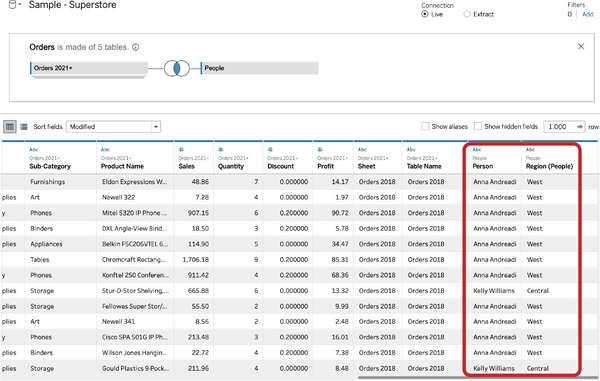
You can add new join clauses, depending on the level of detail of your data. To find these new columns, scroll to the right in the data grid:
Discussion
The Venn diagram denotes the join type that you are using. Tableau Desktop has four types: Inner, Left, Right, and Full Outer.
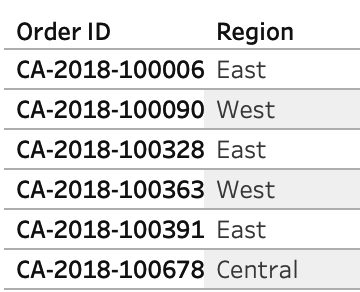
We have two tables. Our left table contains our Orders and Region:
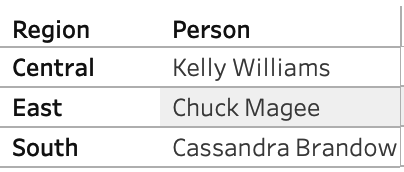
Our right table contains Region and Person:

Choose the Venn diagram that is shaded in the middle for an Inner join:
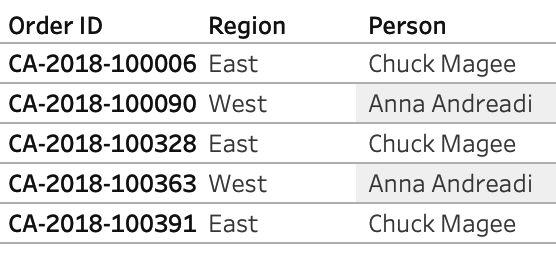
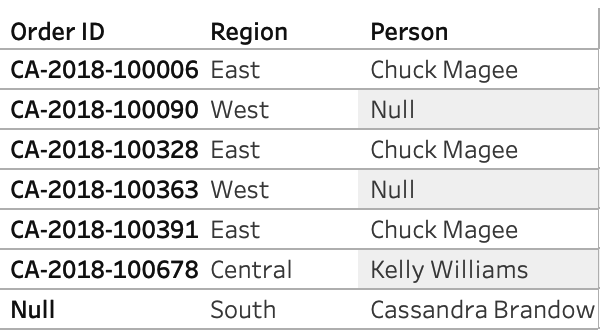
In an Inner join, we take the left and the right table, and will get a match only on the regions that are in both sets of tables—the East and Central regions. All of our orders that contain the West region will be removed from our data set, and the person for the South region won’t appear either.

Choose the Venn diagram with the left circle shaded shaded for a Left join:
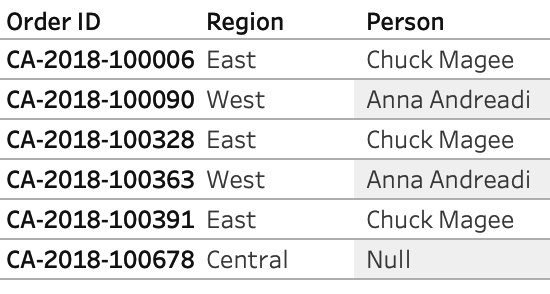
A Left join is going to bring back all of the data from our left table, including the records that do and don’t match. So, it will bring back all of our orders, and the person would be Null:
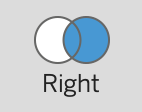
Select the Venn diagram with the right circle shaded for a Right join:
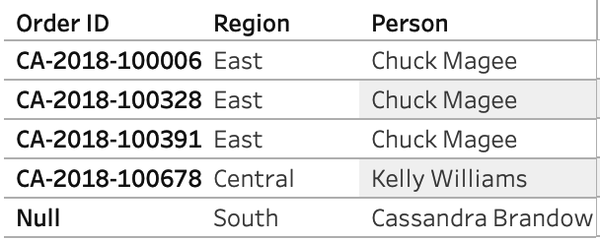
This will bring back everything from the right table that does and doesn’t match by region. In this example, we will have Central, East, and South regions, but we won’t have any orders for the South region:

And finally, select the last join type, Full Outer (represented by both circles being shaded):
1.8 Data Types
When you bring your data into Tableau, Tableau tries to recognize its type. For example, numbers are brought through as either integers or floats, which are decimals. If you have a field that looks like a date, Tableau will automatically use its date field, likewise with a geographic field called country or city.
Problem
You want to check that Tableau has used the correct data type on a field.
Solution
-
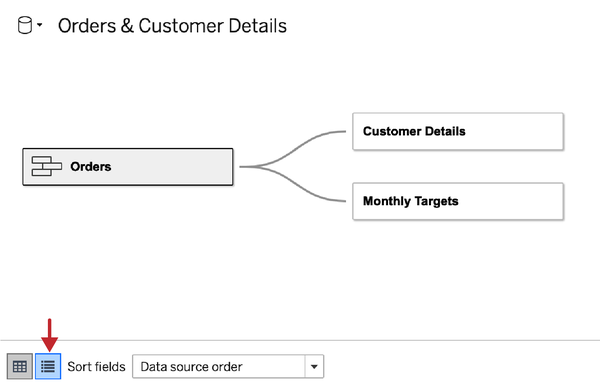
In the data grid at the bottom of the data source page, select the metadata grid icon.
Note
The metadata grid shows all of your columns of data as rows. This is to enable a quick inspection of the data structure and data types.
-
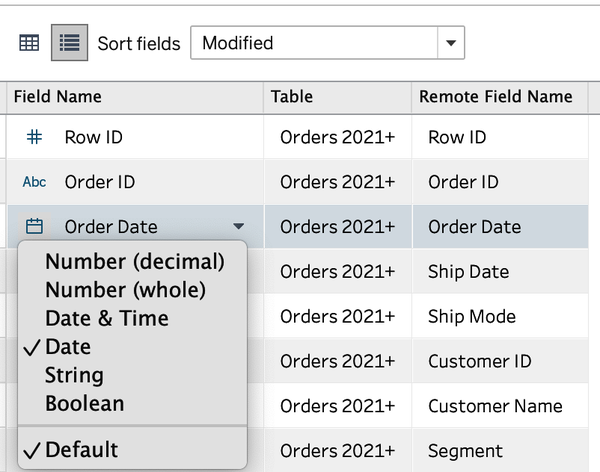
You will see icons next to each field. Click an icon to check the type of data:
-

If you want to specifically change a geographic field, you can find the field with the globe icon and change the role:
Discussion
It is important to check the data types Tableau has assigned to your data. Tableau has six types of data. Number (decimal) and Number (whole) return numeric fields as either a decimal or a whole number. Date & Time and Date both use Tableau’s built-in date hierarchy (more in Chapter 5). String is used for any field that contains text. And finally, Boolean returns either true or false values within the data.
1.9 Creating Extracts
When you are connecting to big data sets, you might have performance issues caused by slower loading times of your dashboards. Creating extracts can help ease those performance issues, along with giving you the ability to use an extract offline compared to an online database.
Problem
You want to create an extract of the data source to increase performance and to use data offline.
Solution
-
Once you have connected to any data source, in the top-right corner you have the option to select Extract; click that option:

-

Now you have some options to edit the extract. Click Edit:
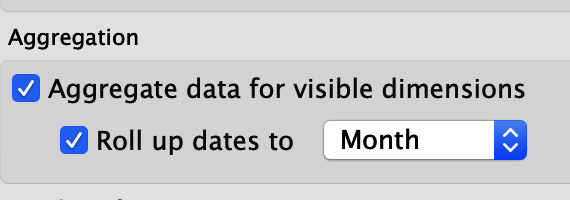
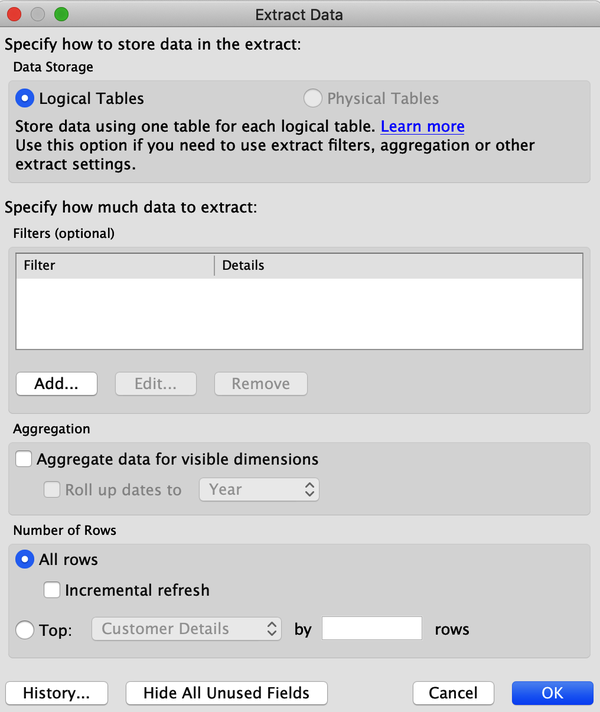
This will open a pop-up box asking how you want to store the data, how much data to extract, whether to have any aggregation, and how many rows:
-
Fill out the information and click OK. You will need to go to a new sheet to start the extract process.
Discussion
An extract can improve performance on large data sources, but could take some time to create. An extract creates a Hyper file of your data.
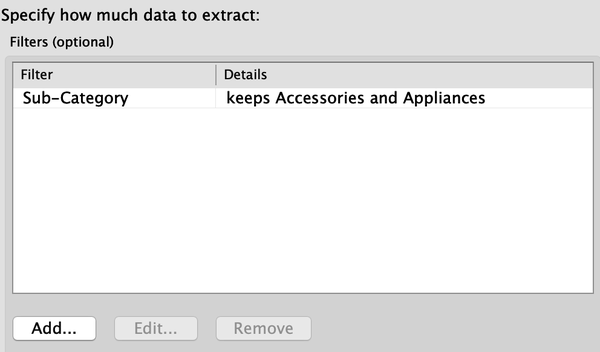
You can change your extract at any time. You can create the first extract to enable faster development times, but once you have finished your dashboards productions, recommend going back to the extract to optimize. For example, I can add a filter to show only a specific subcategory of data:
Summary
You should now understand several data sources that you can use within Tableau Desktop. This includes working with messy data, pivoting data, and creating extracts.
Understanding data sources is fundamental to getting started with data. Without data sources, you cannot start any analysis. This chapter has given you the data source you will be using for the majority of the examples in the book.
Get Tableau Desktop Cookbook now with the O’Reilly learning platform.
O’Reilly members experience books, live events, courses curated by job role, and more from O’Reilly and nearly 200 top publishers.
