Appendix I
Environmental Performances of Developed Countries
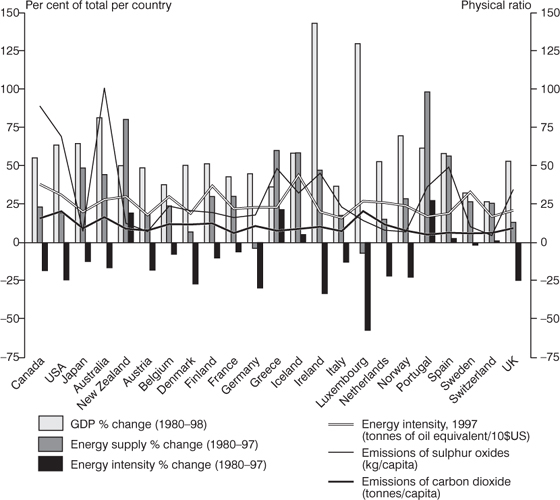
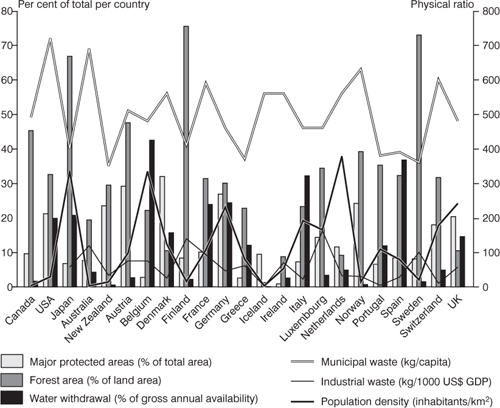
Figures I.1 and I.2 provide a snapshot of a development in the environmental impact and performances of the developed countries. The figures are from 1998/1999 (OECD, 1999b). The lines on the graph are simply a visual aid and are not representative of any connections. GDP and population trends are shown as a reference. The figures reveal significant differences among the developed countries.

Figure I.1 Energy consumption and related pollution of developed countries

Figure I.2 Protected ...
Get Sustainable Finance and Banking now with the O’Reilly learning platform.
O’Reilly members experience books, live events, courses curated by job role, and more from O’Reilly and nearly 200 top publishers.

