Chapter 1. Why Python for Excel?
Usually, Excel users start to question their spreadsheet tools when they hit a limitation. A classic example is when Excel workbooks contain so much data and formulas that they become slow or in the worst case, crash. It does make sense, though, to question your setup before things go south: if you work on mission-critical workbooks where errors can result in financial or reputational damage or if you spend hours every day updating Excel workbooks manually, you should learn how to automate your processes with a programming language. Automation takes out the risk of human error and allows you to spend your time on more productive tasks than copy/pasting data into an Excel spreadsheet.
In this chapter, I will give you a few reasons why Python is an excellent choice in combination with Excel and what its advantages are compared to Excel’s built-in automation language, VBA. After introducing Excel as a programming language and understanding its particularities, I will point out the specific features that make Python so much stronger in comparison with VBA. To start with, however, let’s take a quick look at the origins of our two main characters!
In terms of computer technology, Excel and Python have both been around for a very long time: Excel was first launched in 1985 by Microsoft—and this may come as a surprise to many—it was only available for Apple Macintosh. It wasn’t until 1987 that Microsoft Windows got its first version in the form of Excel 2.0. Microsoft wasn’t the first player in the spreadsheet market, though: VisiCorp came out with VisiCalc in 1979, followed by Lotus Software in 1983 with Lotus 1-2-3. And Microsoft didn’t lead with Excel: three years earlier, they released Multiplan, a spreadsheet program that could be used on MS-DOS and a few other operating systems, but not on Windows.
Python was born in 1991, only six years after Excel. While Excel became popular early on, it took Python a bit longer until it got adopted in certain areas like web development or system administration. In 2005, Python started to become a serious alternative for scientific computing when NumPy, a package for array-based computing and linear algebra, was first released. NumPy combined two predecessor packages and therefore streamlined all development efforts around scientific computing into a single project. Today, it forms the basis of countless scientific packages, including pandas, which came out in 2008 and which is largely responsible for the widespread adoption of Python in the world of data science and finance that started to happen after 2010. Thanks to pandas, Python, alongside R, has become one of the most commonly used languages for data science tasks like data analysis, statistics, and machine learning.
The fact that Python and Excel were both invented a long time ago isn’t the only thing they have in common: Excel and Python are also both a programming language. While you are probably not surprised to hear that about Python, it may require an explanation for Excel, which I’ll give you next.
Excel Is a Programming Language
This section starts by introducing Excel as a programming language, which will help you to understand why spreadsheet issues turn up in the news on a regular basis. We’ll then have a look at a few best practices that have emerged in the software development community and that can save you from many typical Excel errors. We’ll conclude with a brief introduction to Power Query and Power Pivot, two modern Excel tools that cover the sort of functionality for which we will use pandas instead.
If you use Excel for more than your grocery list, you are definitely using functions like =SUM(A1:A4) to sum up a range of cells. If you think for a moment about how this works, you will notice that the value of a cell usually depends on one or more other cells, which may again use functions that depend on one or more other cells, and so on. Doing such nested function calls is no different from how other programming languages work, only that you write the code in cells instead of text files. And if that didn’t convince you just yet: at the end of 2020, Microsoft announced the introduction of lambda functions, which allow you to write reusable functions in Excel’s own formula language, i.e., without having to rely on a different language like VBA. According to Brian Jones, Excel’s head of product, this was the missing piece that finally makes Excel a “real” programming language.1 This also means that Excel users should really be called Excel programmers!
There is a special thing, though, about Excel programmers: most of them are business users or domain experts without a formal education in computer science. They are traders, accountants, or engineers, to mention just a few examples. Their spreadsheet tools are designed to solve a business problem and often ignore best practices in software development. As a consequence, these spreadsheet tools often mix inputs, calculations, and outputs on the same sheets, they may require nonobvious steps to be performed for them to work properly, and critical changes are done without any safety net. In other words, the spreadsheet tools are lacking a solid application architecture and are often undocumented and untested. Sometimes, these issues can have devastating consequences: if you forget to recalculate your trading workbook before placing a trade, you may buy or sell the wrong number of shares, which can cause you to lose money. And if it isn’t just your own money you are trading, we can read about it in the news, as we’ll see next.
Excel in the News
Excel is a regular guest in the news, and during the course of this writing, two new stories hit the headlines. The first one was about the HUGO Gene Nomenclature Committee, which renamed a few human genes so they wouldn’t be interpreted by Excel as dates anymore. For example, to prevent that the gene MARCH1 would be turned into 1-Mar, it was renamed into MARCHF1.2 In the second story, Excel was blamed for the delayed reporting of 16,000 COVID-19 test results in England. The issue was caused by the test results being written to the older Excel file format (.xls) that was limited to roughly 65,000 rows. This meant that larger datasets were simply cut off beyond that limit.3 While these two stories show the continued importance and dominance of Excel in today’s world, there is probably no other “Excel incident” that is more famous than the London Whale.
London Whale is the nickname of a trader whose trading mistakes forced JP Morgan to announce a staggering loss of $6 billion in 2012. The source of the blowup was an Excel-based value-at-risk model that was substantially underestimating the true risk of losing money in one of their portfolios. The Report of JPMorgan Chase & Co. Management Task Force Regarding 2012 CIO Losses4 (2013) mentions that “the model operated through a series of Excel spreadsheets, which had to be completed manually, by a process of copying and pasting data from one spreadsheet to another.” On top of these operational issues, they had a logical error: in one calculation, they were dividing by a sum instead of an average.
If you want to see more of these stories, have a look at Horror Stories, a web page maintained by the European Spreadsheet Risks Interest Group (EuSpRIG).
To prevent your company from ending up in the news with a similar story, let’s have a look at a few best practices next that make your work with Excel massively safer.
Programming Best Practices
This section will introduce you to the most important programming best practices, including separation of concerns, the DRY principle, testing, and version control. As we will see, following them will be easier when you start using Python together with Excel.
Separation of concerns
One of the most important design principles in programming is separation of concerns, sometimes also referred to as modularity. It means that a related set of functionality should be taken care of by an independent part of the program so it can be easily replaced without affecting the rest of the application. At the highest level, an application is often divided into the following layers:5
-
Presentation layer
-
Business layer
-
Data layer
To explain these layers, consider a simple currency converter like the one shown in Figure 1-1. You’ll find the currency_converter.xlsx Excel file in the xl folder of the companion repository.
This is how the application works: type in the Amount and Currency into cells A4 and B4, respectively, and Excel will convert this into US dollars in cell D4. Many spreadsheet applications follow such a design and are used by businesses every day. Let me break the application down into its layers:
- Presentation layer
-
This is what you see and interact with, i.e., the user interface: the values of cells A4, B4, and D4 together with their labels build the presentation layer of the currency converter.
- Business layer
-
This layer takes care of the application-specific logic: cell D4 defines how the amount is converted into USD. The formula
=A4 * VLOOKUP(B4, F4:G11, 2, FALSE)translates to Amount times Exchange rate. - Data layer
-
As the name suggests, this layer takes care of accessing the data: the
VLOOKUPpart of cell D4 is doing this job.
The data layer accesses the data from the exchange rates table that starts in cell F3 and that acts as the database of this little application. If you paid close attention, you probably noticed that cell D4 appears in all three layers: this simple application mixes the presentation, business, and data layers in a single cell.
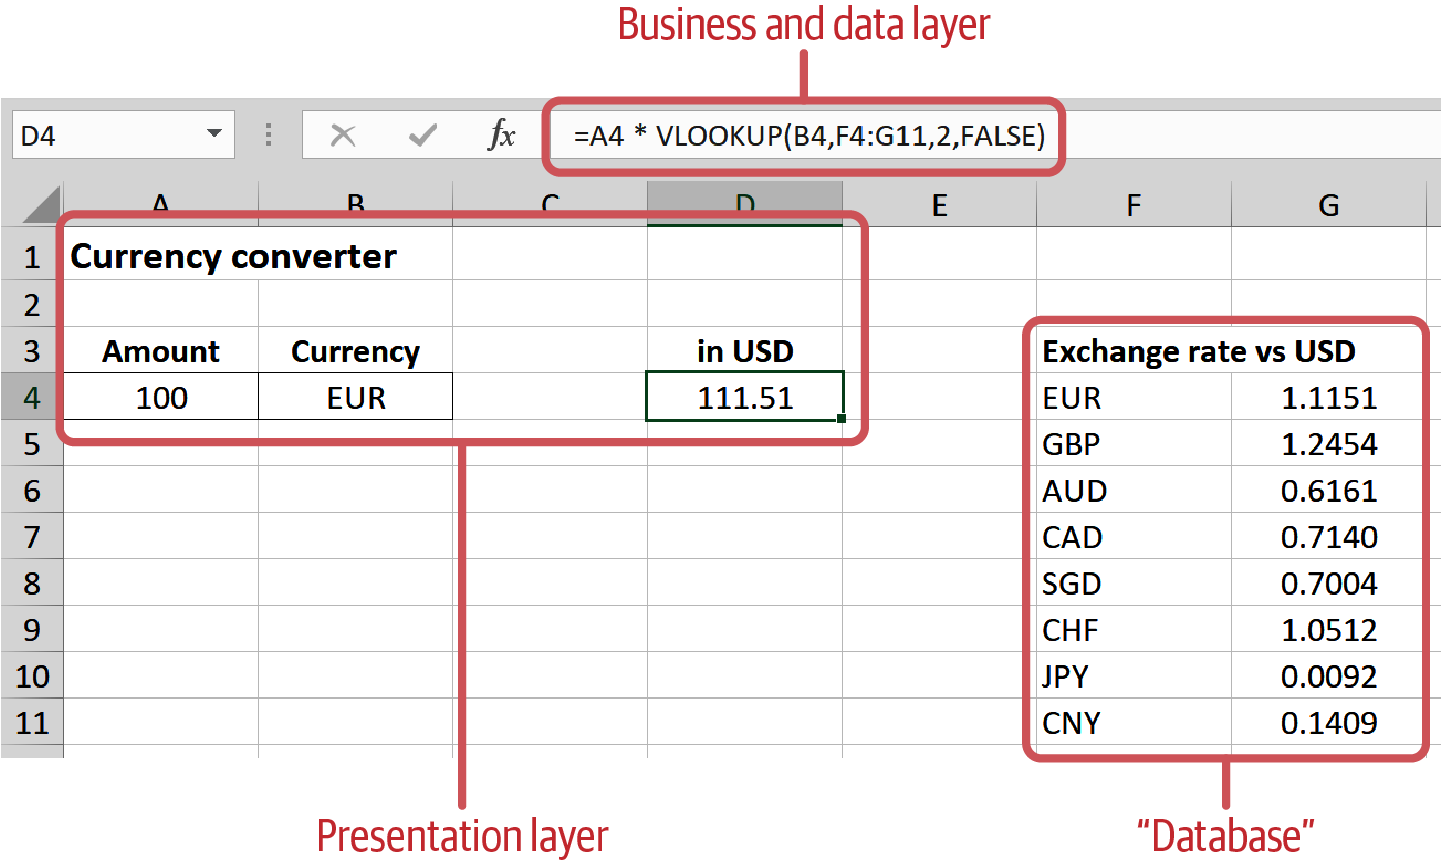
Figure 1-1. currency_converter.xlsx
This isn’t necessarily an issue for this simple currency converter, but often, what starts off as a small Excel file turns soon enough into a much bigger application. How can this situation be improved? Most professional Excel developer resources advise you to use a separate sheet for each layer, in Excel’s terminology usually called inputs, calculations, and outputs. Often, this is combined with defining a certain color code for each layer, e.g., a blue background for all input cells. In Chapter 11, we will build a real application based on these layers: Excel will be the presentation layer, while the business and data layers are moved to Python, where it’s much easier to structure your code properly.
Now that you know what separation of concerns means, let’s find out what the DRY principle is!
DRY principle
The Pragmatic Programmer by Hunt and Thomas (Pearson Education) popularized the DRY principle: don’t repeat yourself. No duplicated code means fewer lines of code and fewer errors, which makes the code easier to maintain. If your business logic sits in your cell formulas, it’s practically impossible to apply the DRY principle, as there is no mechanism that allows you to reuse it in another workbook. This, unfortunately, means that a common way to start a new Excel project is to copy the workbook from the previous project or from a template.
If you write VBA, the most common piece of reusable code is a function. A function gives you access to the same code block from multiple macros, for example. If you have multiple functions that you use all the time, you might want to share them between workbooks. The standard instrument to share VBA code across workbooks is add-ins, but VBA add-ins lack a robust way of distributing and updating them. While Microsoft has introduced an Excel internal add-in store to solve that issue, this only works with JavaScript-based add-ins, so it’s not an option for VBA coders. This means that it is still very common to use the copy/paste approach with VBA: let’s assume that you need a cubic spline function in Excel. The cubic spline function is a way to interpolate a curve based on a few given points in a coordinate system and is often used by fixed income traders to derive an interest rate curve for all maturities based on a few known maturity/interest rate combinations. If you search for “Cubic Spline Excel” on the internet, it won’t take too long until you have a page of VBA code that does what you want. The issue with this is that most commonly, these functions were written by a single person with probably good intentions but without formal documentation or testing. Maybe they work for the majority of inputs, but what about some uncommon edge cases? If you are trading a multimillion fixed-income portfolio, you want to have something you know you can trust. At least, that is what you will hear from your internal auditors when they find out where the code is coming from.
Python makes it easy to distribute code by using a package manager, as we will see in the last section of this chapter. Before we get there, however, let’s continue with testing, one of the cornerstones of solid software development.
Testing
When you tell an Excel developer to test their workbooks, they will most likely perform a few random checks: click a button and see if the macro still does what it is supposed to do or change a few inputs and check if the output looks reasonable. This is, however, a risky strategy: Excel makes it easy to introduce errors that are hard to spot. For example, you can overwrite a formula with a hardcoded value. Or you forget to adjust a formula in a hidden column.
When you tell a professional software developer to test their code, they will write unit tests. As the name suggests, it’s a mechanism to test individual components of your program. For example, unit tests make sure that a single function of a program works properly. Most programming languages offer a way to run unit tests automatically. Running automated tests will increase the reliability of your codebase dramatically and make reasonably sure that you won’t break anything that currently works when you edit your code.
If you look at the currency conversion tool in Figure 1-1, you could write a test that checks if the formula in cell D4 correctly returns USD 105 with the following inputs: 100 EUR as amount and 1.05 as the EURUSD exchange rate. Why does this help? Assume that you accidentally delete cell D4 with the conversion formula and have to rewrite it: instead of multiplying the amount with the exchange rate, you divide by it—after all, working with currencies can be confusing. When you run the above test, you will get a test failure as 100 EUR / 1.05 will not result in 105 USD anymore as the test expects. Like this, you can detect and fix the formula before you hand the spreadsheet over to your users.
Pretty much all traditional programming languages offer one or more test frameworks to write unit tests without much effort—but not Excel. Fortunately, the concept of unit tests is simple enough and by connecting Excel with Python, you get access to Python’s powerful unit testing frameworks. While a more in-depth presentation of unit tests is beyond the scope of this book, I invite you to have a look at my blog post, in which I walk you through the topic with practical examples.
Unit tests are often set up to run automatically when you commit your code to your version control system. The next section explains what version control systems are and why they are hard to use with Excel files.
Version control
Another characteristic of professional programmers is that they use a system for version control or source control. A version control system (VCS) tracks changes in your source code over time, allowing you to see who changed what, when, and why, and allows you to revert to old versions at any point in time. The most popular version control system nowadays is Git. It was originally created to manage the Linux source code and since then has conquered the programming world—even Microsoft adopted Git in 2017 to manage the Windows source code. In the Excel world, by contrast, the by far most popular version control system comes in the form of a folder where files are archived like this:
currency_converter_v1.xlsx
currency_converter_v2_2020_04_21.xlsx
currency_converter_final_edits_Bob.xlsx
currency_converter_final_final.xlsx
If, unlike in this sample, the Excel developer sticks to a certain convention in the file name, there’s nothing inherently wrong with that. But keeping a version history of your files locally locks you out of important aspects of source control in the form of easier collaboration, peer reviews, sign-off processes, and audit logs. And if you want to make your workbooks more secure and stable, you don’t want to miss out on these things. Most commonly, professional programmers use Git in connection with a web-based platform like GitHub, GitLab, Bitbucket, or Azure DevOps. These platforms allow you to work with so-called pull requests or merge requests. They allow developers to formally request that their changes are merged into the main codebase. A pull request offers the following information:
-
Who is the author of the changes
-
When were the changes made
-
What is the purpose of the changes as described in the commit message
-
What are the details of the changes as shown by the diff view, i.e., a view that highlights changes in green for new code and red for deleted code
This allows a coworker or a team head to review the changes and spot irregularities. Often, an extra pair of eyes will be able to spot a glitch or two or give otherwise valuable feedback to the programmer. With all these advantages, why do Excel developers prefer to use the local file system and their own naming convention instead of a professional system like Git?
-
Many Excel users simply don’t know about Git or give up early on, as Git has a relatively steep learning curve.
-
Git allows multiple users to work on local copies of the same file in parallel. After all of them commit their work, Git can usually merge all the changes together without any manual intervention. This doesn’t work for Excel files: if they are being changed in parallel on separate copies, Git doesn’t know how to merge these changes back into a single file.
-
Even if you manage to deal with the previous issues, Git simply doesn’t deliver as much value with Excel files as it does with text files: Git isn’t able to show changes between Excel files, preventing a proper peer review process.
Because of all these issues, my company has come up with xltrail, a Git-based version control system that knows how to deal with Excel files. It hides away the Git complexity so that business users feel comfortable using it and also allows you to connect to external Git systems, in case you are already tracking your files with GitHub, for example. xltrail tracks the different components of a workbook, including cell formulas, named ranges, Power Queries, and VBA code, allowing you to take advantage of the classic benefits of version control including peer reviews.
Another option to make version control easier with Excel is to move your business logic from Excel into Python files, something we will do in Chapter 10. As Python files are straightforward to track with Git, you will have the most important part of your spreadsheet tool under control.
While this section is called Programming Best Practices, it is mainly pointing out why they are harder to follow with Excel than with a traditional programming language like Python. Before we turn our attention to Python, I would like to briefly introduce Power Query and Power Pivot, Microsoft’s attempt at modernizing Excel.
Modern Excel
The modern era of Excel started with Excel 2007 when the ribbon menu and the new file formats (e.g., xlsx instead of xls) were introduced. However, the Excel community uses modern Excel to refer to the tools that were added with Excel 2010: most importantly Power Query and Power Pivot. They allow you to connect to external data sources and analyze data that is too big to fit into a spreadsheet. As their functionality overlaps with what we will do with pandas in Chapter 5, I will briefly introduce them in the first part of this section. The second part is about Power BI, which could be described as a standalone business intelligence application combining the functionality of Power Query and Power Pivot with visualization capabilities—and it has built-in support for Python!
Power Query and Power Pivot
With Excel 2010, Microsoft introduced an add-in called Power Query. Power Query connects to a multitude of data sources including Excel workbooks, CSV files, and SQL databases. It also offers connections to platforms like Salesforce and can even be extended to connect with systems that aren’t covered out of the box. Power Query’s core functionality is dealing with datasets that are too big to fit into a spreadsheet. After loading the data, you may perform additional steps to clean and manipulate it so it arrives in a usable form in Excel. You could, for example, split a column into two, merge two tables, or filter and group your data. Since Excel 2016, Power Query is not an add-in anymore but can be accessed directly on the ribbon tab Data via the Get Data button. Power Query is only partially available on macOS—however, it is being actively developed, so it should be fully supported in a future release of Excel.
Power Pivot goes hand in hand with Power Query: conceptually, it’s the second step after acquiring and cleaning your data with Power Query. Power Pivot helps you to analyze and present your data in an appealing way directly in Excel. Think of it as a traditional pivot table that, like Power Query, can deal with large datasets. Power Pivot allows you to define formal data models with relationships and hierarchies, and you can add calculated columns via the DAX formula language. Power Pivot was also introduced with Excel 2010 but remains an add-in and is so far not available on macOS.
If you like to work with Power Query and Power Pivot and want to build dashboards on top of them, Power BI may be worth a look—let’s see why!
Power BI
Power BI is a standalone application that was released in 2015. It is Microsoft’s answer to business intelligence tools like Tableau or Qlik. Power BI Desktop is free, so if you want to play around with it, go to the Power BI home page and download it—note, however, that Power BI Desktop is only available for Windows. Power BI wants to make sense of large datasets by visualizing them in interactive dashboards. At its core, it is relying on the same Power Query and Power Pivot functionality as Excel. Commercial plans allow you to collaborate and share dashboards online, but these are separate from the desktop version. The main reason why Power BI is exciting in the context of this book is that it’s been supporting Python scripts since 2018. Python can be used for the query part as well as the visualization part by making use of Python’s plotting libraries. To me, using Python in Power BI feels a bit clunky, but the important part here is that Microsoft has recognized the importance of Python with regard to data analysis. Accordingly, the hopes are high that one day Python will find an official way into Excel, too.
So what’s so great about Python that it made it into Microsoft’s Power BI? The next section has a few answers!
Python for Excel
Excel is all about storing, analyzing, and visualizing data. And since Python is particularly strong in the area of scientific computing, it’s a natural fit in combination with Excel. Python is also one of the very few languages that is appealing to both the professional programmer as well as the beginner user who writes a few lines of code every few weeks. Professional programmers, on the one hand, like to work with Python because it is a general-purpose programming language and therefore allows you to achieve pretty much anything without jumping through hoops. Beginners, on the other hand, like Python because it’s easier to learn than other languages. As a consequence, Python is used both for ad hoc data analysis and smaller automation tasks as well as in huge production codebases like Instagram’s backend.6 This also means that when your Python-powered Excel tool becomes really popular, it’s easy to add a web developer to the project who will turn your Excel-Python prototype into a fully-fledged web application. The unique advantage of Python is that the part with the business logic most likely doesn’t need to be rewritten but can be moved as-is from the Excel prototype to the production web environment.
In this section, I’ll introduce Python’s core concepts and compare them with Excel and VBA. I will touch on code readability, Python’s standard library and package manager, the scientific computing stack, modern language features, and cross-platform compatibility. Let’s dive into readability first!
Readability and Maintainability
If your code is readable, it means that it is easy to follow and understand—especially for outsiders who haven’t written the code themselves. This makes it easier to spot errors and maintain the code going forward. That’s why one line in The Zen of Python is “readability counts.” The Zen of Python is a concise summary of Python’s core design principles, and we will learn how to print it in the next chapter. Let’s have a look at the following code snippet in VBA:
Ifi<5ThenDebug."i is smaller than 5"ElseIfi<=10ThenDebug."i is between 5 and 10"ElseDebug."i is bigger than 10"EndIf
In VBA, you can reformat the snippet into the following, which is completely equivalent:
Ifi<5ThenDebug."i is smaller than 5"ElseIfi<=10ThenDebug."i is between 5 and 10"ElseDebug."i is bigger than 10"EndIf
In the first version, the visual indentation aligns with the logic of the code. This makes it easy to read and understand the code, which again makes it easier to spot errors. In the second version, a developer who is new to the code might not see the ElseIf and Else condition when glancing over it for the first time—this is obviously even more true if the code is part of a larger codebase.
Python doesn’t accept code that is formatted like the second example: it forces you to align the visual indentation with the logic of the code, preventing readability issues. Python can do this because it relies on indentation to define code blocks as you use them in if statements or for loops. Instead of indentation, the majority of the other languages use curly braces, and VBA uses keywords such as End If, as we just saw
in the code snippets. The reason behind using indentation for code blocks is that in
programming, most of the time is spent on maintaining code rather than writing it in the first place. Having readable code helps new programmers (or yourself a few months after writing the code) to go back and understand what’s going on.
We will learn all about Python’s indentation rules in Chapter 3, but for now let’s move on with the standard library: the functionality that comes with Python out of the box.
Standard Library and Package Manager
Python comes with a rich set of built-in functionality delivered by its standard library. The Python community likes to refer to it by saying that Python comes with “batteries included.” Whether you need to uncompress a ZIP file, read the values of a CSV file, or want to fetch data from the internet, Python’s standard library has you covered, and you can achieve all this in usually just a few lines of code. The same functionality in VBA would require you to write a considerable amount of code or install an add-in. And often, the solutions you find on the internet only work on Windows but not macOS.
While Python’s standard library covers an impressive amount of functionality, there are still tasks that are cumbersome to program or slow when you are only relying on the standard library. This is where PyPI comes in. PyPI stands for Python Package Index and is a giant repository where everybody (including you!) can upload open source Python packages that add additional functionality to Python.
PyPI vs. PyPy
PyPI is pronounced “pie pea eye.” This is to differentiate PyPI from PyPy which is pronounced “pie pie” and which is a fast alternative implementation of Python.
For example, to make it easier to fetch data from sources on the internet, you could install the Requests package to get access to a set of commands that are powerful yet easy to use. To install it, you would use Python’s package manager pip, which you run on a Command Prompt or Terminal. pip is a recursive acronym for pip installs packages. Don’t worry if this sounds a bit abstract right now; I will explain how this works in detail in the next chapter. For now, it’s more important to understand why package managers are so important. One of the main reasons is that any reasonable package will not just depend on Python’s standard library, but again on other open source packages that are also hosted on PyPI. These dependencies might again depend on subdependencies and so forth. pip recursively checks the dependencies and subdependencies of a package and downloads and installs them. pip also makes it easy to update your packages so you can keep your dependencies up-to-date. This makes adhering to the DRY principle much easier, as you don’t need to reinvent or copy/paste what’s already available on PyPI. With pip and PyPI, you also have a solid mechanism to distribute and install these dependencies, something that Excel is lacking with its traditional add-ins.
With pip, you can install packages for just about anything, but for Excel users, some of the most interesting ones are certainly the packages for scientific computing. Let’s learn a bit more about scientific computing with Python in the next section!
Scientific Computing
An important reason for Python’s success is the fact that it was created as a general-purpose programming language. The capabilities for scientific computing were added later on in the form of third-party packages. This has the unique advantage that a data scientist can use the same language for experiments and research as a web developer, who may eventually build a production-ready application around the computational core. Being able to build scientific applications out of one language reduces friction, implementation time, and costs. Scientific packages like NumPy, SciPy, and pandas give us access to a very concise way of formulating mathematical problems. As an example, let’s have a look at one of the more famous financial formulas used to calculate the portfolio variance according to Modern Portfolio Theory:
The portfolio variance is denoted by , while is the weight vector of the individual assets and is the portfolio’s covariance matrix. If w and C are Excel ranges, you can calculate the portfolio variance in VBA like so:
variance=Application.MMult(Application.MMult(Application.Transpose(w),C),w)
Compare this to the almost mathematical notation in Python, assuming that w and C are pandas DataFrames or NumPy arrays (I will formally introduce them in Part II):
variance=w.T@C@w
But it’s not just about aesthetics and readability: NumPy and pandas use compiled Fortran and C code under the hood, which gives you a performance boost when working with big matrices compared to VBA.
Missing support for scientific computing is an obvious limitation in VBA. But even if you look at the core language features, VBA has fallen behind, as I will point out in the next section.
Modern Language Features
Since Excel 97, the VBA language hasn’t had any major changes in terms of language features. That, however, doesn’t mean that VBA isn’t supported anymore: Microsoft is shipping updates with every new release of Excel to be able to automate the new Excel features introduced with that release. For example, Excel 2016 added support to automate Power Query. A language that stopped evolving more than twenty years ago is missing out on modern language concepts that were introduced in all major programming languages over the years. As an example, error handling in VBA is really showing its age. If you’d like to handle an error gracefully in VBA, it goes something like this:
SubPrintReciprocal(numberAsVariant)' There will be an error if the number is 0 or a stringOnErrorGoToErrorHandlerresult=1/numberOnErrorGoTo0Debug."There was no error!"Finally:' Runs whether or not an error occursIfresult=""Thenresult="N/A"EndIfDebug."The reciprocal is: "&resultExitSubErrorHandler:' Runs only in case of an errorDebug."There was an error: "&Err.DescriptionResumeFinallyEndSub
Please note that you probably wouldn’t calculate the reciprocal like this—I only use it here as an example to make it easier to follow the code flow. VBA error handling involves the use of labels like Finally and ErrorHandler in the example. You instruct the code to jump to these labels via the GoTo or Resume statements. Early on, labels were recognized to be responsible for what many programmers would call spaghetti code: a nice way of saying that the flow of the code is hard to follow and therefore difficult to maintain. That’s why pretty much all of the actively developed languages have introduced the try/catch mechanism—in Python called try/except—that I will introduce in Chapter 11.
If you are a proficient VBA developer, you might also enjoy the fact that Python supports class inheritance, a feature of object-oriented programming that is missing in VBA.
Besides modern language features, there’s another requirement for a modern programming language: cross-platform compatibility. Let’s see why this is important!
Cross-Platform Compatibility
Even if you develop your code on a local computer that runs on Windows or macOS, it’s very likely that you want to run your program on a server or in the cloud at some point. Servers allow your code to be executed on a schedule and make your application accessible from everywhere you want, with the computing power you need. In fact, I will show you how to run Python code on a server in the next chapter by introducing you to hosted Jupyter notebooks. The vast majority of servers run on Linux, as it is a stable, secure, and cost-effective operating system. And since Python programs run unchanged on all major operating systems, this will take out much of the pain when you transition from your local machine to a production setup.
In contrast, even though Excel VBA runs on Windows and macOS, it’s easy to introduce functionality that only runs on Windows. In the official VBA documentation or on forums, you will often see code like this:
Setfso=CreateObject("Scripting.FileSystemObject")
Whenever you have a CreateObject call or are being told to go to Tools > References in the VBA editor to add a reference, you are almost always dealing with code that will only run on Windows. Another prominent area where you need to watch out if you want your Excel files to work across Windows and macOS are ActiveX controls. ActiveX controls are elements like buttons and dropdowns that you can place on your sheets, but they work only on Windows. Make sure to avoid them if you want your workbook to run on macOS too!
Conclusion
In this chapter, we met Python and Excel, two very popular technologies that have been around for multiple decades—a long time compared to many other technologies that we use today. The London Whale served as an example of how much can go wrong (in dollar terms) when you don’t use Excel properly with mission-critical workbooks. This was our motivation to look into a minimal set of programming best practices: applying separation of concerns, following the DRY principle, and making use of automated testing and version control. We then had a look at Power Query and Power Pivot, Microsoft’s approach at dealing with data that is bigger than your spreadsheet. I, however, feel that they are often not the right solution, as they lock you into the Microsoft world and prevent you from taking advantage of the flexibility and power of modern cloud-based solutions.
Python comes with convincing features that are missing in Excel: the standard library, the package manager, libraries for scientific computing, and cross-platform compatibility. By learning how to combine Excel with Python, you can have the best of both worlds and will save time through automation, commit fewer errors as it’s easier to follow programming best practices, and you will be able to take your application and scale it up outside of Excel if you ever need to.
Now that you know why Python is such a powerful companion for Excel, it’s time to set up your development environment to be able to write your first lines of Python code!
1 You can read the announcement of lambda functions on the Excel Blog.
2 James Vincent, “Scientists rename human genes to stop Microsoft Excel from misreading them as dates,” The Verge, August 6, 2020, https://oreil.ly/0qo-n.
3 Leo Kelion, “Excel: Why using Microsoft’s tool caused COVID-19 results to be lost,” BBC News, October 5, 2020, https://oreil.ly/vvB6o.
4 Wikipedia links to the document in one of the footnotes in their article about the case.
5 The terminology is taken from Microsoft Application Architecture Guide, 2nd Edition, which is available online.
6 You can learn more about how Instagram uses Python on their engineering blog.
Get Python for Excel now with the O’Reilly learning platform.
O’Reilly members experience books, live events, courses curated by job role, and more from O’Reilly and nearly 200 top publishers.

