Chapter 13. Bringing It All Together with SQL Nexus
WHAT'S IN THIS CHAPTER
What SQL Nexus can do
How to manage an effective data collection
Loading data into the tool and using the reports to troubleshoot issues
Adding custom reports
This chapter is about a troubleshooting tool called SQL Nexus that brings together all of the knowledge and skills covered in the book up to this point. To use the tool effectively you should be familiar with all the chapter topics covered so far.
SQL Nexus enables you to load and analyze SQL Server trace files, performance monitor logs, wait statistics, and locking and blocking information through a single tool.
It uses ReadTrace (part of RML Utilities and covered in Chapter 12) to process the SQL Trace files and provides the ReadTrace reports embedded in the tool for ease of use. It also analyzes blocking and wait statistics information collected by the PerfStats script (Chapter 11) and contains reports that enable you to drill down into that information too.
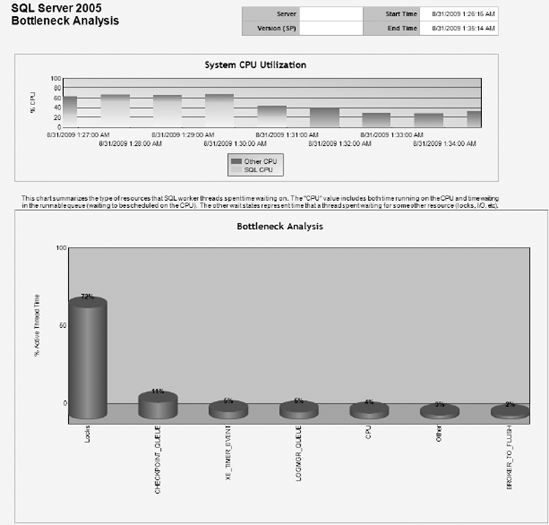
Figure 13-1 shows part of the Bottleneck Analysis report, which indicates CPU utilization on the server from which the data was collected, and SQL Server's contribution to it. You can also see an analysis of SQL Server wait types, which in this example indicates that 72% of SQL Server's wait time (Chapter 3) was spent waiting for locks.

Figure 13-1. FIGURE 13-1
Figure 13-2 shows the Blocking Chains report ...
Get Professional SQL Server® 2008 Internals and Troubleshooting now with the O’Reilly learning platform.
O’Reilly members experience books, live events, courses curated by job role, and more from O’Reilly and nearly 200 top publishers.

