The Test Report
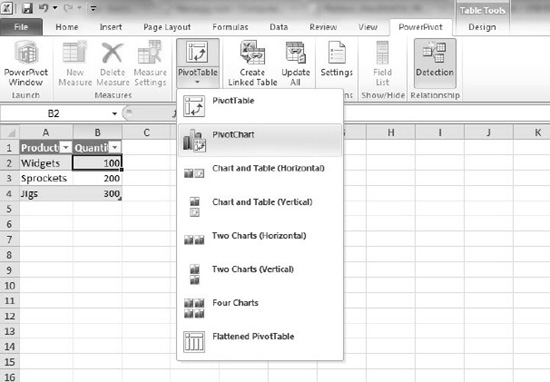
Now, from within Excel, our first test report from PowerPivot can be constructed. Select the PowerPivot ribbon item to show the PowerPivot-specific Excel operations. From the Report section of the PowerPivot ribbon, select the PivotTable drop-down and the PivotChart item. This operation is illustrated in Figure 1-6.

Figure 1-6. Inserting a PivotChart
From the ensuing dialog, select New Worksheet as the destination. This will render the PowerPivot Field List on the right-hand side of the worksheet. From the field list, drag Product into the area in the lower left-hand corner of the PowerPivot field list, which is labeled Axis ...
Get PowerPivot for Business Intelligence Using Excel and SharePoint now with the O’Reilly learning platform.
O’Reilly members experience books, live events, courses curated by job role, and more from O’Reilly and nearly 200 top publishers.

