Executing Traces and Working with Trace Output
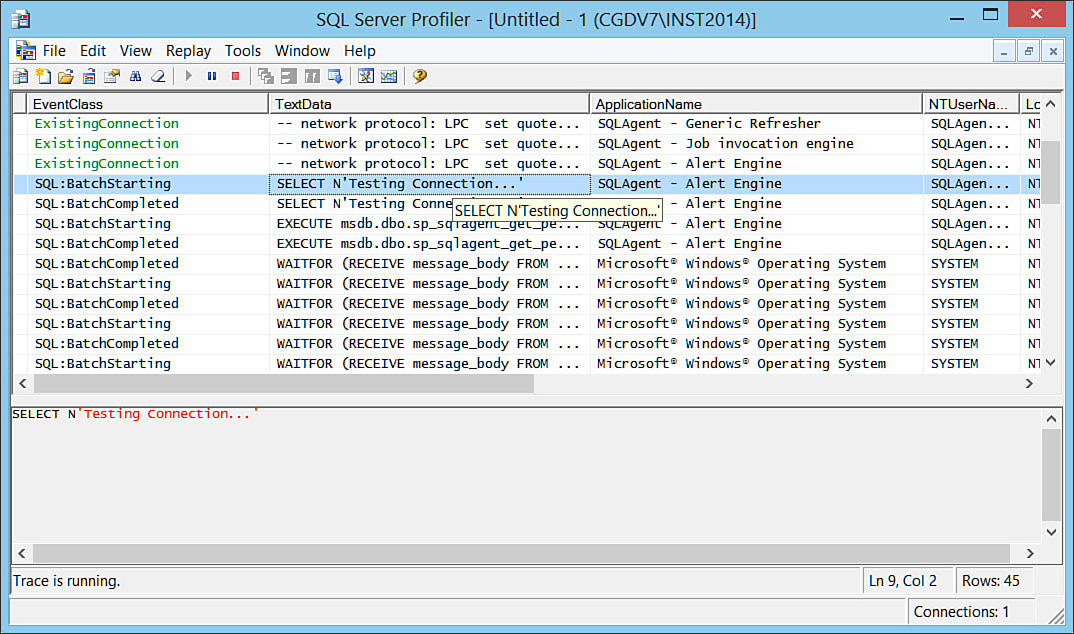
After you define the events and columns you want to capture in a trace, you can execute the Profiler trace. To do so, you click the Run button on the Trace Properties window, and the Profiler GUI starts capturing the events you have selected. The GUI contains a grid that is centrally located on the Profiler window, and newly captured events are scrolled on the screen as they are received. Figure 5.9 shows a simple example of the Profiler screen with output from an actively running trace.

FIGURE 5.9 The Profiler GUI with an active trace.
The Profiler GUI provides many different options for dealing ...
Get Microsoft SQL Server 2014 Unleashed now with the O’Reilly learning platform.
O’Reilly members experience books, live events, courses curated by job role, and more from O’Reilly and nearly 200 top publishers.

