Chapter 4. Technical Interview: Model Training and Evaluation
In this chapter, we will cover the ML model training process and related interview questions. To many practitioners, the model training is the most exciting part, and I agree―it’s very satisfying to see the model become more and more accurate throughout the process. However, to begin ML model training, hyperparameter tuning, and running experiments with various algorithms, you’ll need to have data. Machine learning at its core is letting algorithms find patterns in data and then making predictions and decisions based on those patterns. Having useful data is the foundation of ML, and as the industry adage says, “Garbage in, garbage out.” That is, if the ML models are training on useless data, then the resulting model and inferences will also be useless.
I’ll start with an overview of data processing and cleaning, which transforms raw data into a format that is useful for (and compatible with) ML algorithms. Next, I’ll go through algorithm selection, such as trade-offs between ML algorithms in different scenarios, and how to generally select the best one for a given problem.
After that, I’ll cover model training and the process of optimizing the model’s performance. This can be an ambiguous and challenging process, and there are some best practices you’ll learn, such as hyperparameter tuning and experiment tracking, which can prevent the best results from being lost and ensure that they are reproducible. On that note, I’ll also go over how to know when an ML algorithm is good, in a practical sense. This involves model evaluation and comparisons against some baseline models or baseline heuristics. Model evaluation can also help you determine the efficacy of the model on new, unseen data and discover whether the model might overfit, underfit, or otherwise underperform in the real world.
Note
I try to mention as many common ML interview techniques as space allows, but there are many more under the sun. Be sure to check out the linked resources to extend your learning and interview preparation!
Throughout this chapter, I’ll give practical tips and examples to help you succeed in your ML interviews. By the end of this chapter, you should have a solid understanding of the data cleaning, preprocessing, model training, and evaluation process and be able to discuss them well in your own interviews.
Defining a Machine Learning Problem
In this section, I provide a high-level overview of defining an ML problem, including why and how this shows up in interview questions.
Consider the following scenario: you, the candidate, are walking through an ML project you’ve built. The goal is to predict if a user will click on a promotional email for a particular singer’s concerts.1 Your interviewer thinks for a few seconds after your overview, then says, “It sounds like you can use the time that a user listens to artist A to determine who gets sent promotional emails for that artist. For example, if they listen to artist A for more than five hours a week, then send an email if artist A has a concert in the listener’s area. Given that there are simpler approaches that don’t use machine learning and achieve the same thing as your model, why did you choose ML?”
You freeze because you hadn’t thought of this question. It seemed like a fun, self-directed project at the time, and you just wanted to learn. You can’t quite understand what the interviewer is probing at with their question. What do you do?
It’s important to understand beforehand how you can answer these questions well. Here are some possible angles:
Did you think about using a heuristic-based (i.e., rules-based) baseline first? In applicable situations, you can also use an as-simple-as-possible model, such as a logistic regression model, as a baseline. Then, the goal of your ML model would be to perform better than the baseline.
In real-world situations, new ML initiatives often aren’t launched or approved unless there’s clear business value to justify the engineering time and effort. For example, if the costs of implementing an ML system to recommend concerts from scratch don’t outweigh the expected earnings, then it’s easier to use heuristics. Projected savings on complexities, manual work, or time is also a reason to use ML over heuristics.
Don’t worry though—the interviewer isn’t slighting your project but rather asking, “Why ML?” This is very common in the professional ML world. Asking “why ML?” doesn’t mean “you really shouldn’t have used ML.” It’s just the beginning of a discussion, one that ML professionals have often in their day-to-day lives. The way you respond to this question, especially for new grads, can be a good signal of whether you can transition well to working in ML in industry.
Here’s what you could say that would work in this scenario:
Be honest: “To be honest, I just wanted to learn some new modeling techniques with a side project, and since I’m a heavy user of Spotify, I wanted to see how I could emulate its email feature with ML.”
If you’re talking about a work project: “In reality, I found that heuristics worked, but only for the most average users. For example, heavy users require a longer listening time to determine their favorite artists. Additionally, once we included other data like likes and add to playlists to the heuristics, we noticed a higher response to the promotional email. Thus, the heuristics became too complicated and hard to scale. That’s why we started using ML instead, so it could find patterns in a larger number of features.”
Tip
Being honest is fine. As a new grad, I once prefaced one of my side project walkthroughs with, “This is a classifier for Ariana Grande images. I just wanted to do this project for fun, and there’s no real reason it had to be Ariana Grande. Here’s how I did it…” But I still managed to be taken seriously by interviewers, by justifying the project as an opportunity to use convolutional neural networks.
If you’re doing your own side project and expect to use it for answering interview questions, consider what heuristic methods could achieve the goal you want. Later, you can use them as a simple baseline to see if the ML method is better. This will help you stand out from other candidates. I’ll cover model selection and model evaluation later in this chapter.
Data Preprocessing and Feature Engineering
In this section, I’ll summarize common data preprocessing and feature engineering techniques and scenarios as well as common ML interview questions that cover this step in the ML lifecycle. For simplicity, I’ll assume that data is available for the ML interview questions, even if that is a common challenge in real-life scenarios. I’ll start with an introduction to data acquisition,2 exploratory data analysis (EDA), and feature engineering.
Tip
All data and ML roles will use data preprocessing and EDA. Some of the techniques in this chapter are specifically for ML but are still useful for data analysts or data engineers.
Introduction to Data Acquisition
Acquiring data, commonly referred to as data acquisition in the context of ML, can involve the following options:
Work access, usually proprietary data
Public datasets, such as from Kaggle, census bureaus, and the like
Web scraping (beware of some sites’ terms and conditions)
Academic access, such as being part of a research lab at your university
Purchasing data from vendors:
Some vendors also help annotate and label data, such as Figure Eight and Scale AI.
Your workplace or academic institution will usually help cover the costs, as the prices are typically too high to be worth it for individual side projects.
Creating synthetic data through simulations
Creating your own raw data, such as taking your own photos, crowdsourcing data, or using art/designs that you create yourself
Introduction to Exploratory Data Analysis
Now that you have acquired the data, it’s time to analyze it. Your primary aim with EDA is to see if the data is sufficient as a starting point or if you need more. Thus, aim to get a high-level overview of the distribution of the data and find any flaws and quirks. Flaws and quirks may include too many missing values, skewed data distributions, or duplicates. EDA also covers general traits of each feature, looking at the means, distributions, and so on. If you find flaws, there are ways you can resolve the issues later during data cleaning and feature engineering; what is important during EDA is simply to be aware of potential issues.
Tip
For ML and data practitioners, it is important to have some domain knowledge. In my side projects on video-game pricing, I was well aware of industry dynamics and customer behaviors, being an avid gamer myself. At work, I need to learn about each domain to build useful ML models; for example, customers in telecom have different behaviors than those in fintech.
My common approach is to run ydata-profiling, formerly known as pandas-profiling, and start drilling down from the generated report (an example report is shown in Figure 4-1). Note that this is merely a starting point, and using domain knowledge to suss out patterns or abnormalities will be important. What might be an issue for some industries and models might be expected in others. For example, in the case of a RecSys problem, it is more common to have sparser data than in a time-series dataset. Simply looking at generated stats isn’t enough. Also, some domains have algorithms that take care of common issues for that domain, and those issues are thus less cause for alarm.
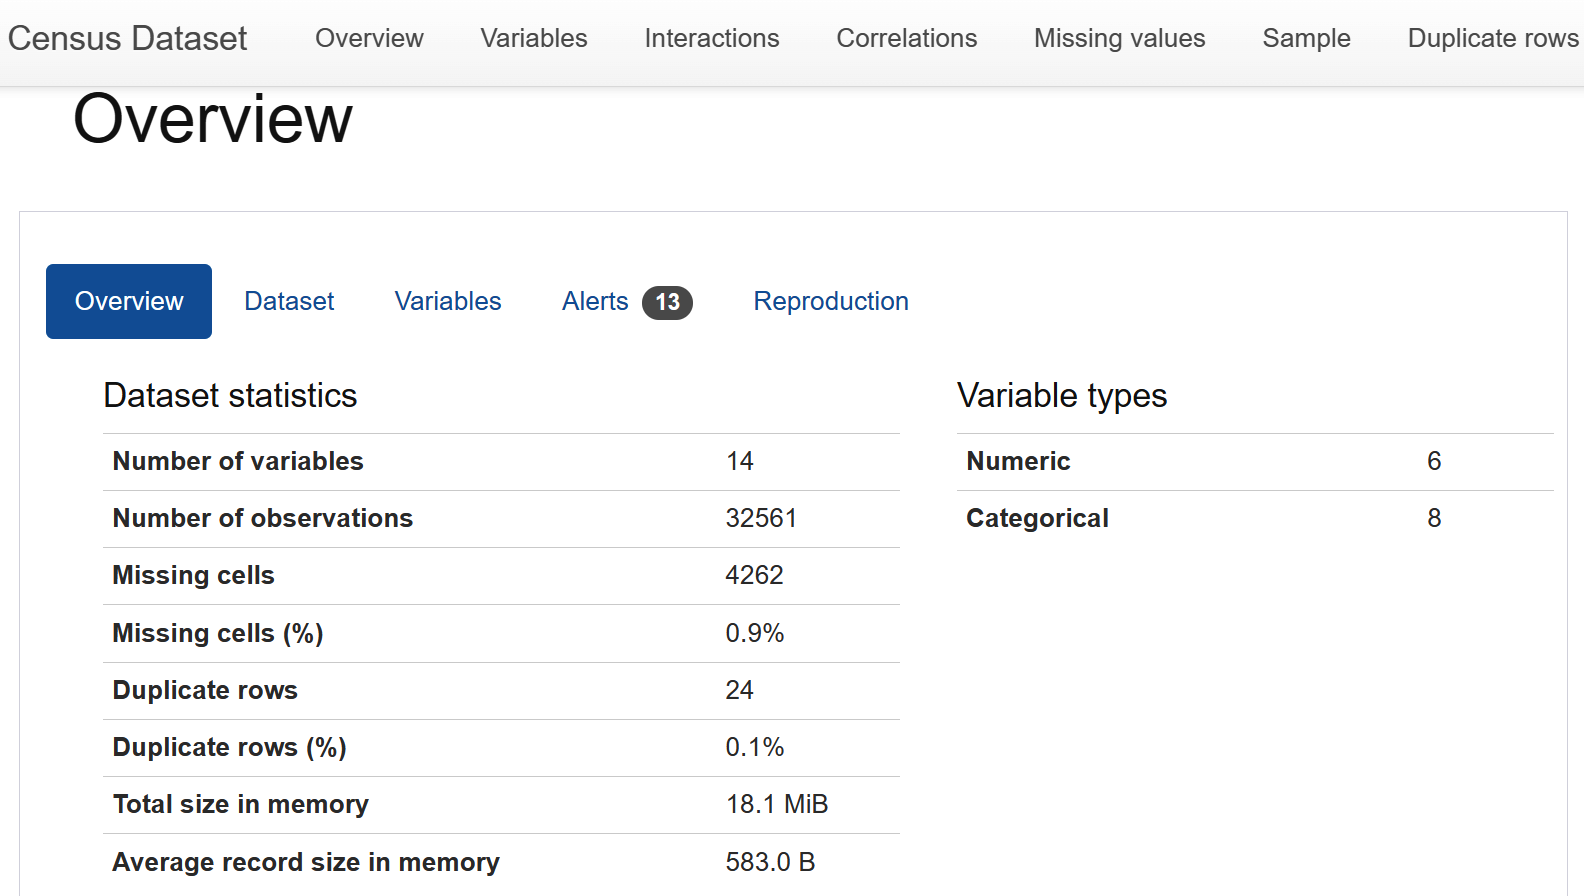
Figure 4-1. Screenshot of ydata-profiling; source: ydata-profiling documentation.
More details on EDA are out of scope for this book, but I recommend reading Making Sense of Data by Glenn J. Myatt and Wayne P. Johnson (Wiley) for more information.
After some iterations, let’s say that you’ve completed the EDA, coming to a decision point: the data seems sound enough (for now) to continue, or you might need to acquire more data or another dataset first; rinse and repeat.
Tip
When interviewers ask what you’d do when you begin with an ML problem, they are expecting to hear you mention EDA at some point early in the process, after you’ve acquired some data source(s). It’s important to show that you’re able to look critically at the data and even find flaws, not just take in a precleaned dataset.
Introduction to Feature Engineering
After exploration of the data, iterating until there is a good starting point for model training, it’s time for feature engineering. In ML, features refer to inputs to ML models. The goal is to make modifications to the dataset to ensure compatibility with the ML models, but also to handle any observed flaws or incompleteness in the data, such as missing values. The topics I discuss here include handling missing data, handling duplicate data, standardizing data, and preprocessing data.
Note
Some of the techniques overlap with what is commonly referred to as “data cleaning,” which can happen in more stages of the ML lifecycle than feature engineering, but is useful to introduce here.
Handling missing data with imputation
There are common imputation techniques for handling missing data that you should be able to mention in an interview, along with their pros and cons. These include filling in with the mean or median value and using a tree-based model.
Table 4-1 lists some things to keep in mind when filling in missing values.
| Technique | Pros | Cons |
|---|---|---|
| Mean/median/mode | Simple to implement | Might not account for outliers compared to tree-based methods Not as suitable for categorical variables |
| Tree-based models | Can capture more underlying patterns Suitable for both numerical and categorical variables |
Adds a level of complexity during data preprocessing Model needs to be retrained if the underlying distribution of data changes |
Handling duplicate data
There are just about an infinite number of ways that observations can be duplicated by accident, so this is one of the issues to discover when conducting EDA:
Data ingestion jobs might run twice due to error.
While doing some complicated joins, some rows could have been unintentionally duplicated and then not discovered.
Some edge cases can cause the data source to provide duplicated data.
… and so on.
If you encounter duplicated data, you can use SQL or Python to deduplicate the data, and make sure the records are represented in a format that’s easier for you to access and use later down the road.
Standardizing data
After you handle missing and duplicate data, the data should be standardized. This includes handling outliers, scaling features, and ensuring that data types and formats are consistent:
- Handle outliers
Techniques for handling outliers include removing extreme outliers from the dataset, replacing them with less extreme values (known as winsorizing) and logarithmic scale transforms. I’d caution against removing outliers since doing so really depends on domain knowledge; in some domains, there are more severe consequences; for example, removing horse-carriage image data from a self-driving car training dataset just because they aren’t a common type of vehicle might cause the model to not recognize horse-carriages in the real world. Hence, carefully evaluate the impacts before deciding on a particular technique.
- Scale features
For datasets with multiple features with numerical values, larger values might be misconstrued by ML algorithms to have more impact. For example, one column is price, which ranges from $50 to $5,000, while another feature is the amount of time an ad shows up, which ranges from 0 to 10 times. The two features are in different units, but both are numerical, so it is possible that the price column will be represented as having a higher magnitude of impact. Some models, such as gradient-descent-based models, are more sensitive to the scale of features. Hence, it’s better to scale the features so that they range from [-1, 1] or [0, 1].
Warning
Be careful when scaling features. It is useful to combine different techniques or to use what you found while conducting EDA. For example, a feature might have extreme outliers, such as most of them being in the range [0, 100], except one observation of 1000. Without checking, you might scale the feature values based on the min of 0 and max of 1000. This may cause the information contained in the features to be compressed.
- Data type consistency
I was once working on an ML model and got results that weren’t what I expected, and it took me a while to debug. Finally, I identified the issue: a numerical column was formatted as a string! Surveying your final data types to ensure that they will make sense once fed into your ML model will be useful before you go through the rest of the process; consider it a part of quality assurance (QA).
Tip
An interviewer may ask follow-up questions about how exactly you have handled outliers, feature scale, or datatype consistency, so be sure to brush up on the rationale and trade-offs of each approach.
Data preprocessing
Preprocessing data will allow for features to make sense to the ML model in the context of the type of algorithm you’re using. Preprocessing for structured data can include one-hot encoding, label encoding, binning, feature selection, and so on.
Tip
Unstructured data is “information that is not arranged according to a preset data model or schema, and therefore cannot be stored in a traditional relational database or RDBMS (relational database management system). Text and multimedia are two common types of unstructured content.”3 When you encounter unstructured data, the preprocessing may be different (potentially even transforming the data to become structured). For illustration purposes, I focus on examples of preprocessing structured data in this chapter.
One-hot encoding of categorical data
You may want to represent categorical data as numerical data. Each category becomes a feature, with 0 or 1 representing the state of that feature in each observation. For example, imagine a simple weather dataset where it’s only possible to have sunny or cloudy weather. You would have the following:
- March 1
-
Weather: Sunny
Temperature (Celsius): 27
- March 2
-
Weather: Sunny
Temperature (Celsius): 25
- March 3
-
Weather: Cloudy
Temperature (Celsius): 20
But the “Weather” feature can be one-hot encoded to have features with all the possible weather states:
- March 1
-
Sunny: 1
Cloudy: 0
- March 2
-
Sunny: 1
Cloudy: 0
- March 3
-
Sunny: 0
Cloudy: 1
One-hot encoding is often used because numbers are easier for ML algorithms to understand; some algorithms don’t take in categorical values, but this has improved over the years, where some implementations can take categorical values into account and transform them behind the scenes.
One downside of one-hot encoding is that for features originally with high cardinality (there are lots of unique values in that feature), one-hot encoding can cause the feature count to increase drastically, which can be computationally more expensive.
Tip
Sometimes, lack of domain knowledge or understanding of business logic might cause issues in data preprocessing. An example is defining churned users as those who canceled a product within the last seven days, but the product or business logic actually counts churned users as those who left within the last 60 days. (If for some reason, the business logic doesn’t work well for ML, we can then discuss a middle ground.)
Label encoding
Label encoding maps the categories to numbers but keeps them in the same feature. For example, types of weather can be mapped to unique numbers, as illustrated in Figure 4-2.
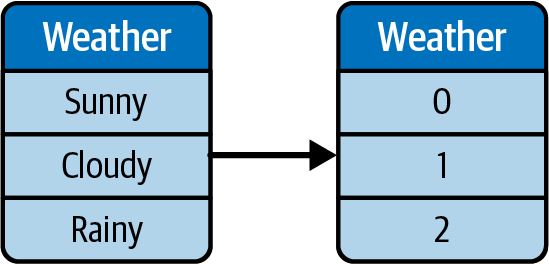
Figure 4-2. Label encoding illustration.
One of the downsides of label encoding is that some ML algorithms can conflate the scale and values to mean a higher magnitude of impact. To use our previous example, Weather can be label encoded: Sunny becomes 0, and Cloudy becomes 1. But to ML, this could conflate cloudy as a higher magnitude since 1 is greater than 0.
Thankfully, in many ML algorithms you can use built-in classes (e.g., scikit-learn’s LabelEncoder class) so that the algorithm will know behind the scenes that this is just a categorization and not necessarily indicative of magnitude.
Tip
Of course, if you forget to let the algorithm know that label-encoded features are, in fact, label encoded, then the ML algorithm will likely treat that feature like a normal numerical feature. You can see how this can cause issues if you didn’t address this during interview questions.
Binning for numerical values
Binning can reduce the amount of cardinality and help models generalize more. For example, if the dataset has a price of $100, it might not generalize the first time it sees $95, even if in the particular application, $95 is similar to $100. As an illustration, you can define the bin edges as [15, 25, 35, 45, 55, 65, 75, 85, 99], which will create similar price ranges like “$15–$25,” “$25–$35,” “$35–$45,” and so on.
A downside of binning is that it introduces hard edges into the meanings of the bins, such that an observation of $46 would be seen as completely different from the bin “$35–$45,” even though it might still be similar.
Feature selection
Sometimes, your dataset will have features that are highly correlated—that is, there is collinearity between features. As an extreme example, you might have height in centimeters but also height in meters, which essentially capture the same information. There may be other features that capture a high proportion of the same information as well, and removing them might reduce accidentally overfitting or improve model speed because the model doesn’t need to handle as many features. Dimensionality reduction is a common technique for feature selection; it reduces the dimensionality of the data while retaining the most important information.
You might also use feature importance tables, such as those provided in XGBoost or CatBoost, and prune the features with the lowest importance—that is, the lowest contribution to the model.
Sample Interview Questions on Data Preprocessing and Feature Engineering
Now that I’ve covered some basics of data preprocessing and feature engineering, let’s go through some example interview questions.
Interview question 4-1: What’s the difference between feature engineering and feature selection?
- Example answer
Feature engineering is about creating or transforming features from raw data. This is done to better represent the data and make the data more suitable for ML compared to its raw format. Common techniques include handling missing data, standardizing data formats, and so on.
Feature selection is about narrowing down relevant ML features to simplify the model and prevent overfitting. Common techniques include PCA (principal component analysis) or using tree-based models’ feature importance to see which features contribute more useful signals.
Interview question 4-2: How do you prevent data leakage issues while conducting data preprocessing?
- Example answer
Being cautious with training, validation, and test data splits is one of the most common ways to prevent data leakage. However, things aren’t always so simple. For example, in the case when data imputation is done with the mean value of all observations in the feature, that means the mean value contains information about all observations, not just the training split. In that case, make sure to conduct data imputation with only information about the training split, on the training split. Other examples of data leakage could include time-series splits; we should be careful that we don’t accidentally shuffle and split the time series incorrectly (e.g., using tomorrow to predict today instead of the other way around).
Interview question 4-3: How do you handle a skewed data distribution during feature engineering, assuming that the minority data class is required for the machine learning problem?
- Example answer
Sampling techniques,4 such as oversampling the minority data classes, could help during preprocessing and feature engineering (for example, using techniques like SMOTE). It’s important to note that for oversampling, any duplicate or synthetic instances should be generated only from the training data to avoid data leakage with the validation or test set.
The Model Training Process
Now that you have data ready for ML, it’s time to move on to the next step: model training. This process includes the steps of defining the ML task, selecting the most suitable ML algorithms for the task, and actually training the model. In this section, I will also provide common interview questions and tips that will help you succeed.
The Iteration Process in Model Training
At the outset of an ML project, you likely thought about what you wanted the general result to be, such as “getting the highest accuracy possible on a Kaggle competition” or “using this data to predict video game sales prices.” You might have also started researching some algorithms that are good at the task, such as time-series predictions. Determining what that final ML task will be is (often) an iterative process in which you may go back and forth between steps before you land on something, as illustrated in Figure 4-3.
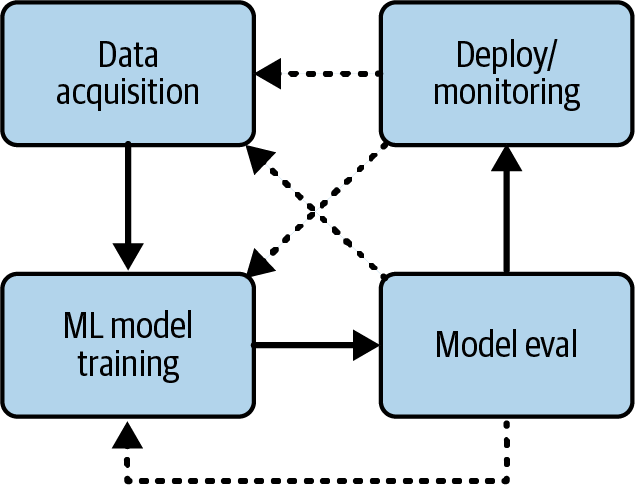
Figure 4-3. Example iteration process during ML training.
For example, let’s take a look at all the steps in a project to predict video game sales:
Define the ML task, model selection. You might start with an idea: use time-series data with ARIMA (AutoRegressive Integrated Moving Average), because the problem seems simple—price prediction often uses time-series data.
Data acquisition. You might acquire a dataset with time-series data—that is, it only has the time, such as a date or timestamp, and the price. The future price is the output of the model predictions, and the historical prices are the inputs.
However, you may run into a situation where using ARIMA doesn’t seem to be working out, and you troubleshoot by analyzing the source data more closely. It turns out that you’re combining data of the games from large companies (also known as “AAA” games) with smaller games from independent studios (also known as “indie” games). AAA games often have large budgets for marketing and promotion, so on average, they sell more than indie games.
Define the ML task (again). The next step is to reevaluate the ML task. After some thought, you decide to still predict the time series, thus keeping the ML task the same.
Data acquisition (again). This time, though, you already know what you may need to do differently so that the results will be better. Thus, you acquire more data: whether a game is AAA or indie. You might even end up hand labeling it.
Model selection (again). Now you realize the model needs to change since ARIMA doesn’t take categorical variables such as the labels “Indie” and “AAA.” Thus, you look online and find other algorithms that can mix categorical variables with numerical variables, and you try one of those.
Continue to iterate the previous steps until good enough. You might rinse and repeat if that still doesn’t work well, acquiring more types of features, trying different models, or doing feature engineering like one-hot encoding. The ML task could change along the way as well: instead of predicting the exact sales numbers, you might opt to predict the bins, such as (high, mid, low) sales, with high sales being above 50,000 units or something you’ve defined through EDA.
If you’ve done a project from end to end, you know the iterative nature of the steps described in this section. You may notice that in this example, you can clearly see what led you to go back to data acquisition and what then led you to go back to defining the ML task. There’s always a reason, even if the reason is just to see if the new approach works better than your current approach. This gives you a lot of interesting information to provide in response to your interviewer’s questions.
Interviewers will want to make sure of the following:
You are knowledgeable about common ML tasks in their field.
You are knowledgeable about common algorithms related to said tasks.
You know how to evaluate those models.
Defining the ML Task
In the previous section, you saw how the steps from data acquisition to model training are often iterative and that explaining the rationale for each of your iterations will help in your interview answers.
To select the ML model, you need to define the ML task. To figure this out, you can ask yourself what algorithm to use and what task(s) is associated with the algorithm. For example, is it classification or regression?
There is no prescriptive method to tell you the correct algorithms, but generally you’d want to know:
Do you have enough data?
Are you predicting a quantity/numerical value or a category/categorical value?
Do you have labeled data (i.e., you know the ground truth labels)? This could determine if supervised learning or unsupervised learning is better for the task.
Tasks could include regression, classification, anomaly detection, recommender systems, reinforcement learning, natural language processing, generative AI, and so on, all of which you read about in Chapter 3. A simplified overview of selecting the ML task is illustrated in Figure 4-4. Knowing the goal and the data that you have available (or plan to acquire) can help you initially select tasks. For example, different types of ML tasks are better suited depending on the labeled data that is available or if the target variable is continuous or categorical.
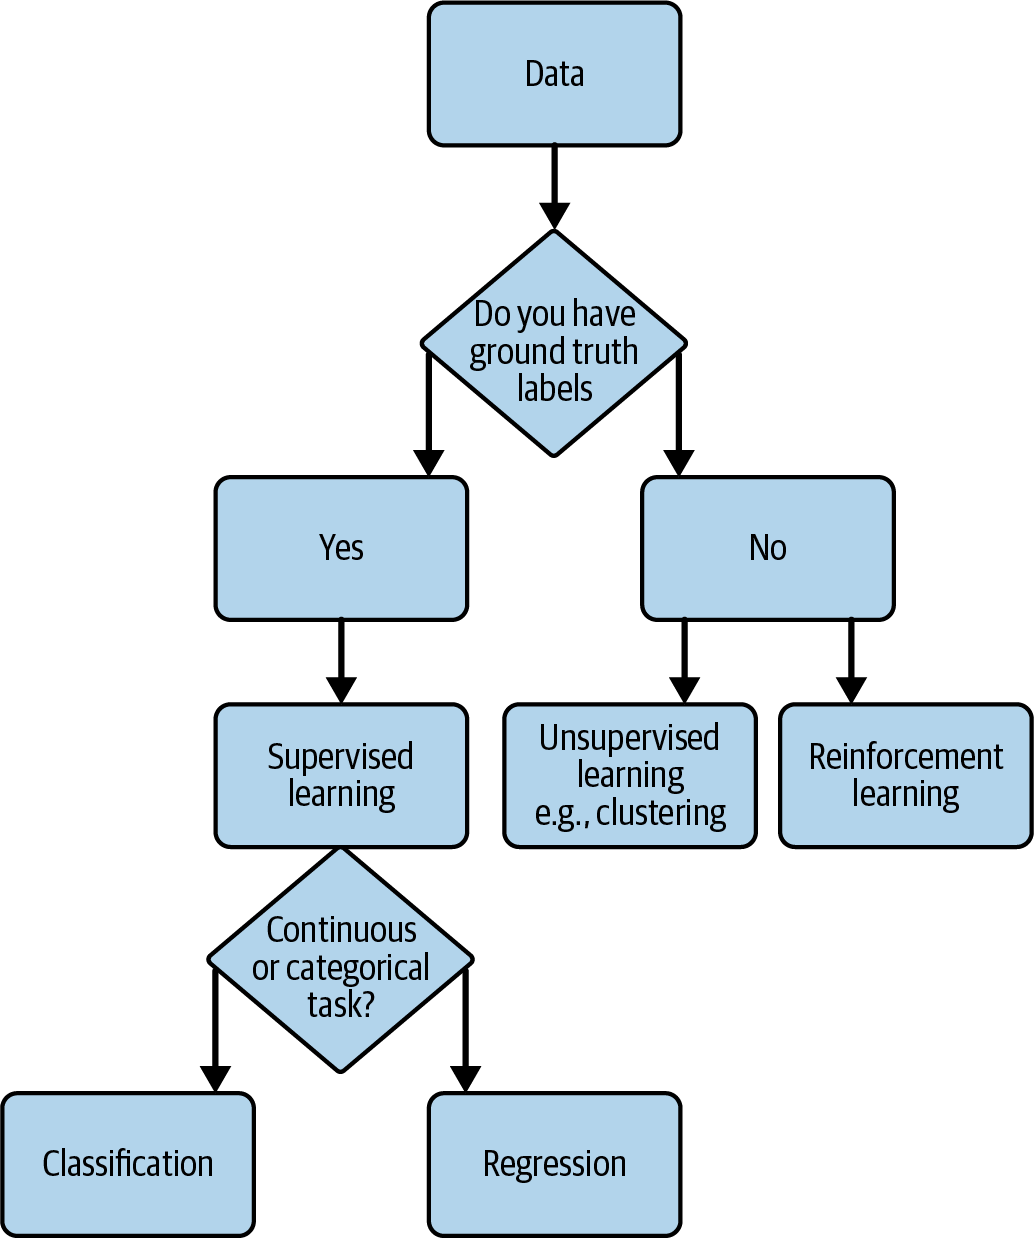
Figure 4-4. Simplified flowchart of ML task selection.
Overview of Model Selection
Now that you have an idea of the ML task, let’s move on to model selection. Remember that this is an iterative process, so you might not decide this in one go. However, you do need to select a model (or a few) as a starting point. In interviews, you will be asked about why you selected such and such algorithm(s) or model(s), and just going off gut feeling won’t be enough for a successful answer. As you saw in Figure 4-4, you already have a place to start from based on the ML task(s) that you defined. So let’s dig deeper into some common algorithms and libraries (mostly in Python) that you can use to implement the task.
I want to make a quick clarification on terminology: when you are selecting an algorithm initially, that isn’t technically model selection until you test it out and compare the performance of the resulting model. This term is often used interchangeably since you inevitably want to make the final decision based on actual model performance. As Jason Brownlee puts it in Machine Learning Mastery: “Model selection is a process that can be applied both across different types of models (e.g., logistic regression, SVM, KNN, etc.) and across models of the same type configured with different model hyperparameters (e.g., different kernels in an SVM).”5
Here are some algorithms and libraries that can be used as simple starting points for each task. Note that many libraries are versatile and can be used for multiple purposes (e.g., decision trees can be used for both classification and regression), but I list some simplified examples for understanding:
- Classification
Algorithms include decision trees, random forest, and the like. Example Python libraries to start with include scikit-learn, CatBoost, and LightGBM.
- Regression
Algorithms include logistic regression, decision trees, and the like. Example Python libraries to start with are scikit-learn and statsmodels.
- Clustering (unsupervised learning)
Algorithms include k-means clustering, DBSCAN, and the like. An example Python library to start with is scikit-learn.
- Time-series prediction
Algorithms include ARIMA, LSTM, and the like. Example Python libraries to start with include statsmodels, Prophet, Keras/TensorFlow, and so on.
- Recommender systems
Algorithms include matrix factorization techniques such as collaborative filtering. Example libraries and tools to start with include Spark’s MLlib or Amazon Personalize on AWS.
- Reinforcement learning
Algorithms include multiarmed bandit, Q-learning, and policy gradient. Example libraries to start with include Vowpal Wabbit, TorchRL (PyTorch), and TensorFlow-RL.
- Computer vision
Deep learning techniques are common starting points for computer vision tasks. OpenCV is an important computer vision library that also supports some ML models. Popular deep learning frameworks include TensorFlow, Keras, PyTorch, and Caffe.
- Natural language processing
All the deep learning frameworks mentioned before can also be used for NLP. In addition, it’s common to try out transformer-based methods or find something on Hugging Face. Nowadays, using the OpenAI API and GPT models is also common. LangChain is a fast-growing library for NLP workflows. There is also Google’s recently launched Bard.
Overview of Model Training
Now that you’ve gone through the steps of defining the ML task and selecting an algorithm, you will start the process of model training, which includes hyperparameter tuning and optimizer or loss function tuning, if applicable. The goal of this step is to see the model get better and better by changing the parameters of the model itself. Sometimes, this won’t work out, and you’ll need to go back to the earlier stages to improve the model via the input data. This section focuses on tuning the model itself but not the data.
In interviews, it is more interesting to the employer to hear how you increased your model performance, rather than just that you got a high-performing model. In some cases, even having a low-performing model in the end can still demonstrate your suitability for the role if you were very thoughtful about your ML training process even when other factors were out of your control, such as data acquisition. In other cases, having a high-accuracy model doesn’t matter to the interviewer so much if you haven’t deployed it; it’s common to see models perform well in the training phase and offline evaluation but then do poorly in production or live scenarios.
Hyperparameter tuning
Hyperparameter tuning is where you select the optimal hyperparameters for the model via manual tweaks, grid search, or even AutoML. Hyperparameters include traits or architecture of the model itself, such as learning rate, batch size, the number of hidden layers in a neural network, and so on. Each specific model might have its own parameters, such as changepoint and seasonality prior scale in Prophet. The goal of hyperparameter tuning is, for example, to see if the learning rate is higher or if the model will converge faster and perform better.
It is important to have a good system to keep track of hyperparameter-tuning experiments so that the experiments can be reproducible. Imagine the pain if you saw a model run that yielded great results, but because the edits were made directly to the script, you lost the exact changes and weren’t able to reproduce the good results! Tracking will be discussed more in “Experiment tracking”.
ML loss functions
Loss functions in ML measure the difference between the model’s predicted outputs and the ground truth. A goal of the model is to minimize the loss function since by doing so, the model is making the most accurate predictions based on your definition of accuracy in the model. Examples of ML loss functions include mean squared error (MSE) and mean absolute error (MAE).
ML optimizers
Optimizers are how the ML model’s parameters are adjusted to minimize the loss function. Sometimes, there are options to change the optimizer; for example, PyTorch has 13 common optimizers to select from. Adam and Adagrad are popular optimizers, and it’s likely the model’s hyperparameters themselves are tuned to improve performance. This could be an additional lever to pull, depending on the structure of your model and any hypothesized reasons why your current optimizer isn’t working out.
Experiment tracking
While conducting hyperparameter tuning, you’ll need to keep track of the performance of each iteration of the model. You won’t be able to figure out which set of parameters performs better if you don’t have the records of past parameters to compare to.
A company you interview with might have tools for ML experiment tracking. Generally, it doesn’t matter if you have experience with the specific tool the company is using as long as you are aware of experiment tracking. I’ve tracked experiments with Microsoft Excel before, and so have many other practitioners. It is becoming more common, though, to use a centralized experiment-tracking platform. Examples include MLflow, TensorBoard, Weights & Biases, and Keras Tuner. There are many more, such as Kubeflow, DVC, Comet ML, and so on. For the interview, it is highly unlikely that it matters which exact ones you have experience in, as long as you are aware that you should be tracking the results somehow in a centralized location.
Additional resource for model training
Google has a Google Machine Learning Education site (free at the time of writing) for those who are interested in a more detailed overview; start with the Machine Learning Crash Course (focused on ML and TensorFlow and runnable on Google Colab).
Sample Interview Questions on Model Selection and Training
Now that we’ve reviewed common considerations during model training, let’s look at some example interview questions.
Interview question 4-4: In what scenario would you use a reinforcement learning algorithm rather than, say, a tree-based method?
- Example answer
RL algorithms are useful when it’s important to learn from trial and error and the sequence of actions is important. RL is also useful when the outcome can be delayed but we want the RL agent to be continuously improving. Examples include game playing, robotics, recommender systems, and so on.
In contrast, tree-based methods, such as decision trees or random forests, are useful when the problem is static and nonsequential. In other words, it’s not as useful to account for delayed rewards or sequential decision making, and a static dataset (at the time of training) is sufficient.
Interview question 4-5: What are some common mistakes made during model training, and how would you avoid them?
- Example answer
Overfitting is a common problem, when the resulting model captures overly complex information in the training data and doesn’t generalize well to new observations. Regularization techniques6 can be used to prevent overfitting.
Not tuning common hyperparameters could cause models to not perform well since the default hyperparameters might (often) not work directly out of the box to be the best solution.
Overengineering the problem could also cause issues during model training; sometimes it’s best to try out a simple baseline model before jumping right into very complex models or combinations of models.
Interview question 4-6: In what scenario might ensemble models be useful?
- Example answer
When working with imbalanced datasets, where one class significantly outnumbers the others, ensemble methods can help improve the accuracy of results on minority data classes. By using ensemble models and combining multiple models, we can avoid and reduce model bias toward the majority data class.
Model Evaluation
Now that you’re training your model, it’s time to evaluate it and determine if you should continue iterating on it or conclude that it’s good enough. As an aside, often the business metric will and should be decided before starting the ML modeling. Business metrics include increasing click-through rate, improving the conversion rate of customers, or achieving higher satisfaction as measured by customer surveys. These metrics are not the same as the ML model metrics mentioned in this section; rather, they are used to see if the model performs well on the test dataset after being trained on the training dataset and evaluated with the evaluation dataset.
Interviewers are looking for knowledge on common ways to evaluate models in the field. For example, time-series interview questions might expect you to know about mean absolute error (MAE), root mean square error (RMSE), and similar evaluation metrics, which were part of one of my interviews for a role in fintech. You’ll likely also discuss trade-offs between false positives and false negatives, a big part of what I encountered when I interviewed for my job in security machine learning. Other common expectations are knowing the variance bias trade-off and how to measure it, or accuracy versus precision and recall.
Summary of Common ML Evaluation Metrics
Here are some common metrics used for evaluating ML models. The metrics you’ll choose depend on the ML task.
Note that I won’t define all the terms in this book at the risk of it turning into a statistics textbook, but I will define and illustrate the most common ones. Additional resources are included if you want to understand the rest of the metrics in depth.
Classification metrics
Classification metrics are used to measure the performance of classification models. As a shorthand, note that TP = true positive, TN = true negative, FP = false positive, and FN = false negative, as illustrated in Figure 4-5. Here are some other terms and values to know:
Precision = TP / (TP + FP) (as illustrated in Figure 4-6)
Recall = TP / (TP + FN) (as illustrated in Figure 4-6)
Accuracy = (TP + TN) / (TP + TN + FP + FN)
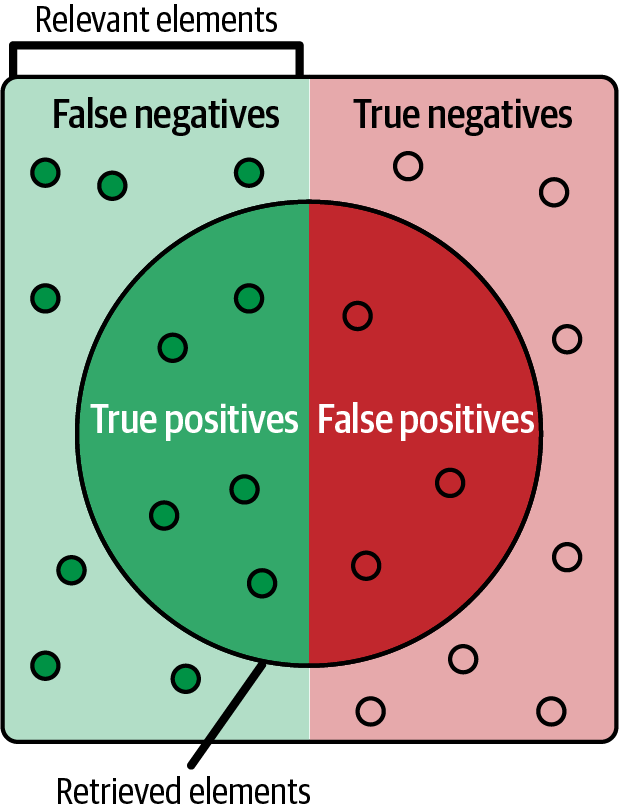
Figure 4-5. Illustration of true positives, false positives, false negatives, and true negatives; source: Walber, CC BY-SA 4.0, Wikimedia Commons.
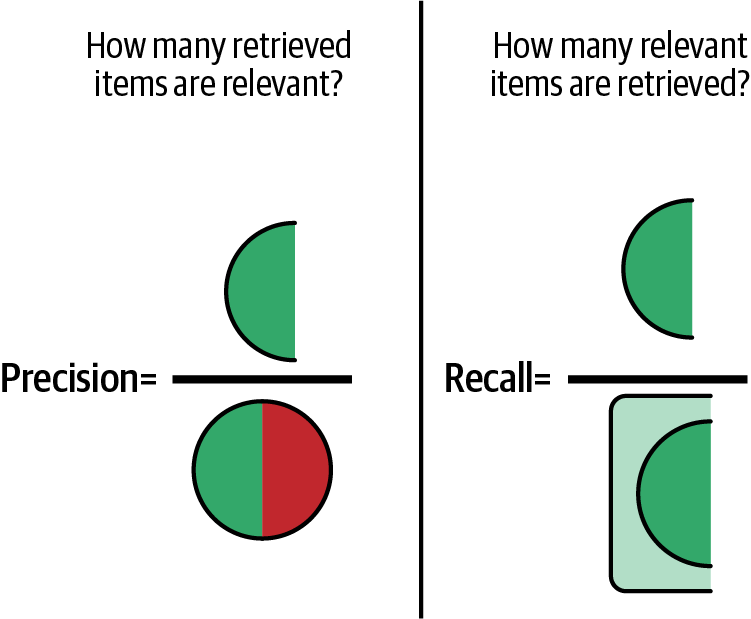
Figure 4-6. Illustration of precision versus recall.
With these terms, we can then construct various evaluations:
- Confusion matrix
A summary of the TP/TN/FP/FN values in matrix form (as illustrated in Figure 4-7).
- F1 score
Harmonic mean of precision and recall.
- AUC (area under the ROC curve) and ROC (receiver operating characteristic)
The curve plots the true positive rate against the false positive rate at various thresholds.
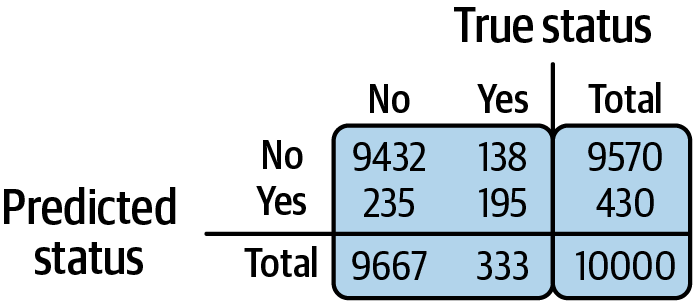
Figure 4-7. Confusion matrix example.
Clustering metrics
Clustering metrics are used to measure the performance of clustering models. Using clustering metrics may depend on whether you have ground truth labels or not. Here I assume you do not, but if you do, then classification metrics can also be used. Here is a list of terms to be aware of:
- Silhouette coefficient
Measures the cohesion of an item to other items in its cluster and separation with items in other clusters; ranges from -1 to 1
- Calinski-Harabasz Index
A score meant to determine the quality of clusters; when the score is higher, it means clusters are dense and well separated
Ranking metrics
Ranking metrics are used for recommender or ranking systems. Here are some terms to be aware of:
- Mean reciprocal rank (MRR)
Measures the accuracy of a ranking system by how high or low the first relevant document appears
- Precision at K
Calculates the proportion of recommended items at the top that are relevant
- Normalized discounted cumulative gain (NDCG)
Compares the importance/rank that the ML model predicted to the actual relevance
Now that you’ve decided on the metrics (and sometimes you’ll want to use a few), you’ll need to implement them with code. In common ML libraries in Python, there are already implementations of most of the metrics mentioned, so you don’t have to implement them from scratch yourself. The following metrics implementations are good starting points:
This list is not exhaustive, so take a look in the documentation of the library you are using. If the built-in implementations don’t fit your specific needs for some reason, then you can write something custom. If this comes up in the interview, it’s best to explain why. For example, if you wanted to mix and match a few different metrics from different libraries, you might have had to write some code to connect them all and aggregate them.
Trade-offs in Evaluation Metrics
For interviewers, it is important for you to demonstrate that you can think critically about ML evaluation metrics and various trade-offs. For example, using accuracy alone can hide a model’s flaws with its predictions on a minority class (a category that has very few data points compared to the majority class) if the model is simply very good with prediction on the majority class. In that case, it would be good to supplement with more metrics, such as F1 score. However, at times you need to explicitly make a trade-off.
For example, in a medical model that predicts lung cancer from X-ray scan images, false negatives will have a very high impact. Hence, reducing false negatives is desirable. When false negatives are reduced, the recall metric is increased (see the previous section for a definition). But in some situations, on the way to reducing false negatives, the model may have accidentally learned to classify more patients as positive even if they do not have lung cancer. In other words, false positives have increased as an indirect result and decreased the model’s precision.
Thus, it is important to decide on trade-offs between false positives and false negatives; in some cases, the juice could be worth the squeeze, and sometimes, it might not be. It will be helpful if you can discuss trade-offs like this when you answer interview questions.
Tip
The interviewer can tell from your thoughtful answers that you can think critically about biases in the models and can select appropriate models and metrics, which makes you a more effective ML practitioner.
Additional Methods for Offline Evaluation
Using the model metrics I previously outlined, you can measure how effective the model has become at predicting previously unseen labels as compared to ground truth labels that were hidden from the model. Hopefully, you’ve experimented with a few tweaks to get here; even if your first model ended up being the best-performing one as measured by metrics, it’s worth it to see what’s not working. Your interviewer might ask about it, too!
Before the model is deployed, though, it’s difficult to confirm that the model will indeed perform well live, in production. In this case, “live” means it’s out in the world, similar to being “live on air.” Production refers to software systems running with real inputs and outputs. There are many reasons why the model might perform poorly in production despite doing well on model metrics: data distribution in the real world is sometimes not captured by the training data, and there are edge cases and outliers, and so on.
These days, many employers look for experience with understanding how models might behave in production. This is different from a school or academic perspective because with real inputs, models behaving poorly will cause real losses to a business. For example, a poor fraud-detection model could cost a bank millions. A recommender system that keeps surfacing irrelevant or inappropriate content could cause customers to lose trust in a company. In some cases, the company could be sued. Your interviewers will be keen to see if this is something you are aware of and if you have given thought to how to prevent scenarios like these.
On the other hand, it’s quite fulfilling to work in ML knowing that if the model is successful, it could be part of preventing losses of millions from fraud or could be working behind the scenes of your favorite music streaming app!
You can further evaluate the models before they go live in production and gauge if the models are indeed robust and can generalize to new data. Methods to do this include:
- Perturbation tests7
Introduce some noise or transform the test data. For example, for images, see if randomly adding some pixels will cause the model to be unable to predict the correct result.
- Invariance tests
Test if an ML model performs consistently in different conditions. For example, removing or changing certain inputs shouldn’t lead to drastic changes in the output. If you remove one feature completely and the model makes different predictions, then you should consider investigating that feature. This is especially important if that feature is, or is related to, sensitive information, such as race or demographics.
- Slice-based evaluation
Test your model performance on various slices, or subgroups, of the test split. For example, your model might be performing well overall on metrics like accuracy and F1, but when you investigate, it is performing poorly on people over the age of 35 and people under the age of 15. This will be important to investigate and iterate on, especially if you’ve overlooked some groups while training.
For more on these evaluation techniques, please see Designing Machine Learning Systems by Chip Huyen (O’Reilly).
Model Versioning
The goal of model evaluation is to see whether a model is performing well enough, or if it’s performing better than the baseline or another ML model. After each model training, you will have various model artifacts, such as the model definition, model parameters, data snapshot, and so on. When you want to pick out the model that has been performing well, it’s more convenient if the output model artifacts can be easily retrieved. Having model versioning is more convenient than running the entire model training pipeline to regenerate the model artifacts, even if you know the specific hyperparameters that led to said model.
The tools used for experiment tracking (listed in “Experiment tracking” earlier in this chapter) often support model versioning as well.
Sample Interview Questions on Model Evaluation
Now that we’ve gone through common techniques and considerations for model evaluation, let’s look at some example interview questions.
Interview question 4-7: What is the ROC metric, and when is it useful?
- Example answer
The ROC (receiver operating characteristic) curve can be used to evaluate a binary classification model. The curve plots the true positive rate against the false positive rate at various thresholds—the threshold being the probability between 0 and 1, above which the prediction is considered to be that class. For example, if the threshold is set to 0.6, then the probability predictions of the model that are above 0.6 probability of being class 1 will be labeled as class 1.
Using ROC can help us determine the trade-off in the true positive rate and the false positive rate at various thresholds, and we can then decide what is the optimal threshold to use.
Interview question 4-8: What is the difference between precision and recall; when would you use one over the other in a classification task?
- Example answer
Precision measures the accuracy of the model at making correct predictions (quality), and recall measures the model’s accuracy in terms of how many relevant items are predicted correctly (quantity). Mathematically, precision is TP / (TP + FP) while recall is TP / (TP + FN).
Precision can be more important than recall when it is more critical to reduce FPs and keep them low. One example is malware detection or email spam detection, where too many false positives can lead to user distrust. FPs in email spam detection can move legitimate business emails to the spam folder, causing delays and loss of business.
On the other hand, recall can be more important than precision in high-stakes predictions such as medical diagnostics. Increased recall means that there are fewer false negatives, even if that potentially causes some accidental FPs. In this situation, it’s a higher priority to minimize the chances of missing true cases.
Interview question 4-9: What is the NDCG (normalized discounted cumulative gain), explained on a high level? What type of ML task is it used for?
- Example answer
NDCG is used to measure the quality of ranking tasks, such as recommender systems, information retrieval, and search engines/applications. It compares the importance/rank that the ML model predicted to the actual relevance. If the model’s predictions differ a lot from the actual (or ideal) relevance, such as showing products at the top of a shopping website that the customer isn’t interested in, then the score will be lower. NDCG is calculated via the sum of the predicted relevance scores (DCG, or discounted cumulative gain) divided by the IDCG (ideal discounted cumulative gain). This is then normalized so that the result is between 0 and 1.
Summary
In this chapter, I walked through an overview of the ML modeling and training process and how each step relates to the ML interview. First, you defined the ML task and acquired suitable data. Next, you selected the model based on which algorithms were suitable for the task as a starting point. You also selected a baseline model, starting with something simple to compare any further ML models against, such as a heuristic-based method or an as-simple-as-possible model like logistic regression.
In all these steps, it’s important to note in an interview how you iterated on the process to make the model better, which could even involve going back to a previous step, such as data acquisition. While answering interview questions about your experience with ML model training on your own projects, whether that’s a school, personal, or work project, it’s essential to talk about the trade-offs you faced and the reasons why you thought a certain technique would help.
Simply having a highly accurate model (as measured on the test set) isn’t enough, as it matters a lot these days to employers that the ML candidate has exposure to how models might behave in production. If you are applying for an ML role that builds the production pipelines and infrastructure, then it’s even more important. Finally, you reviewed how to evaluate the ML models and select the best one.
In the next chapter, I’ll discuss the next major component of ML technical interviews: coding.
1 Let’s assume that for this project, there exists some public dataset that is well suited for this problem.
2 Keep in mind any licensing, copyright, and privacy issues.
3 “Unstructured Data,” MongoDB, accessed October 24, 2023, https://oreil.ly/3DqzA.
4 Sampling techniques are discussed in Chapter 3.
5 Jason Brownlee, “A Gentle Introduction to Model Selection for Machine Learning,” Machine Learning Mastery (blog), September 26, 2019, https://oreil.ly/2ylZa.
7 This terminology is used in Chip Huyen’s book Designing Machine Learning Systems (O’Reilly), and I use the same terms for this section for convenience since there doesn’t seem to be a unified terminology but more of a high-level grouping.
Get Machine Learning Interviews now with the O’Reilly learning platform.
O’Reilly members experience books, live events, courses curated by job role, and more from O’Reilly and nearly 200 top publishers.

