Chapter 1. How Data Drives Decision Making in Machine Learning
This chapter explores the role of data in the enterprise and its influence on business decision making. You also learn the components of a machine learning (ML) workflow. You may have seen many books, articles, videos, and blogs begin any discussion of the ML workflow with the gathering of data. However, before data is gathered, you need to understand what kind of data to gather. This data understanding can only be achieved by knowing what kind of problem you need to solve or decision you need to make.
Business case/problem definition and data understanding can then be used to formulate a no-code or low-code ML strategy. A no-code or low-code strategic approach to ML projects has several advantages/benefits. As mentioned in the introduction, a no-code AutoML approach enables anyone with domain knowledge in their area of expertise and no coding experience to develop ML models quickly, without needing to write a single line of code. This is a fast and efficient way to develop ML applications. A low-code approach enables those with some coding or deep coding experience, to develop ML applications quickly because basic code is autogenerated—and any additional custom code can be added. But, again, any ML project must begin with defining a goal, use case, or problem.
What Is the Goal or Use Case?
Businesses, educational institutions, government agencies, and practitioners face many decisions that reflect real-world examples of ML. For example:
-
How can we increase patient engagement with our diabetes web app?
-
How can we increase our student feedback numbers on course surveys?
-
How can we increase our speed in detecting cyberattacks against our company networks?
-
Can we decrease the number of spam emails entering our email servers?
-
How do we decrease downtime on our manufacturing production line?
-
How can we increase our customer retention rate?
-
How do we reduce our customer churn (customer attrition) rate?
In each of those examples, numerous data sources must be examined to determine what ML solution is most appropriate to solve the problem or aid in decision making. Let’s take the use case of reducing customer churn or loss rate—using a very simplistic example. Churn prediction is identifying customers that are most likely to leave your service or product. This problem falls into a supervised learning bucket as a classification problem with two classes: the “Churn-Yes” class and the “Churn-No” class.
From a data source perspective, you may need to examine customer profile information (name, address, age, job title, employment statement), purchase information (purchases and billing history), interaction information (customer experiences interacting with your products [both digitally and physically]), your customer service teams, or your digital support services. Popular data sources of customer information are customer relationship management systems, system ecommerce analytics services, and customer feedback. In essence, everything the customer “touches” as a data point should be tracked and captured as a data source.
The nature of the decision you must make is tied directly to the data you will need to gather to make that decision—which needs to be formulated into a problem statement. Let’s say you are in charge of marketing for a company that makes umbrellas, and the business goal is to increase sales. If you reduce the selling price of your existing umbrellas, can you predict how many umbrellas you will sell? Figure 1-1 shows the data elements to consider for this option.
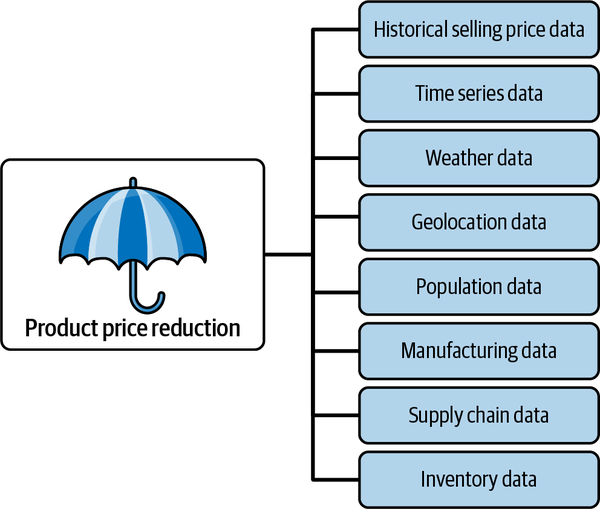
Figure 1-1. Data elements that impact a price reduction strategy to increase sales.
As you can see in this data-driven business illustration, your business goal (to increase sales) takes on a new dimension. You realize now that to understand a product price reduction, you need to include additional data dimensions aside from the selling price. You will need to know the rainy seasons in specific regions, population density, and whether your inventory is sufficient to meet the demand of a price reduction that will increase sales. You will also need to look at historical data versus data that can be captured in real time. Historical data is typically referred to as batch, whereas real-time data capture is typically called streaming. With these added dimensions, the business goal suddenly becomes a very complex problem as these additional columns may be required. For any organization, there could ostensibly exist dozens of discrete data sources—with each source requiring certain skills to understand the relationships between them. Figure 1-2 is an illustration of this challenge.
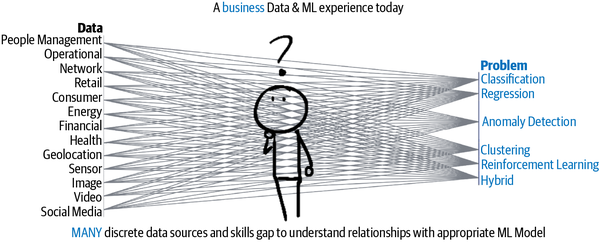
Figure 1-2. A typical business data and ML experience today.
So what is your use case here? It depends. You would need to undergo a business decision-making process, which is the process of making choices by asking questions, collecting data, and assessing alternative resolutions. Once you figure out the use case or business goal, you can use the same data to train machines to learn about your customer patterns, spot trends, and predict outcomes using AutoML or low-code AI. Figure 1-3 shows our umbrella example as a business use case that then leads to data source determination, ML framework, and then a prediction.

Figure 1-3. Business case that leads to predictions using ML framework.
An Enterprise ML Workflow
While decision-making processes help you identify your problem or use case, it is the ML workflow that helps you implement the solution to your problem. This section presents a typical ML workflow. In our ongoing umbrella example, you could use your data to train an ML model using an AutoML service that provides a no-code solution for running unsupervised ML clustering. From there, you could examine clusters of data points to see what patterns were derived. Or, you could decide to simply focus on historical data so that you could predict a specific target based on a certain number of data input features. What would your enterprise ML workflow look like? Not surprisingly, it is data-driven and requires decision making in the process.
The ML workflow can be shown as a series of steps, and the steps can be combined into phases. Figure 1-4 shows the 10 steps, and then we briefly discuss each. Later chapters provide more detailed examples of each step.
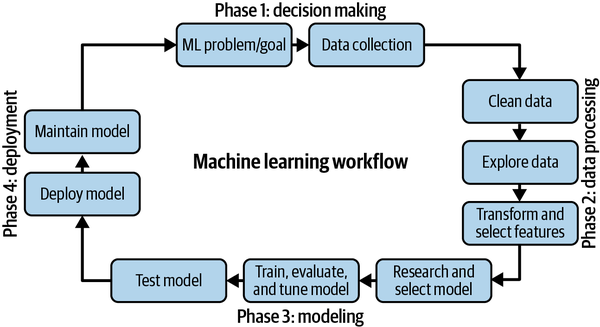
Figure 1-4. Ten-step ML workflow.
>Defining the Business Objective or Problem Statement
The ML workflow starts with defining a specific question or problem with a defined boundary. In this phase you are attempting to define scope and feasibility. The right question will lead you to what data is required and potential ways data must be prepared. It is important to note that any question that may arise in analyzing data can be grouped in one of the five ML categories as shown in Table 1-1. Let’s continue with our umbrella example.
Data Collection
In the early part of the 21st century, companies, universities, and researchers typically relied on local servers/hard drives or data centers to host their database applications and store their data. Relying on on-premises data centers or even renting server space in a data center was costly: server infrastructure needed to be maintained, software needed to be updated, security patches had to be installed, physical hardware was swapped out, and so on. In some cases, large amounts of data were stored across a cluster of machines.
Today, to save on costs, enterprises and educational institutions have moved to the cloud to host their database applications and store their data. Cloud storage, a service offered by cloud vendors to store files, allows you to upload different file formats or can be configured to automatically receive files from different data sources. Because most ML models are trained using data from files, storing your data in a cloud storage bucket makes for easy data collection. Cloud storage buckets can be used for storing both structured and unstructured data.
Another option to store data files for data collection is GitHub, a service designed for collaborating on coding projects. You can store data in the cloud for future use (for free), track changes, and make data publicly available for replication. This option has strict file size limits of 100 MB, but there is an option to use Git Large File Storage (LFS), an open source GitHub extension for versioning large files. Git LFS replaces large files such as datasets, audio samples, graphics, and videos with text pointers inside Git, while storing the file contents on a remote server like GitHub.com or GitHub Enterprise.
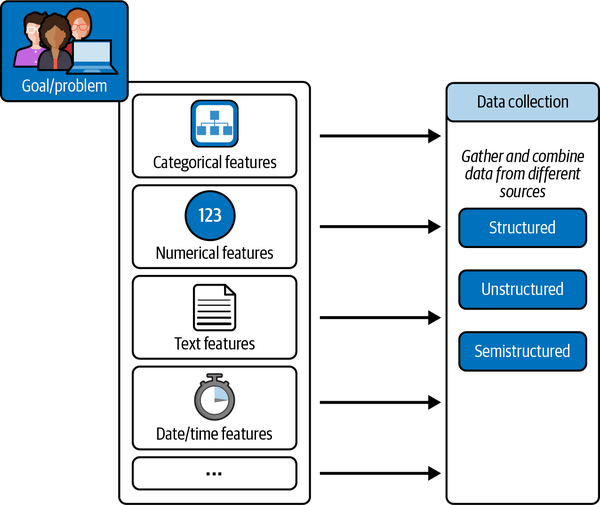
The challenge of data collection is compounded within large organizations, where many different types of operations management software such as enterprise resource planning, customer relationship management, and production systems exist and may run on different databases. Data may also need to be pulled from external sources in real time, such as Internet of Things (IoT) sensor devices from delivery trucks. Thus, organizations are challenged with collecting not only structured data, but also unstructured and semistructured data formats in batches or real time (streaming). Figure 1-5 shows various data elements that feed data collection for structured, unstructured, and semistructured data.
Note
It is possible to have streaming structured data. Structured versus unstructured is a property of data format. Streaming versus batch is a property of latency. Chapter 2 presents more information on data format and properties.
Data Preprocessing
To perform data cleanup you’ll need to deal with missing data values, duplicates, outlier data, formatting issues, or data that is inconsistent due to human error. This is because real-world data is raw and messy and filled with assumptions. One assumption could be that your data has a normal distribution, meaning that data is symmetrically distributed with no skew, and that most values cluster around a central region, with the frequency of the values decreasing further away from the center (mean or average).
Suppose your data showed, for the first time, an increase in the number of umbrellas sold in August in Palm Springs, the California desert town. Would your data be normally distributed, or would this be considered an outlier? Would it skew the results of predictions for monthly umbrella sales in August? When data does not have a normal distribution, it needs to be normalized, made normal by grouping all the records in a range of [0,1] or [–1,1], for example. You normalize a dataset to make it easier and faster to train an ML model. Normalization is covered in Chapter 7.
Note
This min-max normalization example can have detrimental effects if there are outliers. For example, when scaling to [0,1], it essentially maps the outlier to 1 and squashes all other values to 0. Addressing outliers and anomalies is beyond the scope of our book.
Thus, data preprocessing can mean normalizing the data (such that numeric columns in the dataset use a common scale) and scaling the data, which means transforming your data so that it fits within a specific range. Fortunately, normalization and standardization are easily performed in Python with just a few simple lines of code. Figure 1-6 shows actual data before and after normalization and standardization.
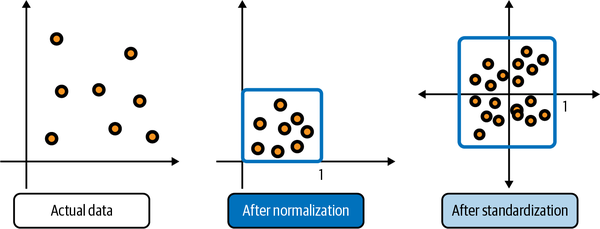
Figure 1-6. Three images showing actual, normalized, and standardized data.
Note
Collecting data from a single source may be a relatively straightforward process. However, if you are aggregating several data sources into one file, make sure that data formats match and that any assumptions regarding time-series data (or timestamp and date ranges needed for your ML model) are validated. A common assumption is that the data is stationary—that the statistical properties (mean, variance, etc.) do not change over time.
Data Analysis
Exploratory data analysis (EDA) is a process used to explore and analyze the structure of data. In this step, you are looking to discover trends, patterns, feature relevance, and correlations, such as how one variable (feature) might correlate with another. You must select relevant feature data for your ML model based on the type of problem you are trying to solve. The outcome of this step is a feature list of input variables that can potentially be used for ML. Our hands-on exercise using EDA can be found in Chapter 6.
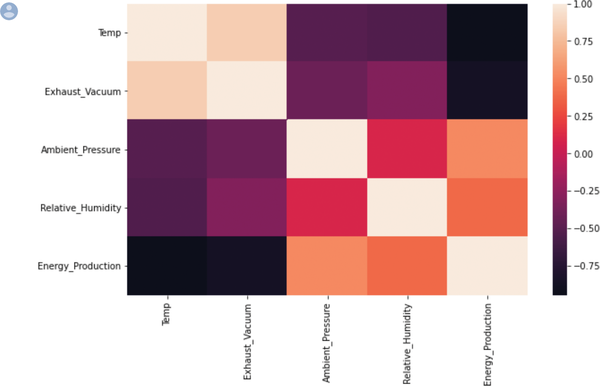
Figures 1-7 and 1-8 are a result of an EDA process plotted using Seaborn, a Python data visualization library (see Chapter 6 for more detail on the dataset). Figure 1-7 shows an inverse relationship between x and y. Figure 1-8 shows a heat map (or correlation matrix) and illustrates that more energy is produced when temperatures are lower.
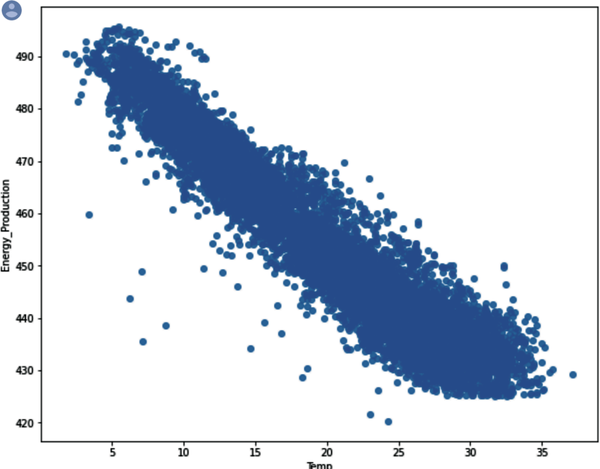
Figure 1-7. Seaborn regplot showing that more energy is produced when temperatures are lower.
Data Transformation and Feature Selection
After data has been cleaned and analyzed, you obtain a list of the features you think you need to help you solve your ML problem. But might other features be relevant? This is where feature engineering comes into play, where you engineer or create new features that were not in the original dataset. For example, if your dataset has separate fields/columns for month, day, and year, you can combine all three for a “month-day-year” time feature. Feature engineering is the final step before feature selection.
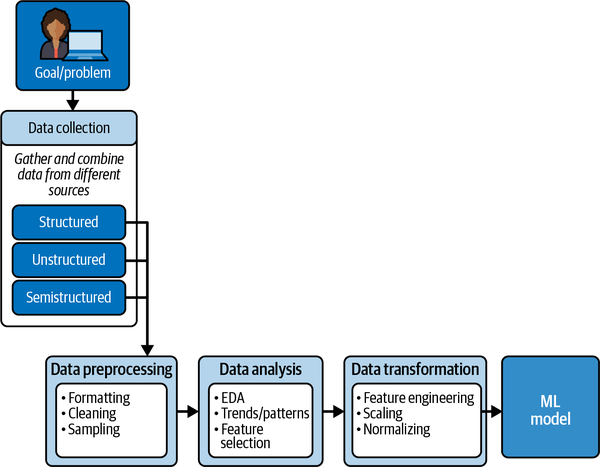
In reality, feature selection occurs at two stages: after EDA and after data transformation. For example, after EDA, you should have a potential list of features that may be candidates to create new features—for example, combining time and day of week to get an hour of day. After you perform feature engineering, you then have a final list of features from which to select. Figure 1-9 shows the position of data transformation and feature selection in the workflow.
Researching the Model Selection or Using AutoML (a No-Code Solution)
In this step, you either research the model that will be best for the type of data that fits your problem—or you could use AutoML, a no-code solution that, based on the dataset you uploaded, selects the appropriate model, trains, tests, and generates evaluation metrics. Essentially, if you use AutoML, the heavy lifting of model selection, model training, model tuning, and generating evaluation metrics is done for you. Chapter 3 introduces AutoML, and Chapter 4 starts getting hands-on with AutoML. Note that with a low-code solution, you would need to know what model to select.
Although AutoML might cover about 80% of your ML problems, you may want to build a more customized solution. In that case, having a general understanding of the types of problems ML algorithms can solve is helpful. Choosing the algorithm is solely dependent upon the problem (as discussed earlier). In Table 1-2, a “Description” column is added to further describe the ML model problem type.
Model Training, Evaluation, and Tuning
Before an ML model can be deployed to a production environment, it has to be trained, evaluated, and tested. Training an ML model is a process in which stored data instances are fed (input) into an ML model (algorithm). Since every stored data instance has a specific characteristic (recall our umbrella examples of the different types, prices, regions sold, and so forth), patterns of these data instances can be detected using hundreds of variables, and the algorithm is thus able to learn from the training data how to make a generalized prediction based on the data.
Every ML model needs to not only be trained but also evaluated. Thus, you hold out a sample of data, called a validation dataset. The validation set measures how well the model generalizes to unseen or new data. The training error is used to determine how well the model fits the data because that is what the model is trained on.
Model evaluation metrics should be chosen or defined so that they align with the problem or business goals. Model tuning should improve the model performance as measured by the evaluation metrics. For example, how accurate were the sales of umbrella predictions during the month of December? Can these predictions be generalized for future forecasting efforts? Note that satisfactory performance is something that should be dictated by the business needs and should be agreed upon before starting any ML engagement.
Note
The validation set is also used to determine if the model is overfitting. Chapter 8 discusses overfitting.
Model Testing
There is no way to know if your umbrella prediction app can be generalized for future forecasting efforts without testing the model. Once the training dataset is used to fit the model to the data, and the validation dataset is used to improve model accuracy, you test the model on data it has never seen before. Testing data is used to assess model performance.
For example, let’s say you want to build an application that can recognize an umbrella’s color or pattern based on images of the umbrellas. You train a model by providing it with images of all umbrellas that are each tagged with a certain color or pattern. You use that model in a mobile application to recognize any umbrella’s color or pattern. The test would be how well the model performs in differentiating between umbrella colors and patterns.
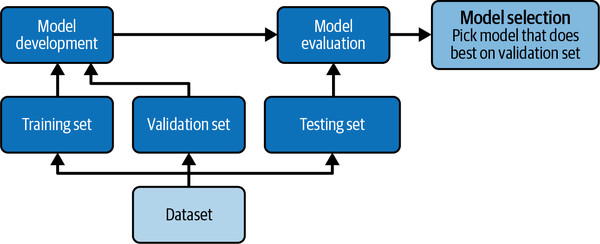
Figure 1-10 shows the relationship between the training, validation, and testing datasets.
Figure 1-11 illustrates this relationship among the training, validation, and test datasets in five process steps. For simplicity, the arrow going back to the dataset in Step 5 is not shown, since once a model is deployed as an application and it begins collecting data, new data enters the pipeline that may skew the original model’s results. (At this point you enter the fascinating realm of machine learning operations, or MLOps, which is beyond the scope of the book.)
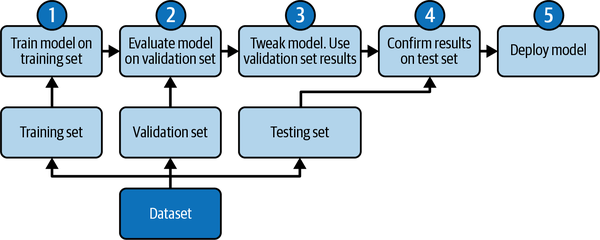
Figure 1-11. Five process steps of the ML workflow.
Model Deployment (Serving)
Once the ML model is trained, evaluated, and tested, it is deployed into a live production environment where it can be used. Note that by the time the model reaches production, it more than likely has a web app frontend (using a browser) that communicates with the production system through an application programming interface (API). Data can be captured in real time and streamed (ingested) into an MLOps pipeline. Or data can be captured in batch and stored for ingestion into the pipeline. Or both.
Maintaining Models
Models can become stale when predictions do not align with the original business goal or use case metrics. Staleness might occur when the world changes or business requirements change. These changes then impact the model. Post-deployment, you need to monitor your model to ensure it continues to perform as expected. Model and data drift is a phenomenon you should both expect and be prepared to mitigate through regular retraining using MLOps. Let’s look at an example of data drift, which means changes in the data that you trained with and the data that is now being received from the web app.
In our umbrella example, a region that once experienced heavy rainfall is now experiencing drought conditions. Similarly, a region that once experienced drought conditions is now experiencing heavy rainfall. Any prediction tied to weather and climate and the need for umbrellas and umbrella type will be impacted. In this scenario, you would need to retrain and test a new model with new data.
Summary
Businesses, educational institutions, government agencies, and practitioners face many decisions that reflect real-world examples of ML, from increasing customer engagement to reducing customer churn. Data—its collection, analysis, and use—drives the decision making used in ML to determine the best ML strategic approach that provides real-world solutions to real-world problems.
While decision-making processes help you identify your problem or use case, it is the ML workflow that helps you implement the solution to your problem. An enterprise ML workflow is data-driven and requires decision making in the process. The ML workflow can be shown as a series of 10 steps, and the steps can be combined into four phases:
-
Decision making
-
Data processing
-
Modeling
-
Deployment
Each phase of the ML workflow can be implemented using AutoML or low-code AI. AutoML does all of the heavy lifting for you. AutoML will train the model, tune it, test it, and present you with evaluation metrics. Your role is simply to evaluate the metrics and determine if they meet your business objective or solve your problem. AutoML is recommended for quick experiments and prototypes. It is also used in production environments. A low-code approach enables those with some coding or deep coding experience to use autogenerated code that can be further customized during any phase of the ML workflow.
In this chapter, you learned about data collection and analysis as part of the ML workflow. Chapter 2 provides an overview of the datasets used in the book, where to find data sources, data file types, and the difference between batch, streaming, structured, semistructured, and unstructured data. You also get hands-on experience using basic Python code to help you perform EDA and solve dirty data problems.
Get Low-Code AI now with the O’Reilly learning platform.
O’Reilly members experience books, live events, courses curated by job role, and more from O’Reilly and nearly 200 top publishers.
