Chapter 4. Single Cluster Availability
A solid foundation for each individual cluster is critical to the availability of your applications and services. Even with these advanced distributed application capabilities, there are some systems for which multicluster isn’t an option. Most stateful applications and databases are not capable of geographic distribution and are very complicated to properly operate across multiple clusters. Many modern data storage solutions require low latency multizone solutions, making it less than optimal to break up the data clusters into higher latency environments. It is also important to consider that many data platforms have StatefulSet solutions to help operate them, requiring a single-cluster architecture. We think that having a strong foundation of what it means for a system to be available and highly available is critical to understanding the value and architecture of OpenShift and Kubernetes. Note that we’ll discuss how to take advantage of multicluster architectures for the ultimate in availability and flexibility in Chapter 5. This chapter should help prepare you with the knowledge required to make intelligent decisions about what your availability goals are and how to leverage Kubernetes and OpenShift to achieve them.
System Availability
In modern service and application delivery, we typically talk about system availability in terms of what percentage of time an application or service is available and responding normally. A common standard in the technology service industry is to describe SLOs in terms of nines. We hear the terms four nines or five nines to indicate the percentage of time that the service is available. Four nines is 99.99%, and five nines is 99.999%. We’ll use these standards throughout this chapter. This SLO is the agreement within the SLA that the service provider has with its stakeholder or customer. These SLOs are often measured on a monthly basis, or sometimes annually.
Measuring System Availability
In his day job, one of the authors, Jake, is responsible for the delivery of IBM Cloud Kubernetes Service and Red Hat OpenShift on IBM Cloud. These are global services that provide managed Kubernetes and OpenShift solutions with the simplicity of an API-driven, user-friendly cloud experience. For these services, the site reliability engineering (SRE) team measures SLOs on a monthly basis as that coincides with the client billing cycle. It’s helpful to think about how much downtime is associated with these nines. We can see in Table 4-1 that our disruption budget or allowable downtime can be very low once we get into higher levels of availability. When performing this analysis, your team needs to carefully consider what it is willing to commit to.
| Availability percentage | Downtime per month |
|---|---|
| 99% (two nines) | 7 hours 18 minutes |
| 99.5% (two and a half nines) | 3 hours 39 minutes |
| 99.9% (three nines) | 43 minutes 48 seconds |
| 99.95% (three and a half nines) | 21 minutes 54 seconds |
| 99.99% (four nines) | 4 minutes 22.8 seconds |
| 99.999% (five nines) | 26.28 seconds |
There are two key performance indicators (KPIs) that a team will strive to improve in order to achieve an agreed-upon SLO. They are mean time to recovery (MTTR) and mean time between failures (MTBF). Together, these KPIs directly impact availability:
It’s helpful to think about how we can arrive at our desired availability percentage. Let’s say we want to get to a 99.99% availability. In Table 4-2, we compare some different MTTR and MTBF numbers that can get us to this availability.
| MTBF | MTTR |
|---|---|
| 1 day | 8.64 seconds |
| 1 week | 60.48 seconds |
| 1 month | 4 minutes 22.8 seconds |
| 1 year | 52 minutes 33.6 seconds |
For those following along at home, this means that to get to four-nines availability in a system that will experience a failure once a day, you have to identify and repair that failure in under nine seconds. The engineering investment required to achieve platform stability and software quality to dramatically extend the MTBF is simply massive. For many customers, four nines is prohibitively expensive. Getting to that level of availability takes hardware, engineering, and a support staff. For contrast, let’s take a look at a two nines comparison in Table 4-3.
| MTBF | MTTR |
|---|---|
| 30 minutes | 18.18 seconds |
| 1 hour | 36.36 seconds |
| 1 day | 14 minutes 32.4 seconds |
| 1 week | 1 hour 41 minutes 48 seconds |
What are we to make of these numbers? Well, there are a few things to take away from this. First, if you have a target of four nines, then you will need an unbelievably reliable system with failures occurring on the order of once a year if you are going to have any hope of hitting the target. Even at two nines, if you have a single failure a day, then you are going to need to identify and repair that failure in under 15 minutes. Second, we need to consider the likelihood of these failures. A failure once a day, you say? Who has a failure once a day? Well, consider this: the SLA for a single VM instance is typically around 90%, which means 73.05 hours of downtime per month. A single VM is going to be down on average three days per month. If your application depends on just 10 systems, then the odds are that at least one of those is going to be down every day.
Does this picture look grim and insurmountable? If not, then you are quite the optimist. If it is looking challenging, then you have recognized that hitting these failure rate numbers and recovery times with standard monitoring and recovery runbooks is unlikely. Enter the world of highly available systems.
What Is a Highly Available System?
In the simplest terms, high availability (HA) refers to a system that has the characteristic of not having any single point of failure. Any one “component” can sustain a failure and the system as a whole experiences no loss of availability. This attribute is sometimes referred to as having the ability to treat individual components as cattle rather than pets. This concept was first introduced by Bill Baker of Microsoft in his talk “Scaling SQL Server 2012.”1 It was later popularized by Gavin McCance when talking about OpenStack at CERN.2 As long as the overall herd is healthy, we don’t need to be concerned with the health of the individuals. We like to keep all of our pets healthy and in top shape, but it is rather time-consuming and expensive. If you have only a handful of pets, this can be sustainable. However, in modern cloud computing, we typically see a herd of hundreds or thousands. There simply are not enough SRE engineers on the planet to keep the entire herd healthy.
In a system that has a single point of failure, even the most cared-for components occasionally have a failure that we cannot prevent. Once discovered via monitoring, some time is always required to bring them back to health. Hopefully, our introduction to system availability convinces you of the challenges of MTBF and MTTR.
It is helpful for us to have a diagram of the simplest of highly available systems. A simple stateless web application with a load balancer is a great example, as shown in Figure 4-1.
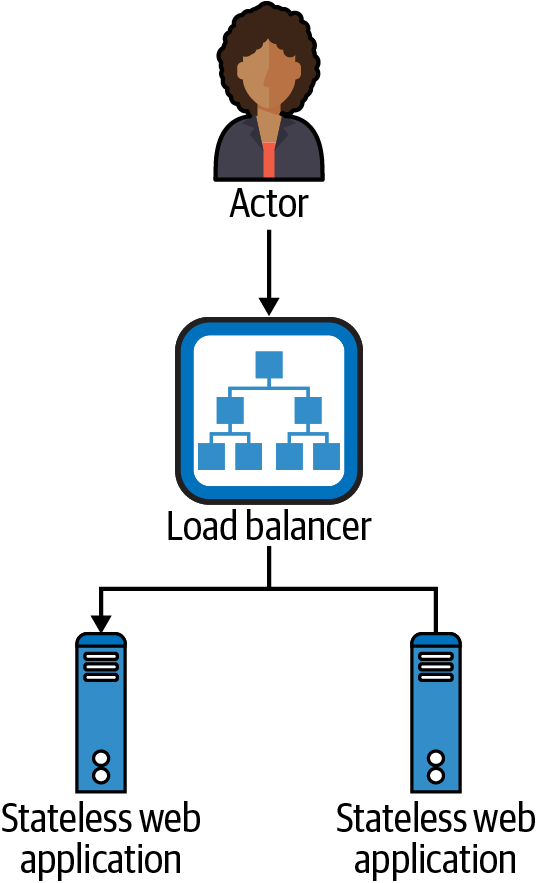
Figure 4-1. Highly available stateless web application with load balancer
In this simplest of HA systems, if either one of these two web application instances fails, the load balancer can detect that failure and stop routing traffic to the failed instance. The actor doesn’t know about the individual instances; all of the actor’s interactions are with the load balancer. The load balancer is even capable of doing retries if a request to one of the instances fails or does not respond fast enough.
Now, obviously the load balancer itself could also fail, but load balancers generally have much higher availability numbers than your typical web application. A typical cloud load balancer has an SLA of 99.99%, which would be the ceiling for the availability of any application running behind that load balancer. Where a cloud load balancer is not available, you can deploy them in pairs with virtual IPs and Virtual Router Redundancy Protocol (VRRP), which can move a single IP address between two load balancer instances. The public cloud providers can simplify all of this with their application and network load balancer services, which are capable of handling all of the HA aspects of the load balancer itself.
All done, right? Well, not quite; there are so many components and services to run in a modern application and service platform. In our experience, many large cloud services could consist of multiple groups of five to six microservices. Then add in the fact that your application or service might be globally distributed and/or replicated. Consider our own Red Hat OpenShift on IBM Cloud service availability in Figure 4-2.
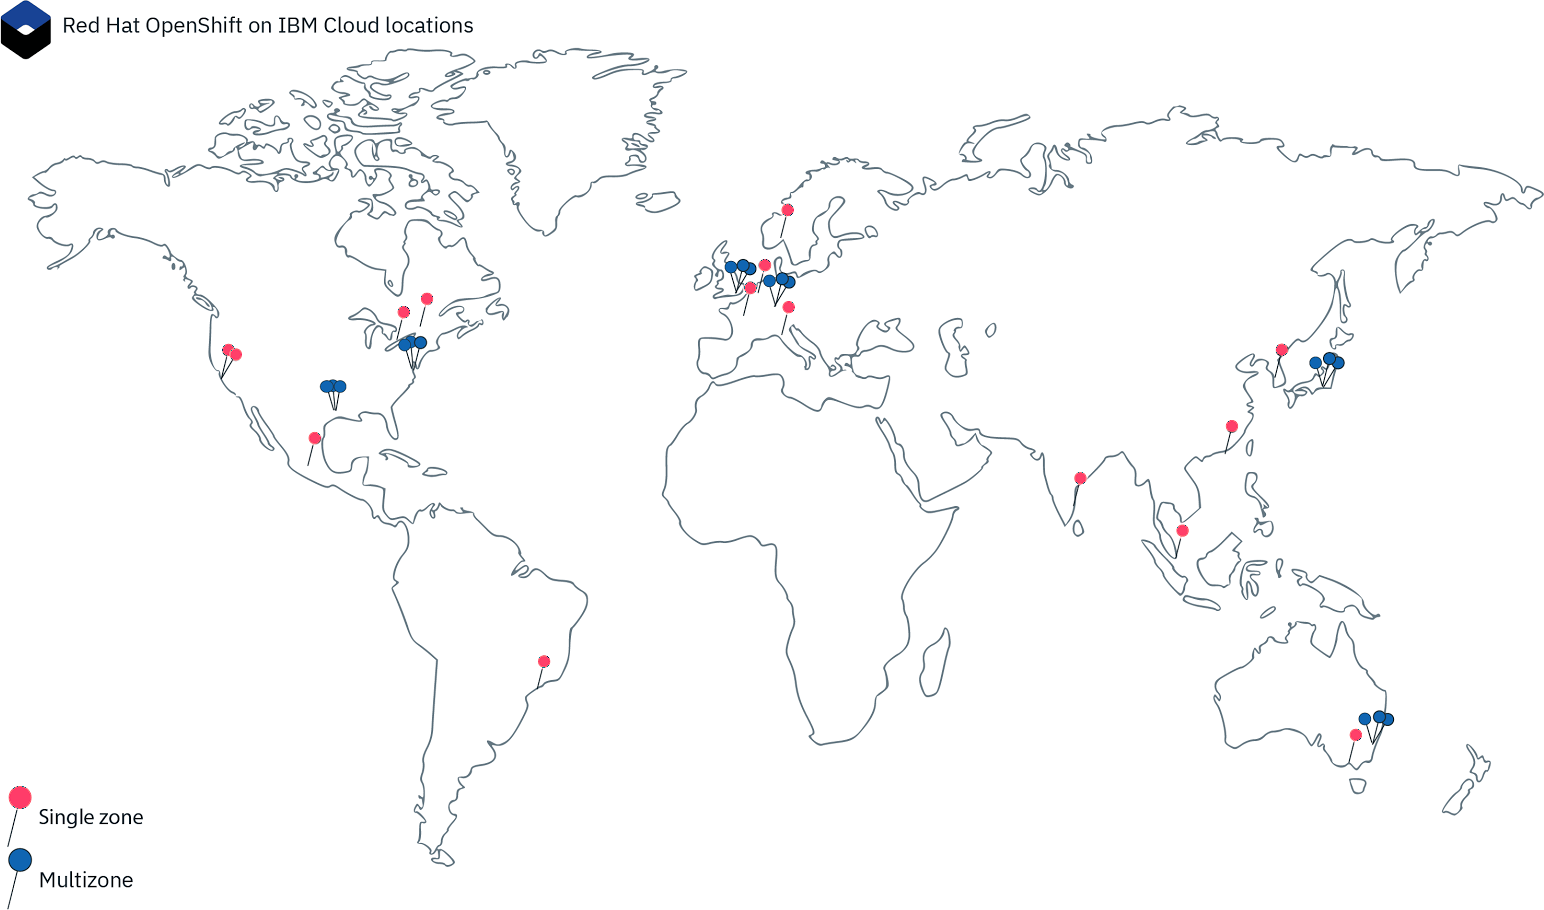
Figure 4-2. Red Hat OpenShift on IBM Cloud locations
That’s six global multizone regions along with 14 other datacenters worldwide. Our team runs over 40 microservices in each of those multizone regions, and about half that in the single-zone datacenters. The numbers add up quickly. Imagine if we had to manually deploy each microservice and configure a load balancer for each one of them in each of these locations. We’d need an army of engineers just writing custom configuration data. Enter OpenShift and Kubernetes.
OpenShift and Kubernetes Application and Service Availability
Many components in Kubernetes and OpenShift contribute to the availability of the overall system. We’ll discuss how we keep the application healthy, how we deal with networking, and how we are able to address potential issues with compute nodes.
The application
For our stateless application, the simple load balancer is the key to high availability. However, as we discussed, if we rely on manually deploying and configuring load balancers and applications, then keeping them up to date won’t be a whole lot of fun. In Chapter 2, we discussed Kubernetes deployments. This elegant construct makes it simple to deploy multiple replicas of an application. Let’s look at the livenessProbe, which is an advanced capability and one of the more critical features of the deployment-pod-container spec. The livenessProbe defines a probe that will be executed by the kubelet against the container to determine if the target container is healthy. If the livenessProbe fails to return success after the configured failureThreshold, the kubelet will stop the container and attempt to restart it.
Note
To handle transient issues in a container’s ability to serve requests, you may use a readinessProbe, which will determine the routing rules for Kubernetes services but won’t restart the container if it fails. If the readinessProbe fails, the state of the pod is marked NotReady and the pod is removed from the service endpoint list. The probe continues to run and will set the state back to Ready upon success. This can be useful if a pod has an external dependency that may be temporarily unreachable. A restart of this pod won’t help, and thus using a livenessProbe to restart the pod has no benefit. See the community docs for more details on the available probes in Kubernetes and OpenShift.
The following example shows a simple deployment that includes a livenessProbe with common parameters:
apiVersion: apps/v1
kind: Deployment
metadata:
  name: nginx
  labels:
    app: webserver
spec:
  replicas: 3
  selector:
    matchLabels:
      app: webserver
  template:
    metadata:
      labels:
        app: webserver
    spec:
      containers:
      - name: nginx
        image: nginx:1.7.9
        ports:
          - containerPort: 80
        livenessProbe:
          httpGet:
            path: /
            port: 80
          initialDelaySeconds: 3
          periodSeconds: 3
          timeoutSeconds: 2
          failureThreshold: 2
Let’s take a closer look at the options we have chosen in our example for livenessProbe and how they translate into real-world behaviors:
httpGet- The type of check that will be performed. You can also use
tcporexeccommands that will execute to test if the container is healthy. initialDelaySeconds- How long the
kubeletwill wait before attempting the first probe. periodSeconds- How often the
kubeletwill test the probe. timeoutSeconds- How long the
kubeletclient will wait for a response. failureThreshold- The number of consecutive failures that the
kubeletmust run through before marking the probe as failed. In the case of ourlivenessProbe, the result is restarting this container.
Tip
Be sure to thoroughly test your livenessProbe and the timing settings. We have heard of numerous cases where a slow application startup results in a CrashLoopBackOff scenario where a pod never starts up successfully due to never having sufficient initialDelaySeconds to start completely. The livenessProbe never succeeds because the kubelet starts to check for liveness before the application is ready to start receiving requests. It can be painful for rolling updates to set very long initial delay settings, but it can improve stability of the system where there is a lot of variability in initial liveness times.
Together, we have all the makings of a traditional load balancer health check. HAProxy is a popular traditional software load balancing solution. If we look at a standard HAProxy configuration, we’ll see many of the same critical health-checking components:
frontend nginxfront
 bind 10.10.10.2:80
 mode tcp
 default_backend nginxback

backend nginxback
 mode tcp
 balance roundrobin
 option httpchk GET /
 timeout check 2s
 default-server inter 3s fall 2
 server 10.10.10.10:80 check
 server 10.10.10.11:80 check
 server 10.10.10.12:80 check
The interesting thing to note here is that we’re looking at the same configuration settings for a load balancer configuration in legacy infrastructure as we are for a deployment in Kubernetes. In fact, the actual check performed is identical. Both initiate an HTTP connection via port 80 and check for a 200 response code. However, the net resulting behavior is quite different. In the case of HAProxy, it just determines if network traffic should be sent to the backend server. HAProxy has no idea what that backend server is and has no ability to change its runtime state. In contrast, Kubernetes isn’t changing the network routing directly here. Kubernetes is only updating the state of each of the pods in the deployment (Ready versus NotReady), and it will restart that container if it fails its livenessProbe. Restarting the pod won’t fix all issues that are causing unresponsiveness, but it often can solve minor issues.
Tip
livenessProbe isn’t just great for ensuring that your containers are healthy and ready to receive traffic. It’s a fantastic programmable solution for the pragmatic operator who is tired of cleaning up Java Virtual Machine (JVM) leaking threads and memory to the point of becoming unresponsive. It’s a nice backup to the resource limits that we set in place in Chapter 3 in an attempt to limit these resource leaks.
It’s worth noting that associating these health-checking configurations with the runtime components rather than a networking feature of the system is a deliberate choice. In Kubernetes and OpenShift, the livenessProbe is performed by the kubelet rather than by a load balancer. As we can see in Figure 4-3, this probe is executed on every node where we find a pod from the deployment.

Figure 4-3. kubelet performing livenessProbe to local nginx pod
Every kubelet (one per worker node) is responsible for performing all of the probes for all containers running on the kubelet’s node. This ensures a highly scalable solution that distributes the probe workload and maintains the state and availability of pods and containers across the entire fleet.
The infrastructure
Where does the networking come from in Kubernetes? That’s the job of the Kubernetes service. Here is where things get interesting. Let’s look at how traffic travels to our nginx pod. First, our service definition:
apiVersion: v1
kind: Service
metadata:
 labels:
 app: webserver
 name: nginx-svc
spec:
 ports:
 - port: 80
 protocol: TCP
 targetPort: 8080
 selector:
 app: webserver
 type: ClusterIP
 clusterIP: 172.21.102.110
This service definition tells Kubernetes that it should route any traffic in the cluster that is sent to 172.21.102.110 on port 80 to any pods that match the selector app=webserver on port 8080. The advantage here is that as we scale our webserver application up and down or update it and the pods are replaced, the service keeps the endpoints up to date. A great example of endpoint recovery can be seen if we delete all the pods and let our deployment replace them automatically for us:
$ kubectl get endpoints nginx-svc
NAME      ENDPOINTS                                          AGE
nginx-svc 172.30.157.70:80,172.30.168.134:80,172.30.86.21:80 3m21s

$ kubectl delete pods --all
pod "nginx-65d4d9c4d4-cvmjm" deleted
pod "nginx-65d4d9c4d4-vgftl" deleted
pod "nginx-65d4d9c4d4-xgh49" deleted

$ kubectl get endpoints nginx-svc
NAME      ENDPOINTS                                          AGE
nginx-svc 172.30.157.71:80,172.30.168.136:80,172.30.86.22:80 4m15s
This automatic management of the endpoints for a service begins to show some of the power of Kubernetes versus traditional infrastructure. There’s no need to update server configurations in HAProxy. The Kubernetes service does all the work to keep our “load balancer” up to date. To assemble that list of endpoints, the Kubernetes service looks at all pods that are in the Ready state and matches the label selector from the service definition. If a container fails a probe or the node that the pod is hosted on is no longer healthy, then the pod is marked NotReady and the service will stop routing traffic to that pod. Here we again see the role of the livenessProbe (as well as the readinessProbe), which is not to directly affect routing of traffic, but rather to inform the state of the pod and thus the list of endpoints used for routing service traffic.
In a situation where we have multiple replicas of our application spread across multiple worker nodes, we have a solution with the service where even if a worker node dies, we won’t lose any availability. Kubernetes is smart enough to recognize that the pods from that worker node may no longer be available and will update the service endpoint list across the full cluster to stop sending traffic to the pods on the failed node.
We’ve just discussed what happens when a compute node dies: the service itself is smart enough to route traffic around any pods on that node. In fact, the deployment will then also replace those pods from the failed node with new pods on another node after rescheduling them, which is very handy for dealing with compute failures. What about the need to provide a “load balancer” for the service? Kubernetes takes a very different approach in this matter. It uses the kube-proxy component to provide the load-balancing capabilities. The interesting thing about kube-proxy is that it is a fully distributed component providing a load-balancing solution that blends the distributed nature of client-side load balancers and the frontend of a traditional load balancer. There is not a separate client-side load balancer for every client instance, but there is one per compute node.
Note that kube-proxy is responsible for translating service definitions and their endpoints into iptables3 or IPVS4 rules on each worker node to route the traffic appropriately. For simplicity, we do not include the iptables/IPVS rules themselves in our diagram; we represent them with kube-proxy, as shown in Figure 4-4.
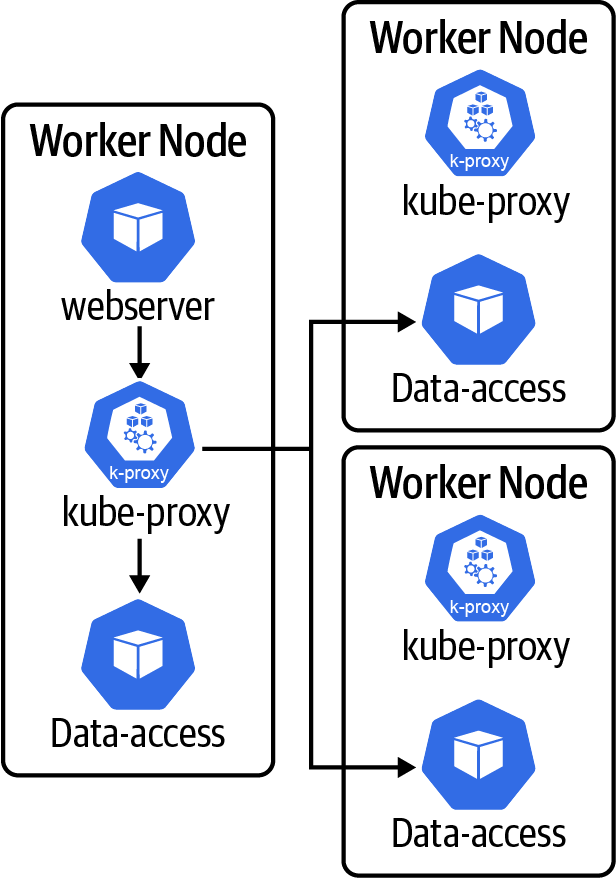
Figure 4-4. kube-proxy routing traffic to data-access endpoints
In the example in Figure 4-4, note that the webserver (client) will route traffic to the local kube-proxy instance, and then kube-proxy sends traffic along to the data-access service pods running on the local and/or remote nodes. Thus, if any one of these nodes fails, then the client application and the kube-proxy that does the load balancing for that node die together. As a result, the kube-proxy is a key component that provides a simplified and distributed solution for high availability in the Kubernetes system.
We have now reviewed how Kubernetes has engineered a solution to maintain system uptime despite a failure of any single compute node, service instance, or “load balancer” (kube-proxy), thus allowing us to maintain the availability of our entire system automatically. No SRE intervention is required to identify or resolve the failure. Time and again, we see issues where a Kubernetes-hosted system does suffer some failure despite this. This is often the result of poorly written probes that are unable to account for some edge-case application failure. Kubernetes does an excellent job of providing the platform and guidelines for ultimate availability, but it is not magic. Users will need to bring well-engineered and properly configured applications and services to see this potential.
There are other networking solutions for load balancing as well. The kube-proxy is great, but as we have noted, it really works only when routing traffic from a client that lives in the cluster. For routing client requests from outside the cluster, we’ll need a slightly different approach. Solutions such as an ingress controller, OpenShift Router, and Istio Ingress Gateway enable the same integration with the Kubernetes service concept but provide a way to route traffic from outside the cluster to the service and applications running inside the cluster. It is important to note that you will need to combine these Layer 7 routing solutions with an external Layer 4 load balancer in order to maintain proper availability. Figure 4-5 shows how an external load balancer is combined with an OpenShift Router to get a request from the actor outside the cluster to the web server that is running in the cluster. Note that when these network solutions are used, they do not route their traffic through kube-proxy; they do their own load balancing directly to the endpoints of the service.
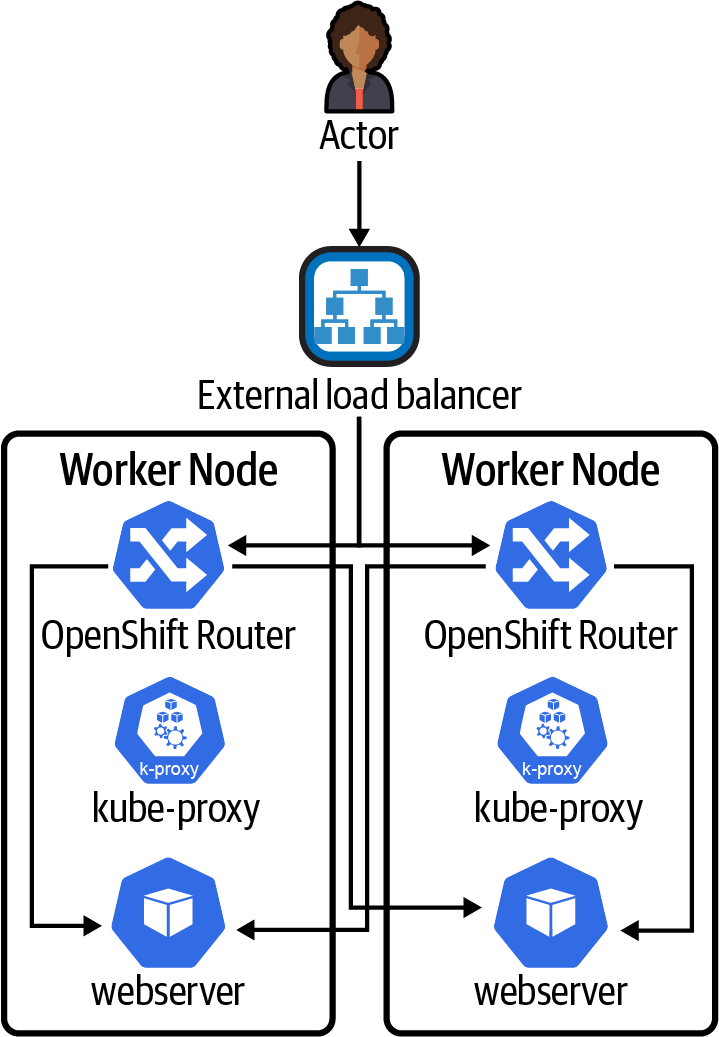
Figure 4-5. External load balancer and OpenShift Router
All of the same rules and logic for redundancy and availability apply here as we have discussed thus far. The external load balancer is just like the HAProxy example we provided earlier in this chapter. There simply is no escaping the laws of networking. You still need a highly available solution to get traffic from the outside world into the cluster. The advantage here is that we don’t need to set up a separate load balancer for every application in our cluster. The OpenShift Router, ingress controller, and Istio Ingress Gateway can all serve many different applications in the cluster because they support Layer 7 routing, not just Layer 4. Layer 7 routers can inspect HTTP(S) headers to understand the target URL and use that information to send traffic to the correct service. It’s important to note that the OpenShift Router and ingress controller still rely on the Kubernetes service to do the liveness and readiness probe work to determine which pods the Router or ingress controller should send traffic to.
While these are more complex solutions, we simply need to have something that allows for routing external traffic to services hosted in our cluster. We have left discussion of the NodePort concept upon which the external load balancer solution is based to the reader to investigate from the Kubernetes documentation.
The result
Looking back to our initial availability discussion, Kubernetes has supplied a mechanism to identify and repair an issue. Based on our application livenessProbe settings, it would take a maximum of six seconds to identify the problem and then some amount of time to reroute traffic (mitigating any failed requests), and then it would automatically repair the failed container by restarting it. That container-restart process in an efficient application can be quite speedy indeed, subsecond. Even conservatively at 10 seconds, that looks pretty good for our MTTR. We could be more aggressive with our settings and do a livenessProbe every two seconds, kick a restart on just a single failure, and get to a sub-five-second MTTR.
A quick note on livenessProbe and readinessProbe settings: remember that the kubelet is going to be making requests to every instance of these containers across the entire cluster. If you have hundreds of replicas running and they are all being hit every two seconds by the probes, then things could get very chatty in your logging or metrics solution. It may be a nonissue if your probes are hitting fairly light endpoints that are comparable to those that may be hit hundreds or thousands of times a second to handle user requests, but it’s worth noting all the same.
Now that we have some idea of the kind of MTTR we could achieve with Kubernetes for our application, let’s take a look at what this does for some of our availability calculations to determine MTBF for our system in Table 4-4.
| MTTR | MTBF for 99% availability | MTBF for 99.99% availability |
|---|---|---|
| 5 seconds | 8.26 minutes | 13 hours 53 minutes |
| 10 seconds | 16.5 seconds | 27 hours 46 minutes |
| 1 minute | 99 seconds | 6 days 22.65 hours |
| 10 minutes | 16 minutes 30 seconds | 69 days 10.5 hours |
Looking at this data, we can start to see how with the power of just the simple Kubernetes deployment concept, we can get to some reasonable availability calculations that we could sustain.
Done and dusted, right? Not so fast. Different failure modes can have a variety of different results for Kubernetes and OpenShift. We’ll take a look at these failures next.
Failure Modes
You can experience a variety of different types of failures in your Kubernetes and OpenShift systems. We’ll cover many of these failures, how to identify them, what the application or service impact is, and how to prevent them.
Application Pod Failure
A single application pod failure (Figure 4-6) has the potential to result in almost no downtime, as based on our earlier discussion around probes and the kubelet ability to automatically restart failed pods.
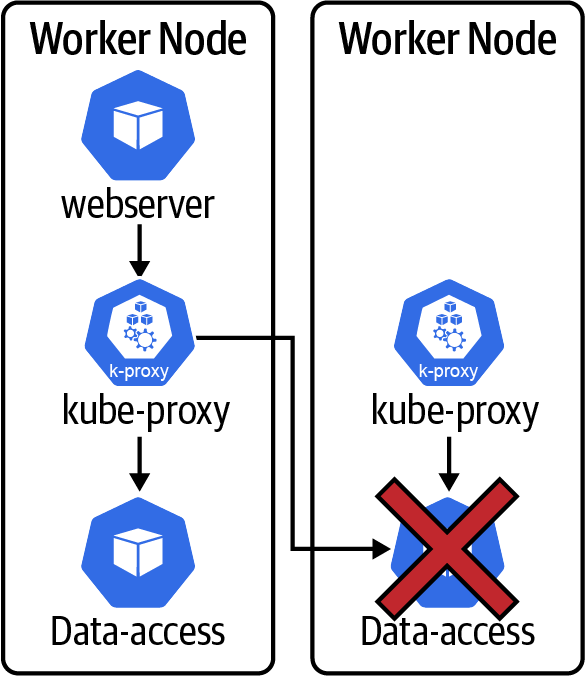
Figure 4-6. Application pod failure
It is worth noting that longer probe intervals can result in longer MTTR as that increases the time to detect the failure. It’s also interesting to note that if you are using readinessProbes, it can take some time for a readiness failure to propagate through the Kubernetes or OpenShift system. The total time for recovery can be:
(readinessProbe Internal * failureThreshold) + iptables-min-sync-period
The iptables-min-sync-period is a new configuration setting we have not discussed yet. This setting (or ipvs-min-sync-period in the case of IPVS mode) of kube-proxy determines the shortest period of time that can elapse between any two updates of the iptables rules for kube-proxy.5 If one endpoint in the cluster is updated at t0 and then another endpoint update occurs five seconds later but the min-sync is set to 30 seconds, then kube-proxy (iptables/IPVS) will still continue to route traffic to potentially invalid endpoints. The default for this setting is one second and thus minimal impact. However, in very large clusters with huge numbers of services (or huge numbers of endpoints), this interval may need to be increased to ensure reasonable performance of the iptables/IPVS control plane. The reason for this is that as there are more and more services to manage, the size of the iptables or IPVS rule set can become massive, easily tens of thousands of rules. If the iptables-min-sync-period is not adjusted, then kube-proxy can become overwhelmed with constantly trying to update the rules. It’s important to remember this relationship. Cluster size can impact performance and responsiveness of the entire system.
Worker Node Failure
One of the most common failures seen in any OpenShift or Kubernetes cluster is the single worker node failure (Figure 4-7). Single node faults can occur for a variety of reasons. These issues include disk failure, network failure, operating system failure, disk space exhaustion, memory exhaustion, and more. Let’s take a closer look at what takes place in the Kubernetes system when there is a node failure. The process to recover a single node will directly impact our availability calculations of the system.
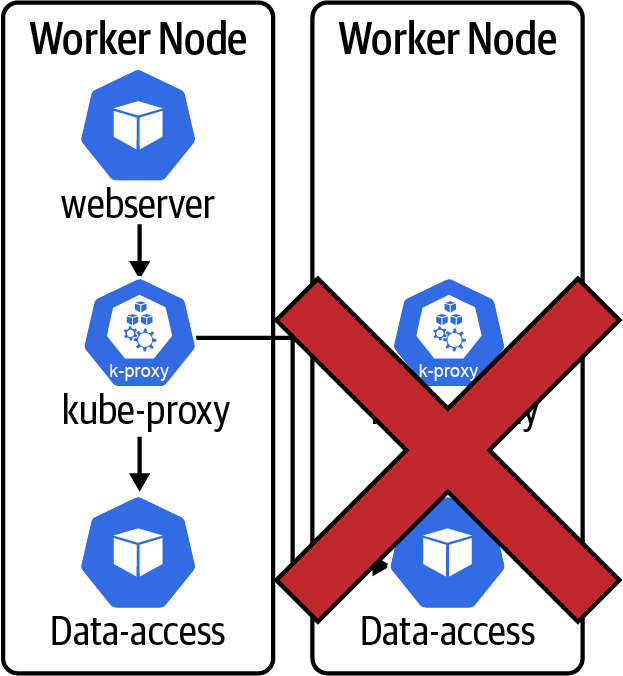
Figure 4-7. Worker node failure
The following are the time intervals that occur when responding to a worker node failure:
- T0
- Failure occurs on node.
- T1 = T0 +
nodeLeaseDurationSeconds - Kubernetes and OpenShift now use a lease system to track the health of worker nodes. Each
kubeletregisters a lease object for itself with the control plane. If that lease expires, then the node is immediately marked asNotReady. As soon as the node is markedNotReady, then the service controller will denote that any pods on that node may have failed and any service endpoints associated with the pods on that node should be removed. This is how Kubernetes decides to stop routing traffic to pods on a failed node. The result is the same as thelivenessProbefailing for the pod but affects all pods on the failed node.nodeLeaseDurationSecondsis configured on thekubeletand determines how long the lease will last. The default time is 40 seconds. - T2 = T1 +
iptables-min-sync-period - This is the additional time that may be required to update the fleet of kube-proxy configurations across the cluster. This behavior is identical to the behavior that was discussed earlier in our application pod failure scenario where any changes in the endpoint list for a service need to be synced to all of the kube-proxy instances across the cluster. Once the sync completes, then all traffic is routed properly, and any issues from the failed node will be resolved minus the capacity lost. The default minimum sync period is 30 seconds.
- T3 = T2 +
pod-eviction-timeout - This setting is configured on the kube-controller-manager and determines how long the controller will wait after a node is marked
NotReadybefore it will attempt to terminate pods on theNotReadynode. If there are controllers managing the pods that are terminating, then typically they will start a new replacement pod, as is the case with the deployment controller logic. This does not affect routing of traffic to the pods on the bad node; that was addressed at T2. However, this will recover any diminished capacity associated with the pods from the failed node. The default timeout is five minutes.
As we can see, the impact of a node failure is on a similar order of magnitude as an application pod failure. Note that here we are calculating the worst-case scenario to get to T2 where service is recovered. Some node failures may be detected and reported faster, and as a result, the T1 time can be quicker as we don’t have to wait for the lease to expire for the node to be marked NotReady. Also remember that the iptables may sync faster; this is just the worst-case scenario.
Worker Zone Failure
A zone failure is handled much the same as a worker node failure. In a total zone failure (Figure 4-8), such as a network failure, we would typically expect all nodes to be marked as NotReady within a reasonably small window of time.
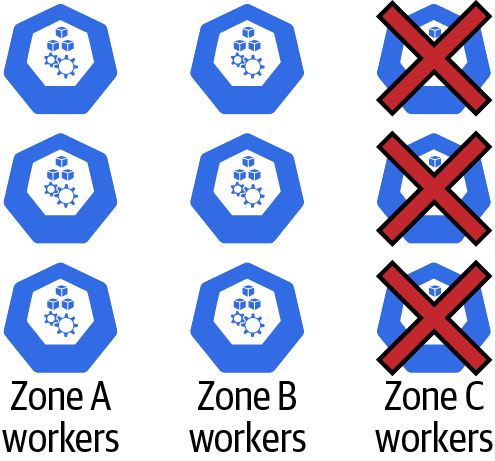
Figure 4-8. Worker zone failure
A zone failure can be “detected” by Kubernetes and OpenShift if the number of nodes in a single zone that is failing exceeds the unhealthy-zone-threshold percentage.6 If a zone failure is detected, there is no change to the service endpoint evaluation process. All pods on the failed nodes will be removed as endpoints for any associated services. The unhealthy-zone-threshold will change what happens to the pod eviction process. If the cluster is below the large-cluster-size-threshold (defined as a count of nodes), then all pod eviction in the zone will stop. If unhealthy-zone-threshold is above the large cluster size, then pod eviction starts, but nodes are processed at a much slower rate as defined by the secondary-node-eviction-rate. This is in an effort to prevent a storm of pod scheduling and allows the system some additional time to recover without “overreacting” to a temporary failure.
Control Plane Failure
There are a variety of different control plane failure scenarios. There are network-related failures between worker nodes and the control plane, and there are control plane component failures. We’ll get into the details of the high availability features of the various control plane components later in this section. Before we get started with those details, it’s worth talking about what happens when there is any kind of total control plane failure. How does the cluster overall respond to a failure like the one shown in Figure 4-9?
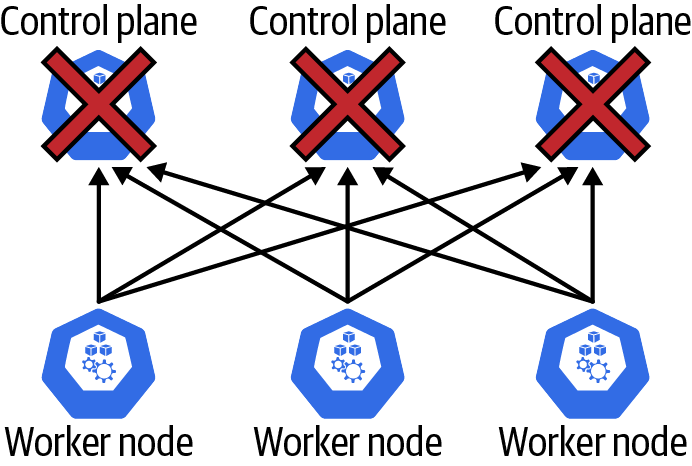
Figure 4-9. Complete control plane failure
The good news is that all of the workloads running on the worker nodes are unaffected in this scenario. All of the kube-proxy configurations, ingress controllers, pods, DaemonSets, network policies, and so on continue to function exactly as they were at the time of the control plane failure. The bad news is that no changes or updates can be made to the system in this state. In addition, if a worker node fails during this scenario, then there is no detection or updating of the cluster to compensate for the failure. Fortunately, the likelihood of such a failure is low if the control plane is implemented properly. We’ll cover some of the HA features of the control plane now.
Rather than keep everyone waiting, we’ll start with the most complex, potentially most challenging, and easily most critical component within the control plane. The component worthy of the title of “most critical” is etcd. Kubernetes and OpenShift use the open source key value store etcd as their persistent storage solution. The etcd datastore is where all objects in the system are persisted. All of the data and information related to the nodes, deployments, pods, services, and so on are stored in etcd.
etcd failures
You can encounter many different issues with etcd. Some are easier to mitigate than others. Connectivity failures from the kube-apiserver to etcd may be the most common. The modern etcd client has load balancing and resiliency built in. Note that if you have a traditional load balancer that sits in front of your etcd instance, then much of this does not apply, as you likely have a single endpoint registered for etcd. Regardless, the kube-apiserver will use the --etcd-servers setting to determine what IP(s) and/or hostname(s) the etcd go client is configured with. There is excellent documentation about the load balancing behavior in the community. It’s worth noting that most modern Kubernetes and OpenShift versions are now using the clientv3-grpc1.23 variant in their client. This version of the client maintains active gRPC subconnections at all times to determine connectivity to the etcd server endpoints.
The failure recovery behavior of the etcd client enables the system to deal with communication failures between the kube-apiserver and etcd. Unfortunately, the etcd client cannot handle issues like performance degradation of a peer or network partitioning. This can be mitigated to some extent with excellent readiness checking of the etcd peers. If your system allows for readiness checking (for example, etcd hosted on Kubernetes), you can configure readiness checks that can look for network partitioning or severe performance degradation using something like:
etcdctl get --consistency=s testKey --endpoints=https://localhost:port
Using this code will ensure that the local peer is able to properly perform a serialized read and is a stronger check to make sure that not only is this peer listening but also it can handle get requests. A put test can be used (which also ensures peer connectivity), but this can be a very expensive health check that introduces tons of key revisions and may adversely impact the etcd cluster. We are conducting an ongoing investigation to determine whether etcd performance metrics are a reliable indicator that a peer is suffering performance degradation and should be removed from the cluster. At this point, we can only recommend standard monitoring and SRE alerting to observe performance issues. There is not yet strong evidence that you can safely kill a peer because of performance issues and not potentially adversely impact overall availability of the cluster.
Note
It would be poor form to have all of this discussion about improving availability of etcd without also mentioning how critical it is to have a proper disaster-recovery process in place for etcd. Regular intervals of automated backups are a must-have. Ensure that you regularly test your disaster-recovery process for etcd. Here’s a bonus tip for etcd disaster recovery: even if quorum is broken for the etcd cluster, if etcd processes are still running, you can take a new backup from that peer even without quorum to ensure that you minimize data loss for any time delta from the last regularly scheduled backup of etcd. Always try to take a backup from a remaining member of etcd before restoring. The Kubernetes documentation has some excellent info on etcd backup and restore options.
The most significant concern with etcd is maintaining quorum of the etcd cluster. etcd will break quorum any time less than a majority of the peers are healthy. If quorum breaks, then the entire Kubernetes/OpenShift control plane will fail and all control plane actions will begin to fail. Increasing the number of peers will increase the number of peer failures that can be sustained. Note that having an even number of peers doesn’t increase fault tolerance and can harm the cluster’s ability to detect split brain-network partitions.7
kube-apiserver failures
The kube-apiserver is responsible for handling all requests for create, read, update, and delete (CRUD) operations on objects in the Kubernetes or OpenShift cluster. This applies to end-user client applications as well as internal components of the cluster, such as worker nodes, kube-controller-manager, and kube-scheduler. All interactions with the etcd persistent store are handled through the kube-apiserver.
The kube-apiserver is an active/active scale-out application. It requires no leader election or other mechanism to manage the fleet of kube-apiserver instances. They are all running in an active mode. This attribute makes it straightforward to run the kube-apiserver in a highly available configuration. The cluster administrator may run as many instances of kube-apiserver as they wish, within reason, and place a load balancer in front of the apiserver. If properly configured, a single kube-apiserver failure will have no impact on cluster function. See Figure 4-10 for an example.
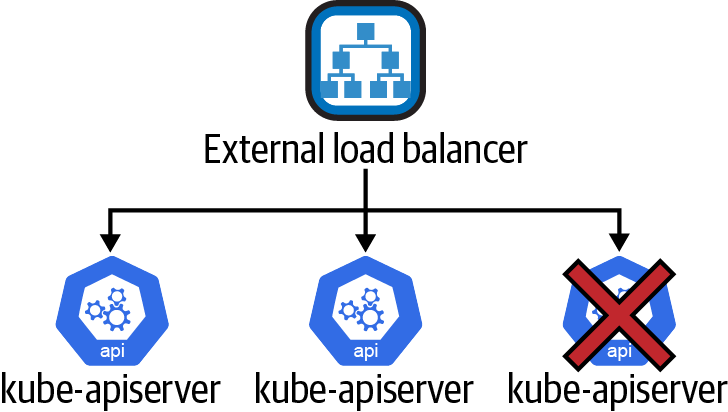
Figure 4-10. kube-apiserver single failure with no availability impact
kube-scheduler and kube-controller-manager failures
These two components have very similar availability features. They both run with a single active instance at all times and use the same leader election features. They leverage the lease object to manage the leader of the cluster. If a follower instance of either component fails, there is no impact to the overall cluster functionality. If the leader fails, then for the --leader-elect-lease-duration there will be no leader. However, no component interacts with the scheduler or controller manager directly. These two components interact asynchronously on object state changes in the cluster.
Loss of leader for the kube-controller-manager can result in a delay of recovery from a node failure, as an example. If a pod fails for some reason, then the controller manager will not respond to update the endpoints of the associated service. So while a concurrent leader failure with other system failures can result in a prolonged MTTR for the system, it will not result in an extended failure or outage.
A failed kube-scheduler leader should have almost no impact on availability. While the leader is down awaiting a new election, no new pods will be scheduled to nodes. So while you may experience diminished capacity due to lack of scheduling of pods from a concurrent failed node, you’ll still have service and routing updates to the cluster at this time.
Network Failure
Networking failures come in many different varieties. We could see failures of routing-table updates that cause packets to be misrouted. In other scenarios, we might see load-balancer failures. There could be a network-switch failure. The list of potential issues is endless. To simplify our discussion of this topic, we will bundle network failures into two common flavors: North-South network failures occur when traffic from outside our Kubernetes or OpenShift cluster can no longer enter or exit, and East-West network failures describe a situation where network traffic cannot travel between the nodes in our cluster.
North-South network failure
This failure scenario refers to the situation where the cluster itself may be healthy, control plane and data plane, but there may be issues routing traffic into the cluster from external sources. In Figure 4-11, we have a situation where connectivity from the external load balancer to the worker node has failed.
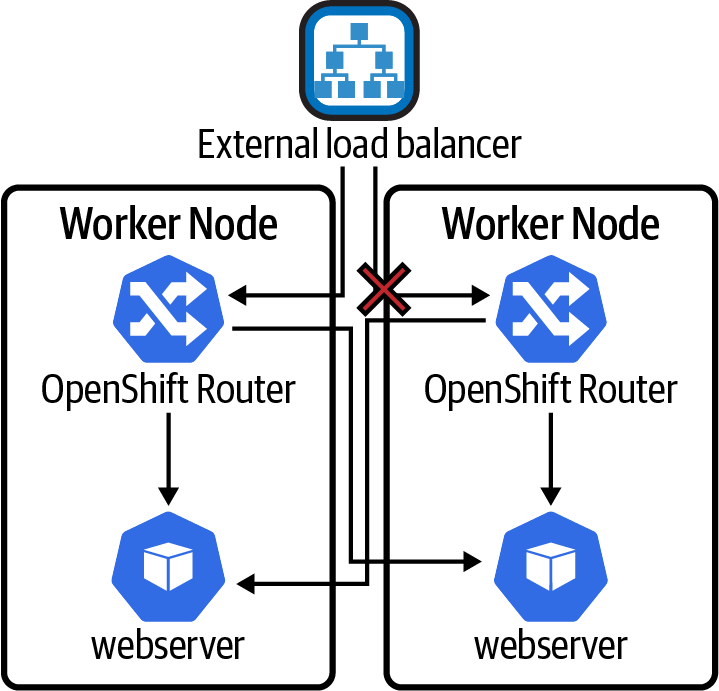
Figure 4-11. North-South networking failure
The result is that the load balancer health checks to any NodePorts exposed from the connection to the failed worker node will fail, the load balancer will stop routing traffic to that worker node, and life goes on. In fact, the MTTR here will be quite good, as it will take only the time required for the external load balancer to fail the health check to stop routing traffic down the failed link, or potentially it would have zero downtime if connection time limits and retries are integrated into this load-balancer solution. Load balancers were born for this stuff.
If all connectivity between the load balancer and the worker nodes fails, then all access from outside the cluster will have failed. The result is real downtime for any service whose purpose is to be accessed from outside the cluster. The good news is that we can implement multizone clusters to mitigate the chances of such catastrophic failures. In Chapter 8, we will discuss using multiple clusters with global DNS-based load balancing for further improvements to mitigating geographic network outages. In addition, these North-South failures only affect access to services from outside the cluster. Everything operating within the cluster may still function without any service interruption.
East-West network failure
We may also encounter scenarios where nodes may lose cross-zone connectivity or network partitioning. This is most frequently experienced in multizone clusters when there is a network failure between zones. In Figure 4-12 we look at a full zone failure.
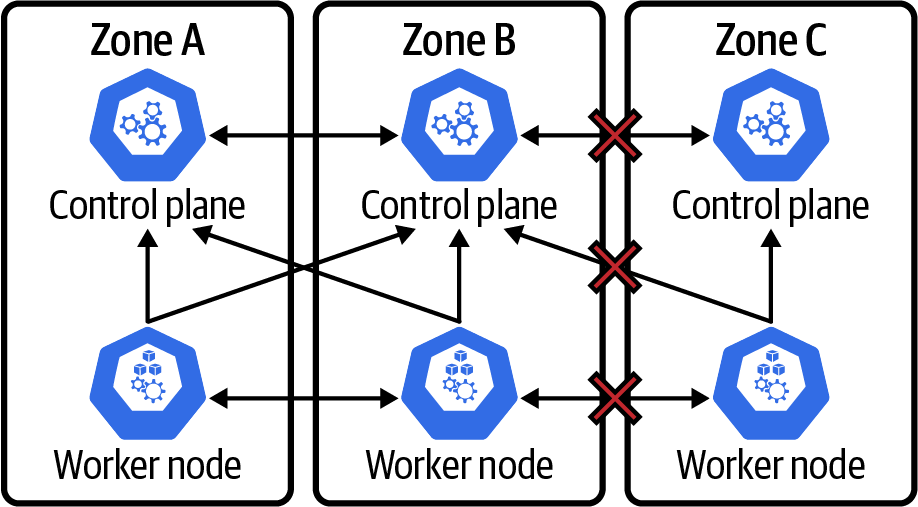
Figure 4-12. East-West total failure
In this scenario, we are faced with a “clean” zone failure where Zone C is fully partitioned. The worker node in the zone will continue to try and renew its lease to the control plane node in Zone C. If this were successful, it would lead to issues. However, the Zone C control plane will drop out of the cluster and stop responding to requests. Two things happen for this to occur. First, etcd in Zone C will begin to fail as it will not be able to contact etcd in other zones to participate in the quorum on the etcd cluster. As a result, the kube-apiserver in Zone C will also start to report back as unhealthy. The worker in Zone C won’t be able to renew its lease with the control plane. As a result, it will just sit tight and do nothing. The kubelet will restart any containers that fail. However, as we can see, there is no connectivity between the Zone C worker and other zones. Any application communication will begin to fail.
The good news is that all will be well in Zones A and B. The control plane etcd will retain quorum (electing a new leader in A or B if the leader was previously in C), and all control plane components will be healthy. In addition, the lease for the worker in Zone C will expire, and thus this node will be marked as NotReady. All Zone C service endpoints will be removed, and kube-proxy will be updated to stop routing traffic to pods in Zone C.
There are probably a number of scenarios that can leave the Kubernetes or OpenShift platform slightly out of sorts. We’re going to focus on one such scenario that does expose a weakness in the Kubernetes design. This is a failure where East-West traffic only fails between worker nodes. It is not uncommon to provide some network isolation between the worker nodes and control plane, which can result in this inconsistency between control plane connectivity and worker node connectivity. We’ve got an example depicting this in Figure 4-13.
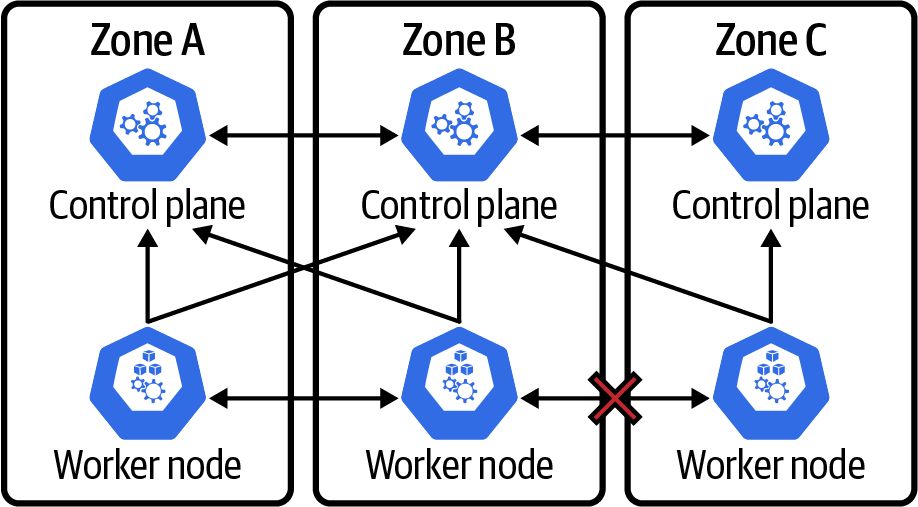
Figure 4-13. East-West data plane failure
The result here is quite interesting. All worker nodes are able to report back as healthy to the control plane. The worker nodes have no validation of communication between one another. This also includes kube-proxy, as it is not a traditional load balancer. Kube-proxy does not perform any health checking that can validate connectivity between workers. The result is that all pods, services, and endpoints remain fully intact. That sounds great, but the issue is that if any pod tries to route requests across the failed zone boundary, that request will fail and kube-proxy does not perform retries. This can be a hassle to detect and/or debug.
One approach to take is to include the addition of some cross-zone network validation components at the worker level. We also recommend monitoring and alerting for your application pods so that you can detect and alert.
There is another secret weapon in this battle. If you do not rely on kube-proxy, but rather a solution that includes things like circuit breakers and automatic retries for timeouts, then you can overcome these situations, and many others, with no modification to your applications or Kubernetes or OpenShift. Service mesh solutions like Istio and Red Hat Service Mesh introduce a full mesh of sidecar containers to every pod. These sidecar containers run Envoy, a small, lightweight, efficient load balancer that includes advanced circuit breaking, load balancing, and retry capabilities. In this type of service mesh configuration, each sidecar is smart enough to stop routing traffic to any endpoint IPs with which it fails to communicate.
Summary
We now have a solid basis for understanding how we can measure and calculate availability of a system. In addition, we have a clear understanding of how Kubernetes provides the tools and architecture to implement a highly available application and service platform. It’s critical to understand how the system functions and what its failure modes are in order for development teams to properly architect their applications and define their Kubernetes and OpenShift resources. SRE and operations teams should familiarize themselves with these failure modes and plan monitoring and alerting accordingly.
With these Kubernetes tools in hand, we should be ready to build a properly architected Kubernetes or OpenShift cluster with highly available services. We also have the equations necessary to derive an SLO for our services based on the choices we have made. How far can we push our availability? Armed with the analysis and tools outlined in this chapter, you have the ability to make an informed decision about your SLOs and create an implementation that meets your goals.
1 Unfortunately, PASS has ceased operations, and the talk given in early 2012 is not available.
2 Gavin McCance, “CERN Data Centre Evolution,” talk presented at SCDC12: Supporting Science with Cloud Computing (November 19, 2012), https://oreil.ly/F1Iw9.
3 The Wikipedia entry on iptables provides more information.
4 The Wikipedia entry on IP Virtual Server provides more information.
5 See the Kubernetes documentation on kube-proxy for more information.
6 See the Kubernetes documentation on Nodes Reliability for more information.
Get Hybrid Cloud Apps with OpenShift and Kubernetes now with the O’Reilly learning platform.
O’Reilly members experience books, live events, courses curated by job role, and more from O’Reilly and nearly 200 top publishers.

