Chapter 1. Connections Are Everything
In an extreme view, the world can be seen as only connections, nothing else. We think of a dictionary as the repository of meaning, but it defines words only in terms of other words. I liked the idea that a piece of information is really defined only by what it’s related to, and how it’s related. There really is little else to meaning. The structure is everything.
Tim Berners-Lee, Weaving the Web: The Original Design and Ultimate Destiny of the World Wide Web (1999), p. 14
The 20th century demonstrated how much we could achieve with spreadsheets and relational databases. Tabular data ruled. The 21st century has already shown us that that isn’t enough. Tables flatten our perspective, showing connections in only two dimensions. In the real world, things are related to and connected to a myriad of other things, and those relationships shape what is and what will happen. To gain full understanding, we need to model these connections.
Personal computers were introduced in the 1970s, but they didn’t take off until they found their first killer apps: financial spreadsheets. VisiCalc on the Apple II and then Lotus 1-2-3 on the IBM PC1 automated the laborious and error-prone calculations that bookkeepers had been doing by hand ever since the invention of writing and arithmetic: adding up rows and columns of figures, and then perhaps performing even more complex statistical calculations.
In 1970, E. F. Codd published his seminal paper on the relational database model. In these early days of databases, a few models were bouncing around, including the network database model. Codd’s relational model was built on something that everyone could identify with and was easy to program: the table.
Moreover, matrix algebra and many statistical methods are also ready-made to work with tables. Both physicists and business analysts used matrices to define and find the optimal solutions to everything from nuclear reactor design to supply chain management. Tables lend themselves to parallel processing; just partition the workload vertically or horizontally. Spreadsheets, relational databases, and matrix algebra: the tabular approach seemed to be the solution to everything.
Then the World Wide Web happened, and everything changed.
Connections Change Everything
The web is more than the internet. The internet began in the early 1970s as a data connection network between selected US research institutions. The World Wide Web, invented by CERN researcher Tim Berners-Lee in 1989, is a set of technologies running on top of the internet that make it much easier to publish, access, and connect data in a format easy for humans to consume and interact with. Browsers, hyperlinks, and web addresses are also hallmarks of the web. At the same time that the web was being developed, governments were loosening their controls on the internet and allowing private companies to expand it. We now have billions of interconnected web pages, connecting people, multimedia, facts, and opinions at a truly global scale. Having data isn’t enough. How the data is structured matters.
What Is a Graph?
As the word “web” started to take on new connotations, so did the word “graph.” For most people, “graph” was synonymous with a line chart that could show something such as a stock’s price over time. Mathematicians had another meaning for the word, however, and as networks and connections started to matter to the business world, the mathematical meaning started to come to the fore.
A graph is an abstract data structure consisting of vertices (or nodes) and connections between vertices called edges. That’s it. A graph is the idea of a network, constructed from these two types of elements. This abstraction allows us to study networks (or graphs) in general, to discover properties, and to devise algorithms to solve general tasks. Graph theory and graph analytics provided organizations with the tools they needed to leverage the sudden abundance of connected data.
In Figure 1-1, we can see the network of relationships between the actors and directors of Star Wars (1977) and The Empire Strikes Back (1980). This is easily modelable as a graph with different types of edges connecting the different types of vertices. Actors and movies can have an acted_in vertex connecting them, movies and other movies can be connected by an is_sequel_of vertex, and movies and directors can have a directed_by edge connection.
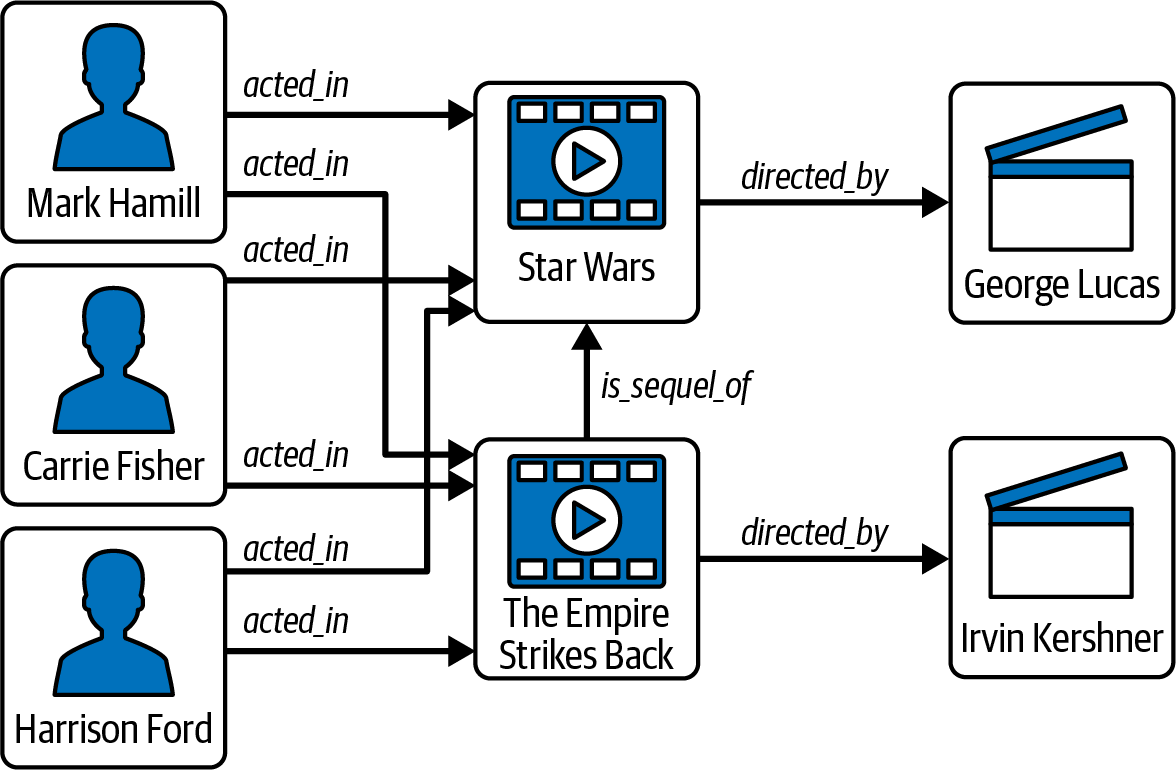
Figure 1-1. A graph showing some key players and connections in early Star Wars films
Why Graphs Matter
The web showed us that sometimes we accomplish more by having varied data that is linked together than by trying to merge it all into a few rigid tables. It also showed us that connections themselves are a form of information. We have a limitless number of types of relationships: parent–child, purchaser–product, friend–friend, and so on. As Berners-Lee observed, we get meaning from connections. When we know someone is a parent, we can infer that they have had certain life experiences and have certain concerns. We can also make informed guesses at how the parent and child will interact relative to each other.
The web, however, only highlighted what has always been true: data relationships matter when representing data and when analyzing data. Graphs can embody the informatiooonal content of relationships better than tables. This enriched data format is better at representing complex information, and when it comes to analytics, it produces more insightful results. Business-oriented data analysts appreciate the intuitive aspect of seeing relationships visualized as a graph, and data scientists find that the richer content yields more accurate machine learning models. As a bonus, graph databases often perform faster than relational databases when working on tasks involving searching multiple levels of connections (or multiple hops).
Structure matters
The founders of Google recognized that the web would become too large for anyone to grasp. We would need tools to help us search for and recommend pages. A key component of Google’s early success was PageRank, an algorithm that models the internet as a set of interconnected pages and decides which are the most influential or authoritative pages—based solely on their pattern of interconnection.
Over the years, search engines have become better and better at inferring from our queries what we would really like to know and would find useful. One of Google’s tools for that is its Knowledge Graph, an interconnected set of categorized and tagged facts and concepts, harvested from the broader web. After analyzing the user’s query to understand not just the surface words but the implied categories and objectives, Google searches its Knowledge Graph to find the best matching facts and then presents them in a well-formatted sidebar. Only a graph has the flexibility and expressiveness to make sense of this universe of facts.
Communities matter
Facebook started as a social networking app for college students; it’s grown to become the world’s largest online social network. It’s self-evident that Facebook cares about networks and graphs. From each user’s perspective, there is oneself and one’s set of friends. Though we act individually, people will naturally tend to gather into communities that evolve and have influence as though they were living entities themselves. Communities are powerful influences on what information we receive and how we form opinions. Businesses leverage community behavior for promoting their products. People also use social networks to promote political agendas. Detecting these communities is essential to understand the social dynamics, but you won’t see the communities in a tabular view.
Patterns of connections matter
The same information can be presented either in tabular form or in graph form, but the graph form shows us things that the table obscures. Think of a family tree. We could list all the parent–child relationships in a table, but the table would miss important patterns that span multiple relationships: family, grandchildren, cousins.
A less obvious example is a graph of financial transactions. Financial institutions and vendors look for particular patterns of transactions that suggest possible fraudulent or money laundering activity. One pattern is a large amount of money being transferred from party to party, with a high percentage of the money coming back to the origin: a closed loop. Figure 1-2 shows such loops, extracted from a graph database containing millions of transactions, from our financial fraud example in Chapter 5. Other patterns can be linear or Y-shaped; anything is possible. The pattern depends on the nature of the data and the question of interest.
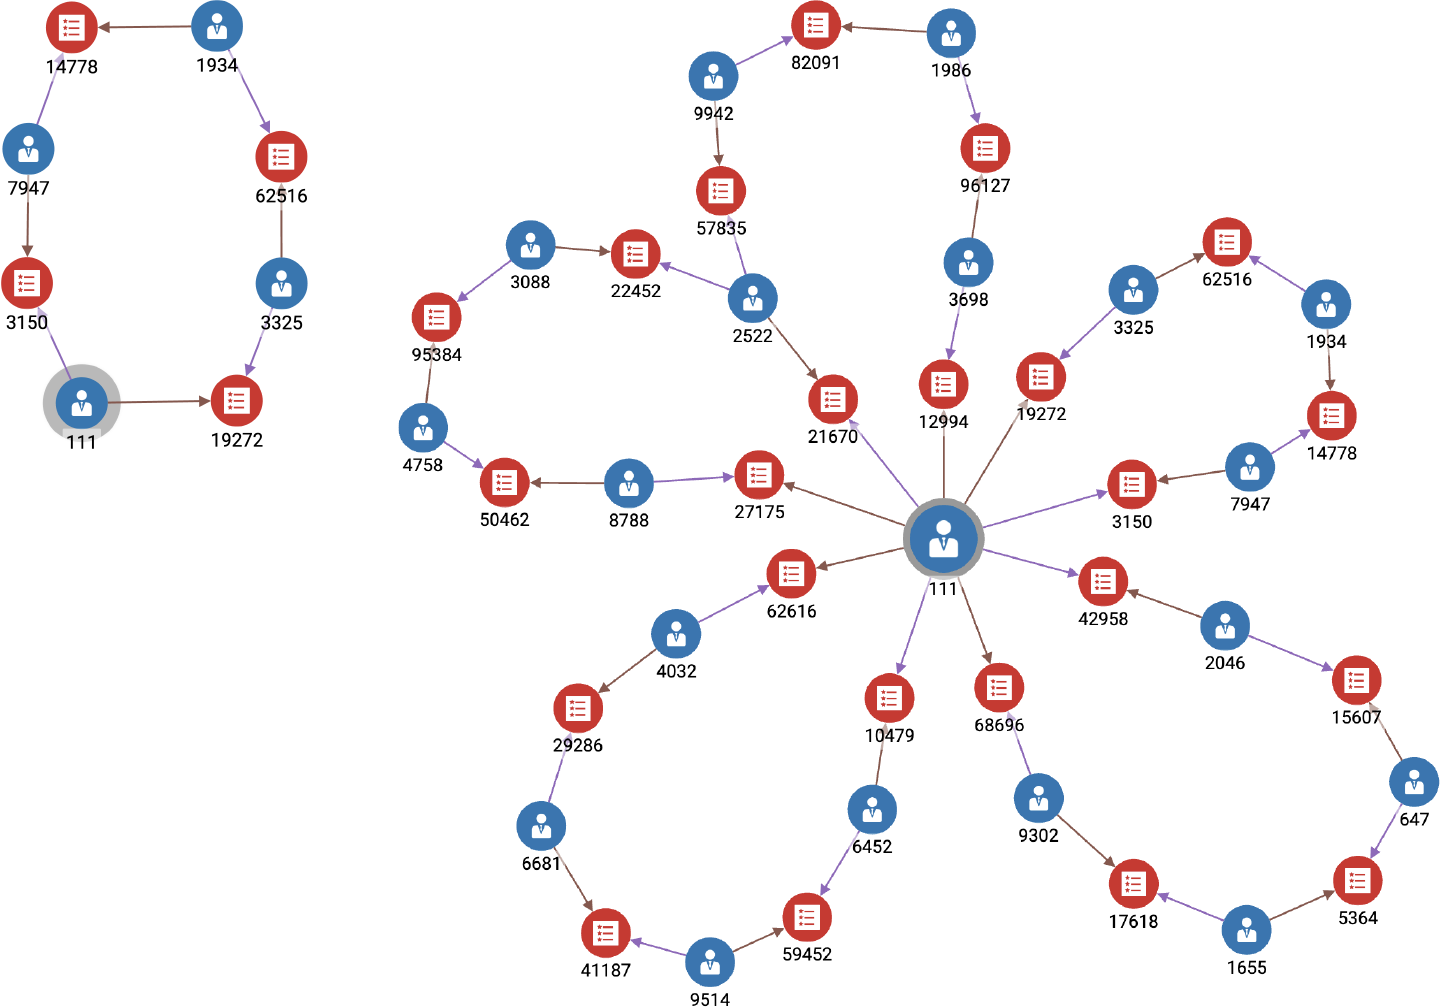
Figure 1-2. Graph search results showing sequences of transactions in a closed loop (see a larger version of this figure at https://oreil.ly/gpam0102)
Patterns can depend not only on the shape but on the type of vertex and type of edge. Figure 1-2 has two types of vertices: Accounts and Transactions (yes, the Transactions are vertices, not the edges). If we chose, we could separate Person and Account into separate entities. A person can be associated with multiple accounts. Breaking it up like this enables us to analyze the behavior of a Person, not just an Account. Modeling important concepts as vertex types enables richer search analytical capability, as we will see in later chapters.
Edges Outperform Table Joins
It’s true that you can represent vertices as tables and edges as tables. What is actually different about a graph, and why do we claim it is faster for multihop operations? First of all, the graph is not just the visualization. We visualize data for human convenience, but the computer doesn’t need this visual aspect at all.
The performance advantage of graphs comes down to the mechanics of how searching for and utilizing connections actually takes place in a relational database versus a graph database. In a relational database, there is no link between tables until you run a query. Yes, if you have declared and enforced a foreign key in one table to reference another table, then you know that the foreign key column’s value will correspond to a primary key value in its related table. That just means that two different tables store duplicate data, but you still have to seek out those matching records.
Consider a simple database that tracks purchases by customers. We have three tables: Person, Item, and Purchases, shown in Figure 1-3. Suppose we want to know all the purchases that Person B has made. The Purchases table is organized by date, not by Person, so it seems we need to scan the entire table to find Person B’s purchases. For large databases, this is very inefficient.
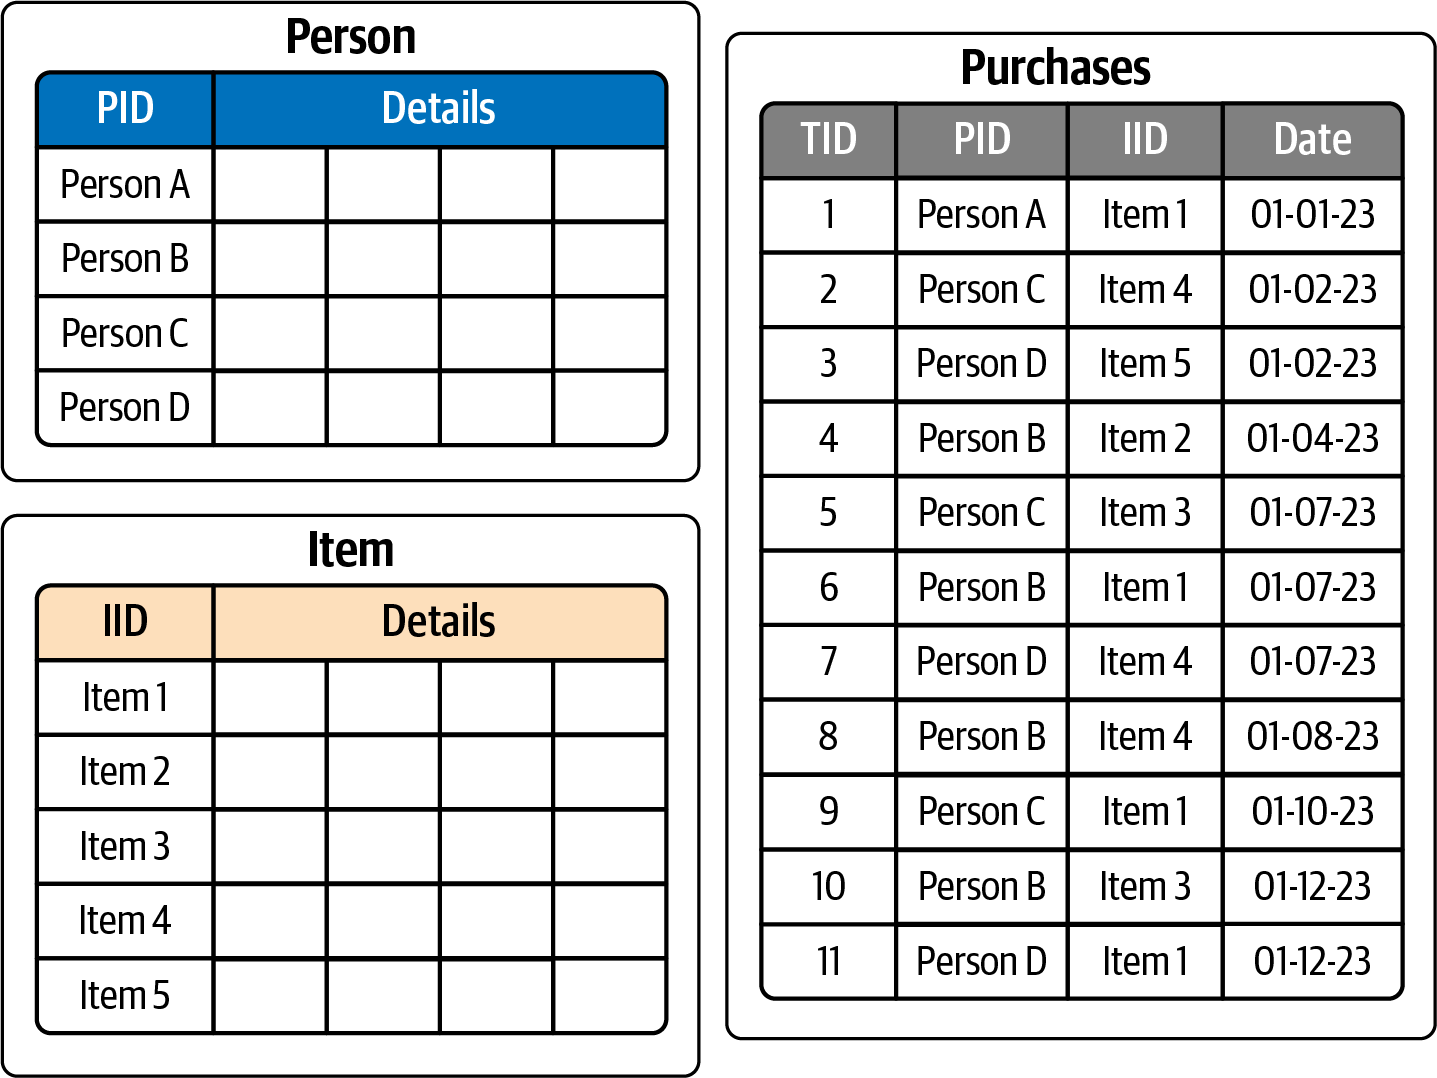
Figure 1-3. Relational table structure for Person-Purchases-Item database
This is a common problem, so relational databases have created a solution: secondary indexes. Just like a reference book’s index can tell you the page numbers of where certain key topics appear, a table index tells you the row address where certain column values appear. Figure 1-4 sketches out the idea of indexes for the PID (Person ID) and IID (Item ID) columns of the Purchases table. Great, now we know Person B’s purchases are listed in rows 4, 6, 8, and 10 of the table. There are still some trade-offs, however. It takes time and storage space to create an index and then to maintain it as the database evolves, and it is still an extra step to go to the index rather than going directly to the data rows that have what you want. The index itself is a table. How quickly can we find Person B among all the persons?
Without index:
-
Read each row in Purchases table (slow and not scalable).
With index:
-
Go to a secondary index for the Purchases table.
-
Find the row of interest (could be fast).
-
Use the index.
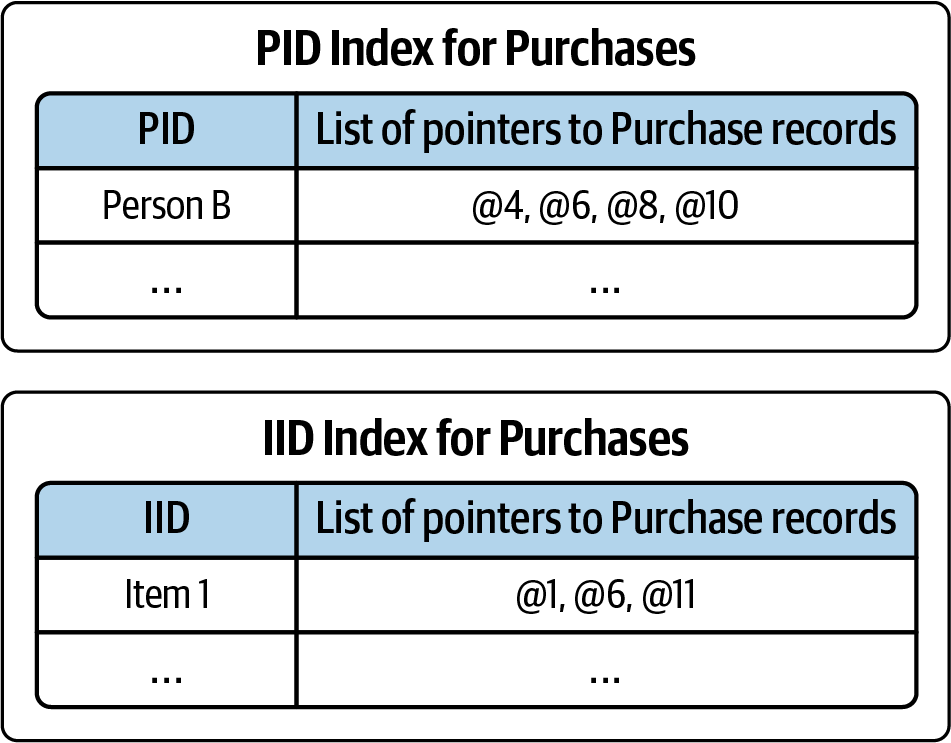
Figure 1-4. Secondary indexes for Purchases table
A graph database or graph analytics platform eliminates the problem of searching through tables and building indexes in order to find connections: the connections are already there.
In a graph, an edge points directly to its endpoint vertices. There is no need to read through a table, and there is no need to build an extra indexing structure. While the speed difference may be modest for one connection, a graph can be hundreds of times faster when you want to repeat this across a chain of connections and when you need to join many data records, such as entire tables. For example, suppose we want to answer this question: “Find the items that were purchased by persons who also bought the item that you just bought.” Figure 1-5 displays exactly this, where “you” are Person A:
-
Person A bought Item 1.
-
Persons B, C, and D also bought Item 1.
-
Persons B, C, and D also bought Items 2, 3, 4, and 5.
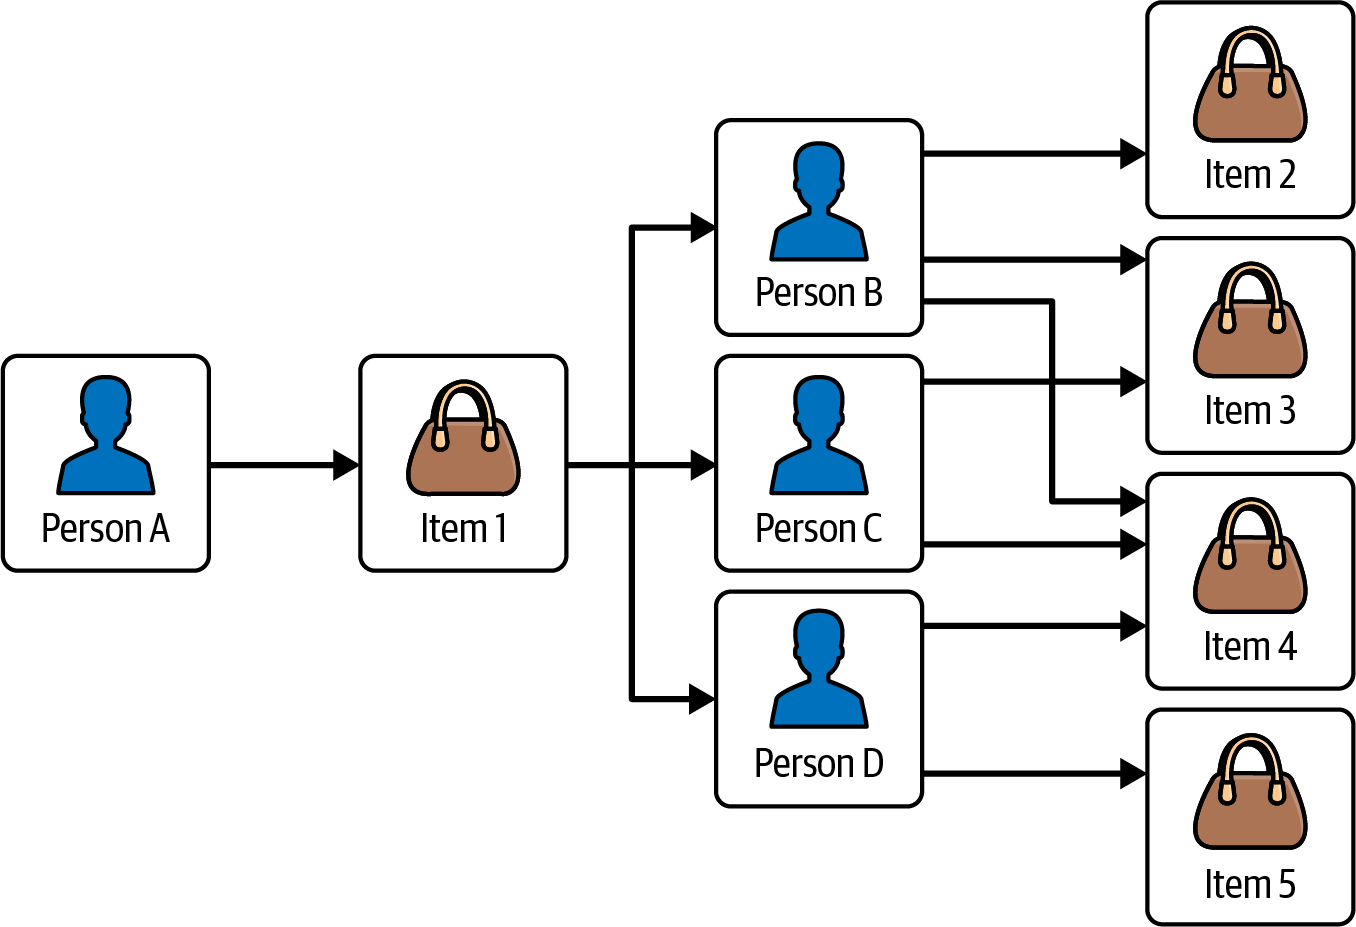
Figure 1-5. Graph structure for Person-Purchases-Item database
This is a three-hop query—pretty simple for a graph. We traverse a total of 9 vertices and 11 edges to answer this question.
In a table-based system, this would take three table joins. Good query optimization and indexing will reduce the amount of work so that it comes close to the very efficient graph model, but at the cost of going back and forth between the data tables and the indexes and performing the index lookups. The graph doesn’t need indexes for this query because the connections are already built-in and optimized.
One cautionary note: the full performance benefit is only realized on “native” graphs, which are designed from the ground up to be graphs. It is possible to build a graph system on top of a tabular database. That combination will function like a graph but will not perform like one.
Graph Analytics and Machine Learning
Perhaps the biggest benefit of graph-structured data is how it can improve analytics results and performance. We gather and store data for many reasons. Sometimes all we want to do is to recall a particular bit of information exactly as it was recorded before. For example, a credit card company records each of your transactions. Each month, it sends you a statement that lists each of your transactions and payments. Data tables are sufficient for this simple listing and summing.
Businesses these days need to do more with the data than just these baseline tasks. They need to find and capture more revenue opportunities, cut losses from fraud and waste, and reduce risk. Seeing patterns in their data can help with all these needs. For example, what is your credit card spending pattern over time? Can they categorize you with other persons with similar patterns? How can the business use social network relationships to serve its interests, such as promoting business through recommendations or predicting behavior based on family connections? The business has customer information from multiple sources. Data differences such as typos, differences in allowed characters, name or address changes, and customers’ intentional use of different online personae can make them seem like multiple different persons. Can the business use analytics to detect and integrate these records? Are you committing card fraud, or has someone stolen your card number?
Analysis is about seeing patterns. Patterns are collections of relationships structured in a certain way, which is also exactly what graphs are. A pattern can have both structural and quantitative aspects, such as “the average household has 1.4 pets.” The structural part (the housing relationships that define a household, and the relationship between certain animals and households) can be encoded as a graph pattern query. Graph databases and graph analytics platforms can do quantitative analysis, too, of course. Part 2 of this book will help you to understand and apply graph analytics.
Graph-Enhanced Machine Learning
Machine learning is using past data to detect a pattern that might help us predict future activity. Since graphs are the natural way to represent, store, and analyze patterns, it stands to reason that graphs will help us make better predictions.
Conventional supervised machine learning makes some assumptions about the data that simplifies that analysis and that works well with tabular data. First, we assume that every data point exists in isolation: every record in our dataset is statistically independent of every other record. Second, we assume that the data points are identically distributed when creating supervised machine learning models. So we believe that every sample comes from the same distribution. The notion for these two assumptions is known as independent and identically distributed (i.i.d.). However, real-life events do not always adhere to the phenomenon of i.i.d.
To get the most accurate machine learning models, we need to take into account the relationships between data points. For example, when we model a social network with people interacting with one another, people who share the same friends are more likely to get into contact with one another than with others who do not have common friends. Graphs allow us to explicitly leverage the relations between the data points between common friends because we model the relationships and not just the nodes independently.
There are several ways that graph data can improve machine learning. One way is to use selected graph algorithms or other graph queries to assess the relational characteristics of data points (vertices). For example, the PageRank scores of parties in a transactional graph have helped to predict fraudsters. You can use these graph-based features that embody the relationships between data points to enrich your existing feature sets while retaining your existing model training methods.
Instead of following this traditional machine learning approach, where features are designed and handpicked during the feature engineering phase, you can generate features from the graph automatically by learning the graph’s structure. This so-called graph representation learning alleviates the need for feature engineering. It is less dependent on the analyst’s domain knowledge to design meaningful features as it follows a data-driven approach. There are two flavors of graph representation learning: embedding and graph neutral networks. Embedding techniques produce vectors associated with each data point. We can pass these embedding vectors into any downstream machine learning algorithm to include them in our prediction task. Graph neural networks (GNNs) are analogous to conventional neural networks, except that they take the graph’s connections into account during the training process. It is only a slight exaggeration to say that GNNs do what other neural networks do, with the potential for better results. Part 3 of this book is dedicated to graph-enhanced machine learning.
Chapter Summary
In this chapter, we’ve learned that a graph is an abstract data structure consisting of vertices and connections between those vertices called edges. Graphs enable us to connect data together, to discover patterns and communities better than relational databases. Edges perform better than table joins because edges directly connect the vertices to their endpoint, making it unnecessary to read through a table and build an extra indexing structure.
Graph analytics is powerful because it efficiently explores and identifies patterns in the data. Graph analytics can improve analytics performance and uncover things not discovered by other methods.
Lastly, we have seen that graph-structured data helps us to make better predictions with machine learning models. Graph allows us to leverage relationships between data points explicitly, making our model closer to the natural phenomenon we are investigating. Modeling the relationships in such a way will enable us to learn graph representations that automatically generate features from the graph instead of hand-picking features during the feature engineering phase.
In the next chapter, we will expand your understanding of graph concepts and terminology and get you started on your way to see the world through graph-shaped lenses.
1 “Killer Application,” Wikipedia, last updated May 14, 2023, https://en.wikipedia.org/wiki/Killer_application.
Get Graph-Powered Analytics and Machine Learning with TigerGraph now with the O’Reilly learning platform.
O’Reilly members experience books, live events, courses curated by job role, and more from O’Reilly and nearly 200 top publishers.

