By now, you should be familiar with the basic use of Google Maps for finding driving directions. However, the flexibility of Google Maps offers plenty more opportunities for figuring out how to get from point A to point B. We’ll see that Google Maps can assist you in finding the best gasoline prices, avoiding traffic congestion, and even avoiding the use of an automobile altogether!
In this day and age, one of the most useful tools of the digital cartographer is her Global Positioning System, or GPS, receiver. We’re also going to explore several useful combinations of GPS and Google Maps, including loading routes from Google Maps into your GPS receiver, plotting your travels from the GPS receiver’s tracklog within Google Maps, and how to use your GPS to make Google Maps of local wireless network coverage.
As a bonus, we’ll also see how Google Maps saved one man from an expensive traffic fine!
Drive your mouse for cheaper fuel—and then catch a movie.
My friends in construction spend a lot of time driving up and down Highway 101, and they all know where the cheap gas is. I spend my time sitting in front of a computer, but thanks to http://www.ahding.com/cheapgas/,I also know where the cheap gas flows.
The Cheap Gas site in Figure 4-1 uses data from http://www.gasbuddy.com/, which aggregates user reports of gas prices so that everyone can benefit. You can also contribute to the Gas Buddy web site by becoming one of their volunteer spotters, thus gratifying your natural human desire to tell other people something that they don’t know.
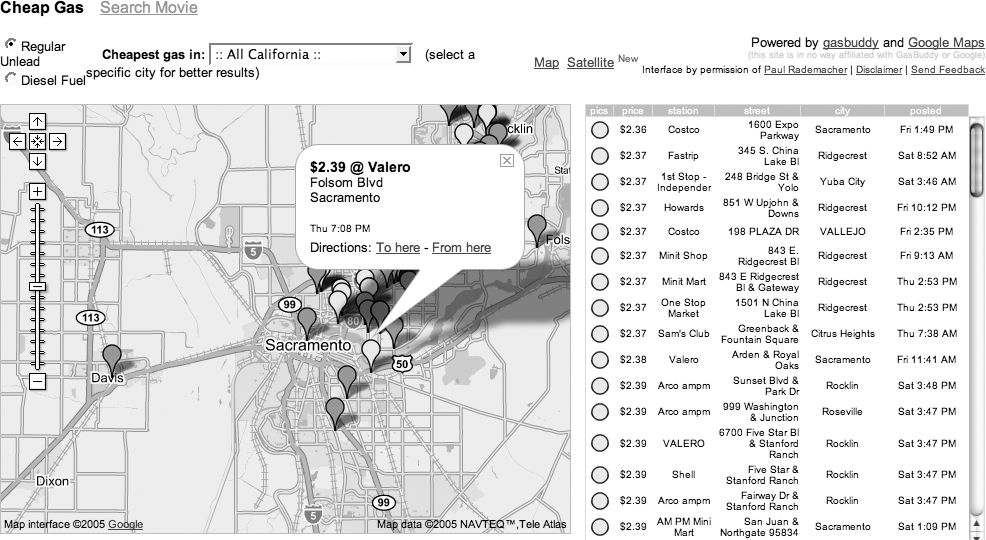
After you pick a city, the site lists gas stations on the side bar and markers on the map. The green icons represent the lowest half of gas stations by price and the red icons are the high half. As shown in Figure 4-1, each station has a marker with more information.
What is interesting about this example is the integration with http://www.gasbuddy.com/. GasBuddy.com provides the database of cheap gas, but is not run by cartographers, so Ahding.com was able to create the now-classic mashup.
What causes gas price variations? An interesting project in geospatial analysis would be to see if one could draw any conclusions about why there is such variation in prices from station to station. Overlaying different thematic layers and doing calculations based on multiple data sets is exactly what a Geographic Information System (GIS) is all about, but Google Maps has shown that there has been an enormous demand for an easy-to-use “put a push pin on a map” solution. That is now a solved problem!
Tip
Once you get your fuel price woes straightened out, you can click on the Movies link at http://www.ahding.com/movie/ and use the same basic interface to query the Internet Movie Database (http://www.imdb.com) to check out local movies.
Another low-cost-gasoline solution is GasWatch by Adrian Gonzales, which is available from http://www.widgetgallery.com/view.php?widget=36500. This is a widget that will run under Konfabulator for Windows and Mac OS X (the grass is greener on both sides) and show you the best prices for gas. "GasWatch shows you the lowest priced gas in your ZIP Code. It also provides a handy button to show a map to the gas station. Maps for Mac users provided by Google Maps.”
To install the widget you need Konfabulator (http://www.konfabulator.com/download). Konfabulator is a JavaScript environment for your desktop. People can write small programs called widgets, and you can run them under Konfabulator.
For Mac OS X, download the disk image ( .dmg) file. When it is finished downloading, mount the .dmg by double-clicking on it. When the folder opens, drag the icon into your applications folder. Now you can download the GasWatch widget. Double-click and it will prompt for your ZIP Code, and then sit quietly on your Desktop, as shown in Figure 4-2, letting you know the current cheapest local gas prices.
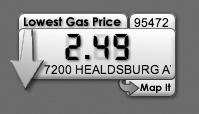
Clicking on the Map button will bring up Google Maps with this address highlighted. This is a great example of the value to be gained from connecting different sources of data in new ways.
A few Google Maps mashups to keep you and your car out of trouble.
According to statistics published by the BBC in 2002, there are nearly half a million traffic jams in Britain every year—or more than 10,000 a week—and those numbers were on the rise. A quarter of Britain’s main roads are jammed every day, and nearly 1 in 4 residents of the U.K, have to contend with heavy automobile traffic daily. In our car-obsessed United States, automobile commuters spent an average of 47 hours delayed by traffic congestion in 2003 alone, according to estimates published by the Texas Transportation Institute. In the ten largest metro areas in the States, that figure goes up to an average of 61 hours a year. That’s two and a half whole days out of every year, spent by the average driver, just sitting in the car, idling in bumper-to-bumper gridlock!
Fortunately, the hackability of Google Maps offers hardy urban dwellers superior access to timely information in this fast-paced era! Almost as soon as Google’s flashy road maps hit the Web, hackers went to work plotting out the miasma of traffic congestion that plagues the lives of so many in the urbanized western world.
The best Googlified traffic maps of the States come from the Google-Traffic. com Traffic-Weather Maps site at http://supergreg.hopto.org/google-traffic.com/. Using RSS from the Traffic.com web site, “Super” Greg Sadetsky has assembled an informative service that reports the locations of traffic conditions in major U.S. cities. From the front page, you can select your city of interest, and click the Go! button to be taken directly to the map. Figure 4-3 shows the current traffic conditions in Philadelphia.
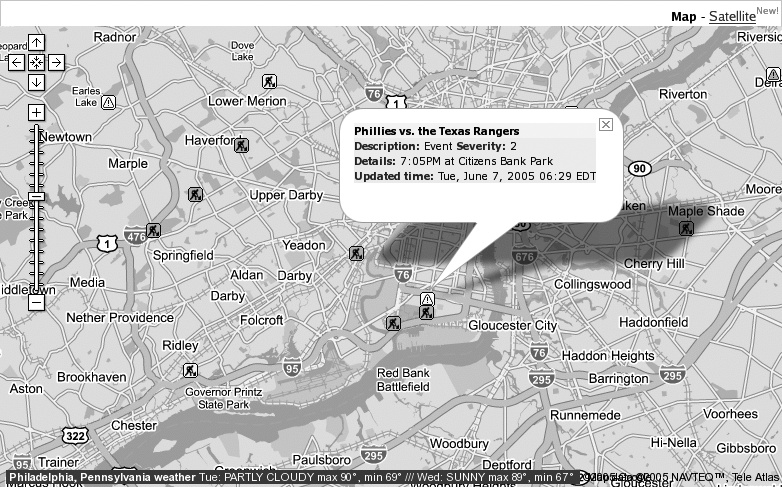
Custom icons show the type of delay—either construction or some kind of incident—and the color of the icon indicates the severity of the delay, from yellow to red. Clicking on any of the icons loads a callout that displays the details of the traffic delay. Miraculously, the Schuylkill Expressway (I-76) is clear this morning—but it’s early yet, only about 6:30 A.M.—while the Broad Street exit of I-95 should plainly be avoided, especially later this evening when baseball fans will flock to Veterans Stadium to watch the home team lose to the Rangers.
Tip
Naturally, you can click on the Satellite link to get the same view of current traffic conditions, laid over satellite imagery, instead of road maps. (Although it’s not entirely clear what utility this feature actually offers, it’s still pretty darn cool.)
You can link to these maps, bookmark them, or embed them on your own page in an HTML iframe, using the following URL format, substituting your city of interest for “Philadelphia,+PA”:
http://supergreg.hopto.org/google-traffic.com/traffic.php?csz=Philadelphia,+PA
Traffic details for 23 major cities are offered on the site, including Atlanta, Baltimore, Boston, Chicago, Dallas, Detroit, Houston, Los Angeles, Miami, Minneapolis, New York, Orlando, Philadelphia, Phoenix, Pittsburgh, Providence, Sacramento, San Diego, San Francisco, Seattle, St. Louis, Tampa, and Washington, D.C. As a bonus, weather information for the selected city is also pulled from an RSS feed and is embedded in a small horizontal bar at the bottom edge of the map. If you don’t care for this feature, you can turn it off by adding &weather=0 to the URL for your city.
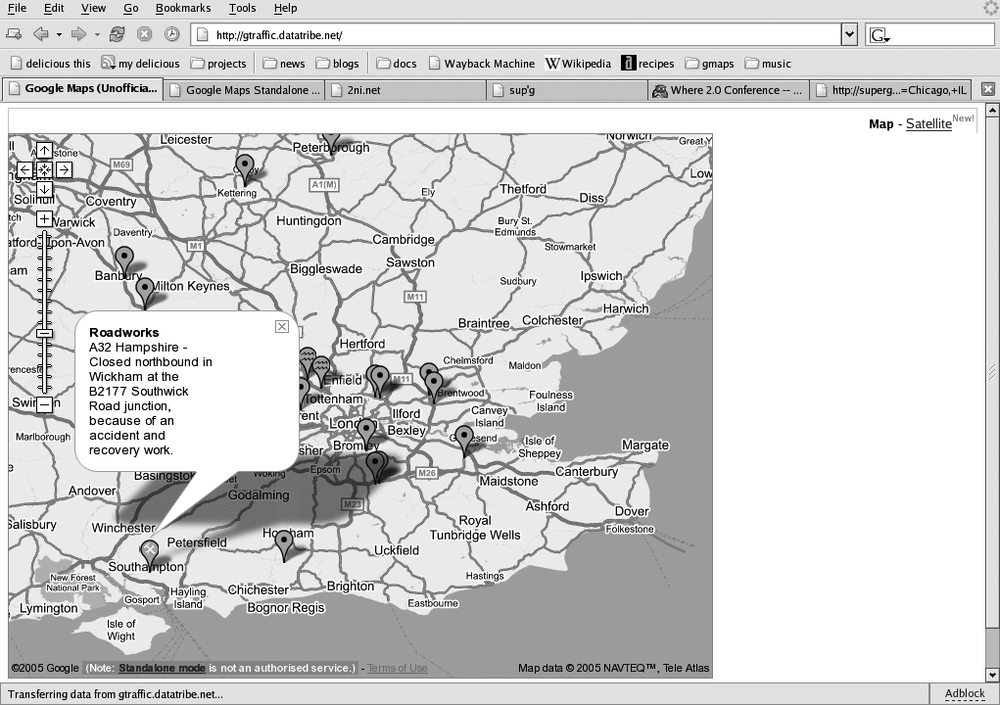
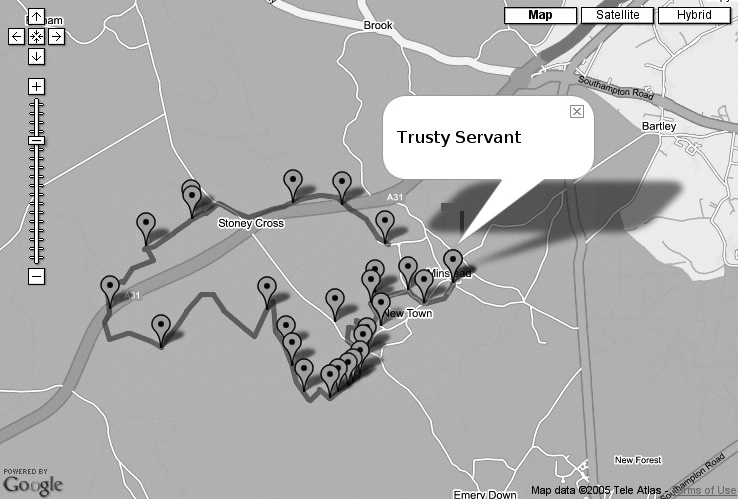
The opening of the BBC Backstage service, which offers access to RSS feeds of many different kinds of information from the BBC, was almost perfectly timed with the initial release of Google Maps UK. It didn’t take long at all for several hackers to leap to the challenge of plotting the BBC’s traffic feeds on Google’s new road maps of Britain. One solid example is Andrew Newdigate’s TrafficMeister at http://gtraffic.datatribe.net/, which offers the by-now-familiar Google Maps view of the entire UK, with custom, clickable icons indicating the type of delay. Figure 4-4 shows an example of roadwork near Southampton.
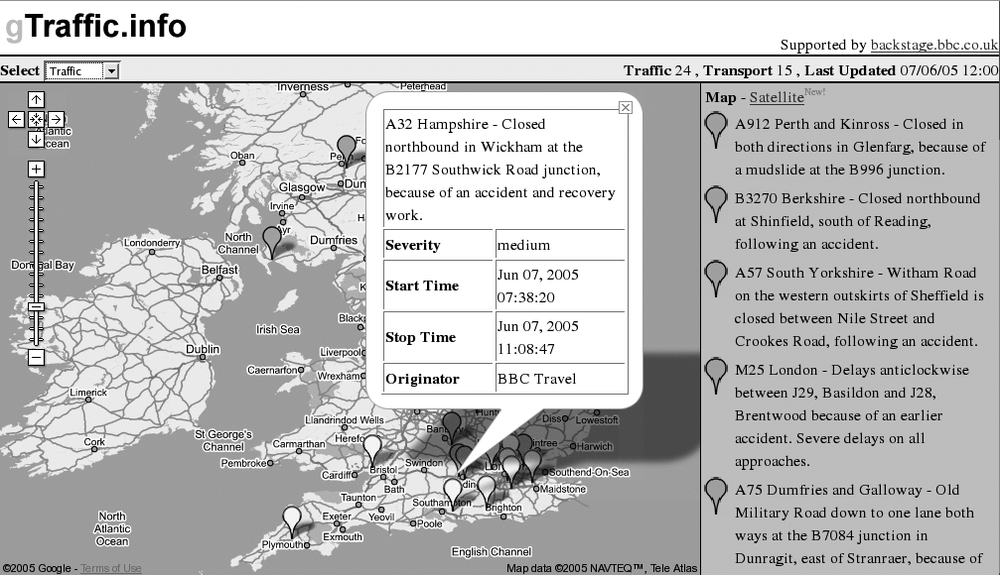
Another interesting take on the same idea can be found on Alistair Rutherford’s gTraffic site at http://www.gtraffic.info/, which uses colored icons to indicate the severity of the delay. Additionally, the gTraffic site displays the latest alerts in chronological order down the right side of the page. Figure 4-5 shows the same roadwork delay near Southampton on gTraffic.info.
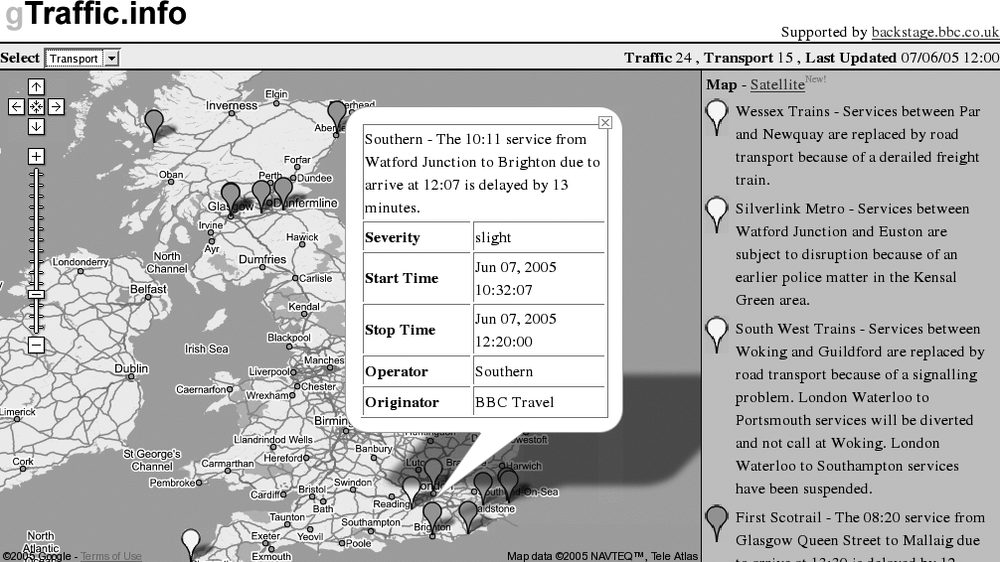
Potentially even more useful to residents of the United Kingdom, where petrol is more expensive and private automobiles not quite the institution they are in the States, is the drop-down box at the top of the page that offers a Transport option. Figure 4-6 illustrates the increasingly dismal state of British rail in the modern era of transport privatization.
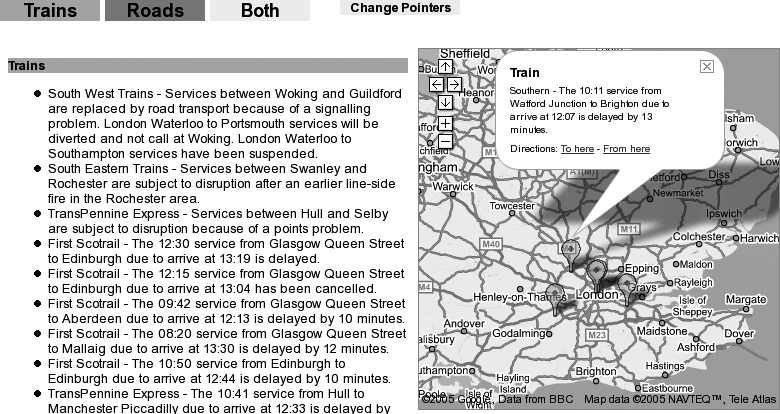
A similar take on this sad state of affairs can be found on Duncan Barclay’s site at http://backstage.min-data.co.uk/travel/, where you can also view either road or rail delays. Figure 4-7 shows the same delayed train service, this time on the min-data.co.uk site. Interestingly, on this map, the marker has been placed at Watford Junction, where the train departed from, rather than Brighton, where its arrival has been delayed.
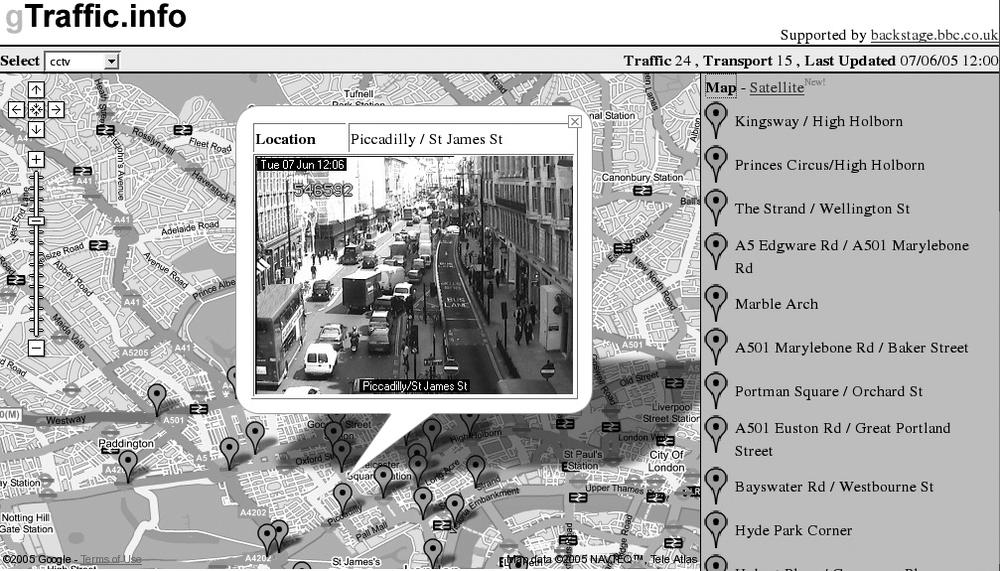
The eagle-eyed reader will probably have already discovered this, but at least a couple of sites have gone as far as remixing Google Maps with the BBC’s webcams of traffic hotspots in surveillance-happy London. gTraffic.info has a CCTV option in the drop-down on the upper left; Figure 4-8 shows the situation this morning outside St. James’s Park, along Piccadilly.
The amazing gmaptrack site offers a similar view at http://www.gmaptrack.com/map/locations/24/44, where you can also click a link to see the image at its source on the BBC London Jam Cams web site. On either site, you can click the links on the right to view the camera image in a callout over the map location—probably best to take a bicycle this morning!
Several other web sites that offer this kind of experimental traffic map can be found on the BBC Backstage web site at http://backstage.bbc.co.uk/. Although web-based maps of traffic conditions are nothing new, the ease with which hackers have been able to remix RSS feeds of traffic reports with Google’s stylish mapping interface is a testament to the possibilities inherent in open systems loosely joined by open protocols, even before Google published its Maps API!
Finding your way around local public transit just got a lot easier.
You have an appointment in town somewhere, and you’ve just discovered from “Stay Out of Traffic Jams” [Hack #30] that it’s definitely not worth driving this morning. You fire up your local public transit authority’s web site, download their sketchy schematic map of the subway or bus system, and then discover to your chagrin that the map gives you no idea of which stop on which route is actually closest to your destination. Does this sound familiar? If the Google Maps hackers get their way, your experience will soon be a thing of the past.
As of this writing, Google Maps–enhanced public transportation maps are only available for a few cities in North America. Here’s a rundown of what’s available.
The first stop on our tour of Google Maps transit mashups is David Pritchard’s Vancouver Transit Map for the public transportation system in Vancouver, BC. The Vancouver Transit Map lives on the Web at http://www.david.enigmati.ca/maps/transit.html. As you can see from Figure 4-9, the site uses Google Maps polylines to depict the major transit routes in town.
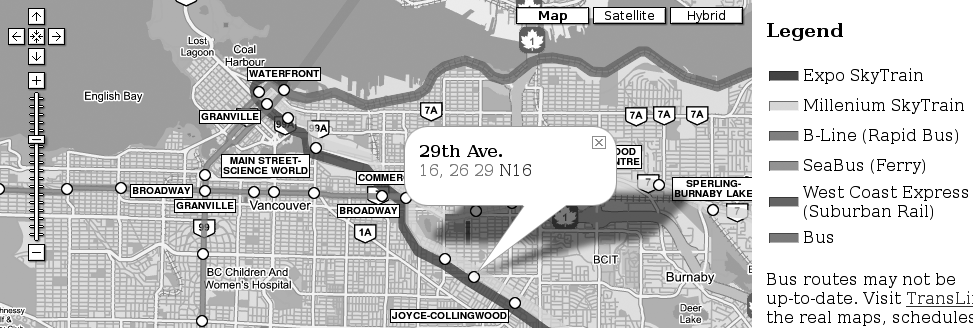
The transit line stops are depicted with circles, which open an info window showing the name of the stop and the intersecting bus lines. The text labels showing the names of major stops at different zoom levels are also clickable, and make for a nice touch in terms of the map’s readability.
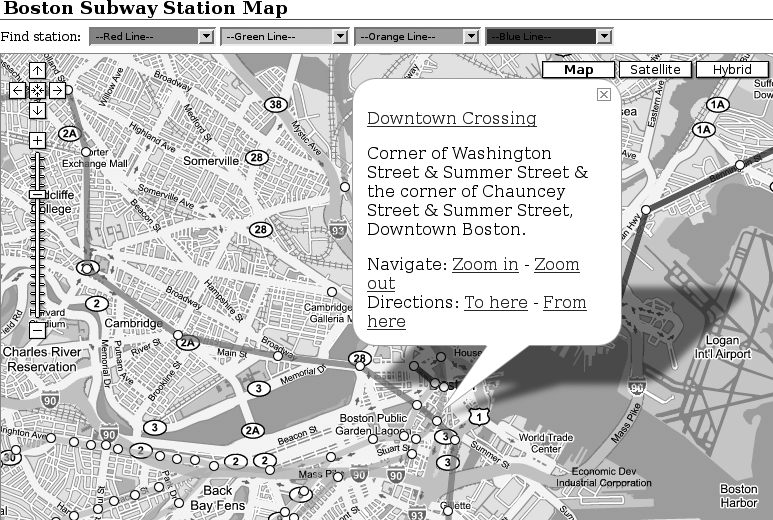
Matt King’s Boston Subway Station Map at http://www.thrall.net/maps/mbta.html takes something of a similar approach, as you can see in Figure 4-10. Instead of the station labels on the map, along the top we get a row of color-coded drop-down boxes, organized by subway line, to help find individual stations.
Clicking any of the station markers opens an info window with the station name, street address, and navigational links. The “To here” and “From here” driving directions links are pretty self-explanatory, but the “Zoom in” and “Zoom out” navigation links are special. If the map is zoomed out, clicking “Zoom in” will cause the map to iteratively zoom in, one level at a time, on a delay interval, so that you can situate the subway stop in the larger geographic context of Boston. Once zoomed in, the “Zoom out” link performs the reverse operation. This progressive zoom-in/zoom-out is referred to by digital cartographers as ballistic zoom.
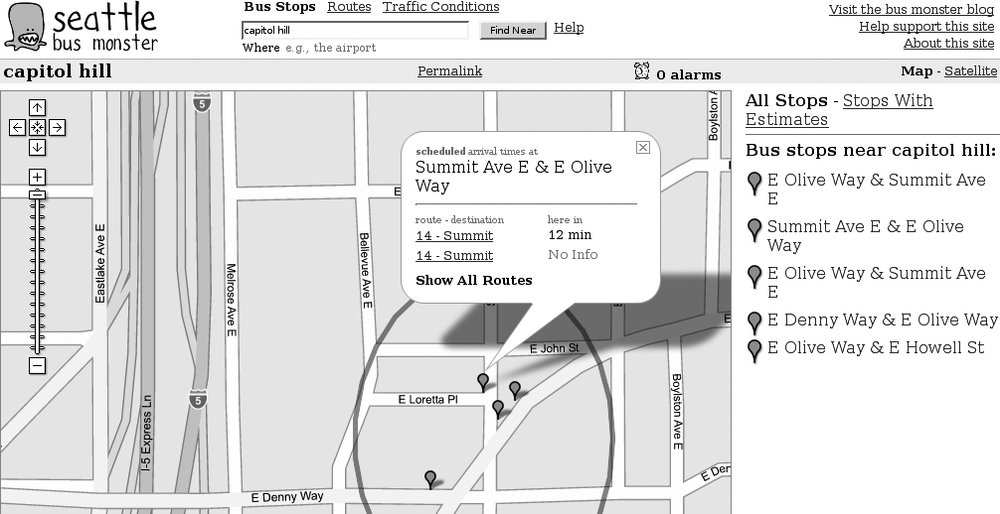
Chris Smoak’s Seattle Bus Monster site at http://www.busmonster.com/ is probably the most feature-rich of the Google Maps transit mashups we’ve seen so far. The site has three basic sections: Bus Stops, Routes, and Traffic Conditions. In the Bus Stops section, you type in an address, intersection, or landmark to find bus stops near that location, as shown in Figure 4-11. Clicking on an individual bus stop shows, almost miraculously, the expected arrival times for the next few buses on that route (if available).
In the Routes section, you can type in route numbers to view routes, stops along those routes, and current bus locations. The Traffic Conditions section shows hundreds of traffic cams in the area.
Perhaps the most remarkable feature of this site is that, in the Routes view, you can click on a particular bus stop and set an “alarm” for that scheduled bus arrival. Once you’ve created the alarm, you can click on the alarm icon in the info window, and you’ll be prompted for a number of minutes lead time and an email address to send the alarm to. If your cellular provider relays email to your phone as text messages—and most do—you can enter the email address of your phone and be notified in real time when the bus is on its way!
The Bus Monster site makes heavy use of the XMaps extension to the Google Maps API [Hack #64] .
Naturally, the Big Apple, with one of the most extensive public transportation systems in North America, wouldn’t be without at least one Google Maps transit mashup. Will James is responsible for the NYC Subway Map at http://www.onnyturf.com/subwaymap.php. The basic functionality of this map is similar to that of other maps—click on a station, and an info window pops up, with the station name and one or more icons provide links to the MTA’s web page for the relevant subway lines that stop at that station, as shown in Figure 4-12.
What’s exceptional about the NYC Subway Map is that, unlike the other transit mashups, it doesn’t use the Google Maps GPolyLine class to depict the subway lines. Instead, Will decided that the variety of colors in the standard MTA subway map meshed poorly with the default color scheme of Google Maps, and that the map would look better—and be more read-able—if he made his own background tiles. An additional map type control marked “SUBWAY” at the top-right corner of the map, allows you to switch back and forth between that and the traditional Google Maps backgrounds. Will’s process for generating custom Google Maps background tiles is described in Chapter 7.
Adrian Holovaty’s Chicago Transit Authority map page (http://www.holovaty.com/blog/archive/2005/04/19/0216 deserves special mention for being one of the earlier Google Maps mashups. Instead of providing an integrated interface using the Google Maps API, the CTA map relied on a Firefox extension to integrate Adrian’s custom map tiles into Google Maps on the client side at the right time and place (namely, zoom level 5 over Chicago). Unfortunately, as of this writing, the extension no longer works, probably due to subsequent changes to the Google Maps interface.

Perform reverse lookups with Google Phonebook and Google Maps.
Have a phone number, but you don’t know where it originates? You can use Google to get an address, and then Google Maps to pinpoint it. Your search engine is a phone book? Why not? Phone numbers are just another thing that can be searched on!
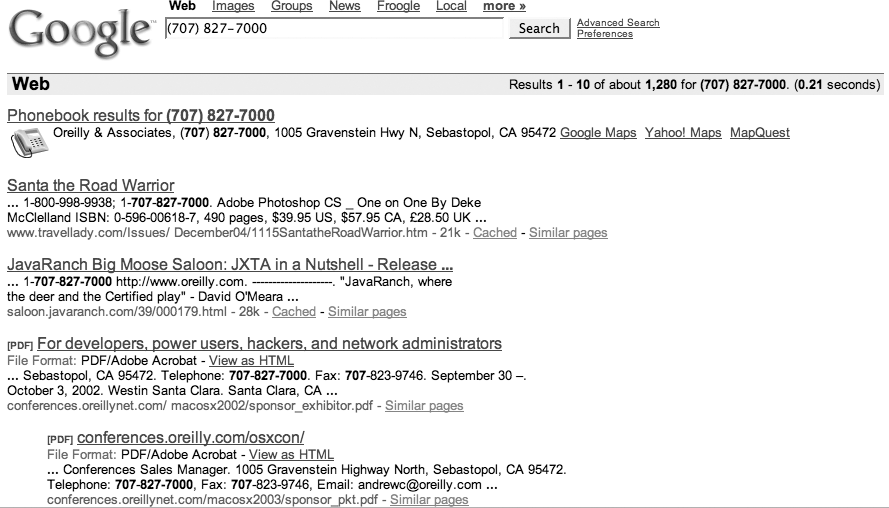
When you enter a phone number into the search box on http://google.com, the first link is to the Google Phonebook (assuming that the number is found). For example, doing a search on the U.S. phone number (707) 827-7000 brings up the results shown in Figure 4-13. The Google phone book is very forgiving. You can search for 707 827-7000 or 707-827-7000 or even 7078277000 and Phonebook will still work.
Tip
Interestingly enough, you can’t search for a phone number directly through the Google Maps search box: you have to go through the regular Google Search first!
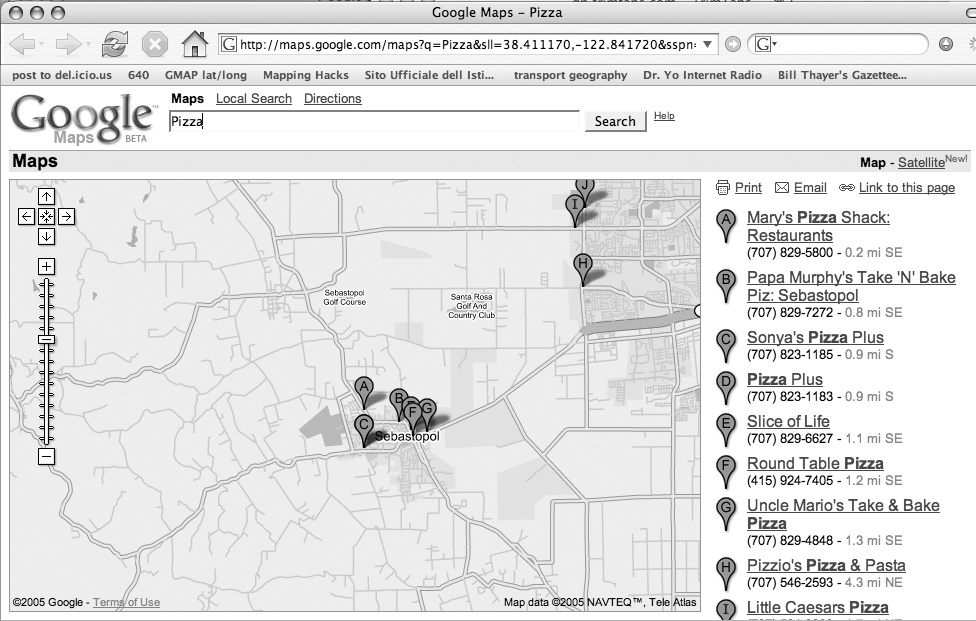
The Google Phonebook is mapping-service agnostic, showing links to this address in Google Maps, Yahoo! Maps, and MapQuest. If you click on the Google Maps link, you can do a local search for something common, such as pizza, and then click on "Link to this page” near the top right of the page to get a page like Figure 4-14.
The point isn’t to get information on pizza, but to show that when you click on “Link to this page,” Google Maps loads the URL for the current map in your browser. That URL includes the latitude and longitude of the center of your search area as the
sll parameter, which stands for search lat/long. Look at the address bar in Figure 4-14, and you can see the URL query string ?q=pizza&sll=38.411170,-122.841720. So, phone number (707) 827-7000 is located at 38.411170 N, 122.841720 W. That location isn’t perfect, but it is pretty darn good. See “Inside Google Maps URLs”
[Hack #7]
for more on the structure of Google Maps URLs.
Another thing to note about that original Google search for the phone number in Figure 4-13, is that a search for a phone number also does a standard Google search. This can be interesting because it pulls things up in a new way. The first Google link for O’Reilly’s phone number is a Road Warrior’s Christmas list. Who would have thought that?
Tip
Reverse lookup availability appears to vary over time. At one point, a reverse lookup on my home phone number pulled up my street address. As of this writing, it just returns the city and ZIP Code. Other residential phone numbers that I’ve tested still work, and business listings still pull up a full address.
Trouble getting a signal? Google maps and the FCC database can help.
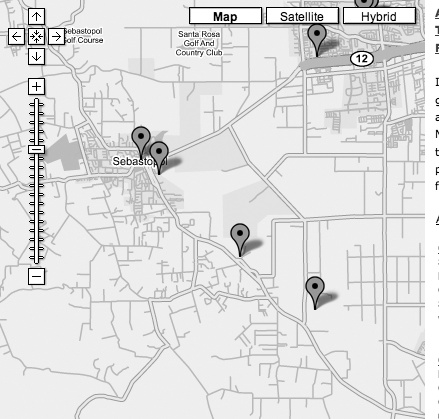
I live almost in the shadow of a 30.2-meter cell phone tower, and I have to go out on the porch to get decent reception. What is up with that? I know the exact height of the tower, thanks to Mobiledia. You can go to its site at http://www.cellreception.com/towers/index.html and browse for cell towers by city or state. When I look up Sebastopol, California, I get the map in Figure 4-15.
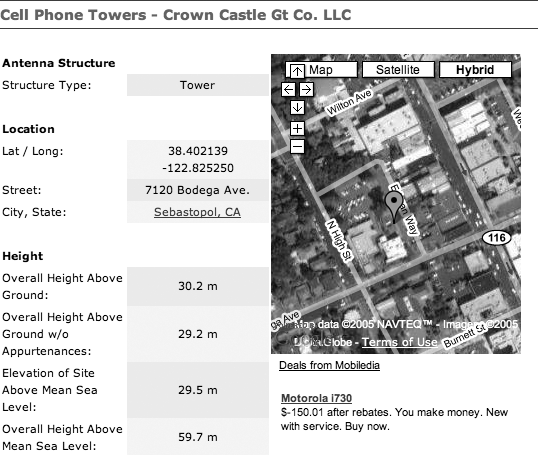
I live near the S in Sebastopol, so you’d think I’d have pretty good coverage 2.5 blocks from the tower. Clicking on the overlay marker brings up information on the owner of the tower, as shown in Figure 4-16. So my problem appears to be that there is a tower, but my cell provider doesn’t have gear up there.
You can click on the overlay marker because marker labels are HTML and support links. Mobiledia defines marker text with this line of code:
	var html="<h1><a href='http://www.cellreception.com/towers/details.php?id=" +
	id + "'>" + name + "</a></h1><br>" + address + "<br>" + city + ", " + state;
This builds a URL that calls a script on its site with more details. This is an example of how you can include links and arbitrary HTML in pop-up markers. Mobiledia uses the FCC database of antennas, and as explained on the site:
The FCC does not require every antenna structure to be registered, and the map may not list all the towers in the area. Additionally, many carriers have sold their tower assets to third party companies, and leasing agreements are unknown. If this is the case, the best way to determine carrier coverage is by reading comments in the local area.
So it is possible that my provider rents space on the tower, but since the best way to determine coverage is to read the comments, I think it is safe to just assume that my calls don’t go to the most convenient tower.
On the right sidebar is a "Cell phone reception search.” Enter a ZIP Code and it pops up a reader forum on reception, or in reality more likely the lack of reception. You can also search for dead spots and add your own reviews.
Another neat feature of the site is that you can get HTML that lets people search the reception and tower databases from your site. Just go to http://www.cellreception.com/add/index.html and fill out the form, and they send links to an HTML form that you can embed in your own web page.
Tell your own stories with a mix of social software and cartography.
We’ve all found ourselves climbing through hillside brambles on a hot sunny day thinking, “That’s the last time I trust that trailhead pamphlet.” Or worse, wanting to show a friend a special place you found on a hike a few months ago but now can’t quite place.
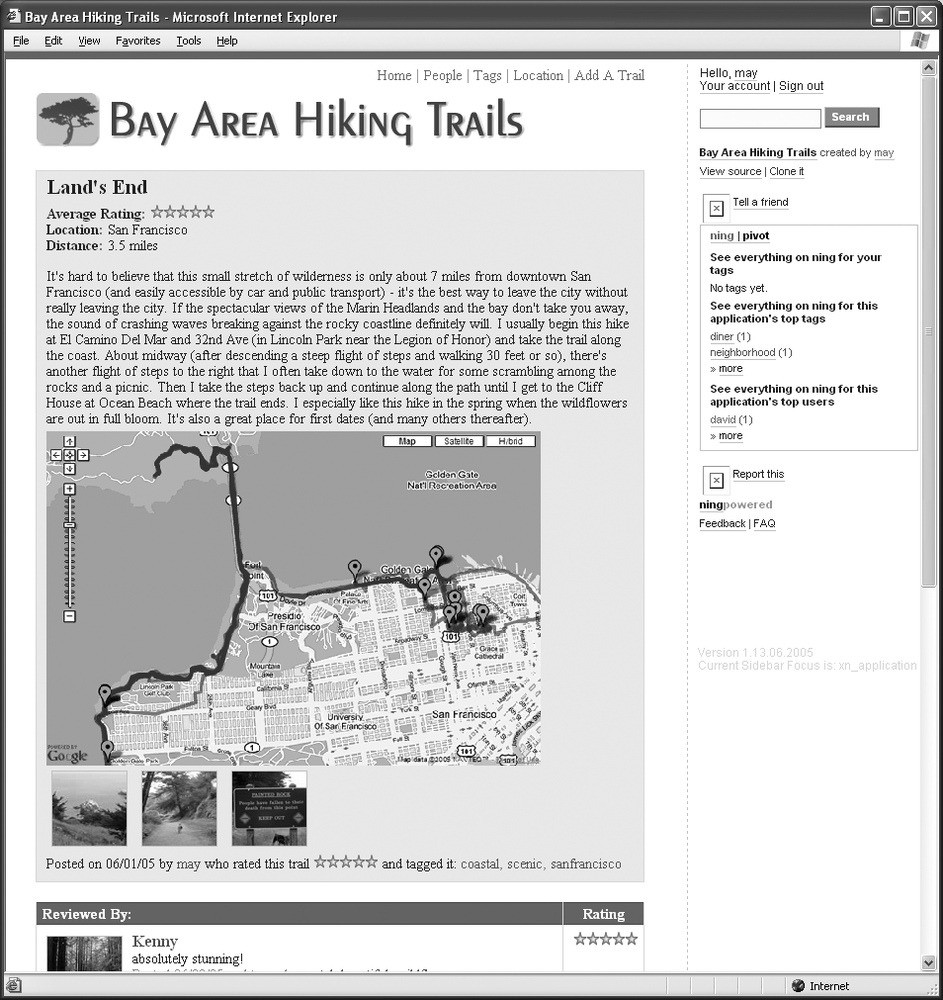
If you’re a hiker, mountain biker, rock climber, weekend warrior, amateur geologist, scout troop leader, endorphin junkie, equestrian, pedestrian, rock climber, birder, or simple romantic, then have we got a hack for you! The site, which lives at http://BayAreaHikingTrails.ning.com, looks like Figure 4-17.
Bay Area Hiking Trails (BAHT), written by Saumi Mehta and May Woo, allows you to capture and publish your trail maps with comments, GPS tracklogs, and photos. Even better, you can easily overlay your GPS tracklogs on Google Maps via the API and provide a visual representation of your hike, bike, or ride alongside all these other goodies. But that’s only the start. You can also offer these annotated trail maps to friends or strangers for rating and reviewing. You can even look for new hiking friends and fellow enthusiasts. How’s that for social?
All right, so that may not be enough. Let’s take it one step further. No single social map can cover all scenarios of what you might want to do with it. With just a little bit of PHP knowledge, BAHT enables you to easily change or extend the user input forms so that you can record your own specialized data: birds seen, bikers met, geocaches planted, or geocaches found. You can also go further and change the HTML layout, add new features, or introduce new kinds of objects for your users to edit. Perhaps you are employed by a local parks service to identify invasive plant species and want a new kind of form input to describe those. Or you’re a mountain biker who wants to have a slightly specialized social mapping application to document the rockiness, steepness, or exposure of certain trails.
BAHT is extensible for such uses because it is built on the Ning Playground, which is a free online system that enables you to clone, mix, and run fullblown social web apps like BAHT without worrying about a bunch of pesky details. The Ning Playground handles user account management, system administration, hosting, and bandwidth nightmares, not to mention the tedium of performance and scalability issues.
If you don’t know PHP, you can still do a lot with BAHT or any social application running on Ning. If you want to copy BAHT to create Malibu Hiking Trails, Bay Area Rock Climbs, Yosemite Mountaineering Routes, or Sonoma Bike Rides, just select the application and choose Clone It on the righthand sidebar to instantly create your own running version of the application, with an exact copy of the code behind the copied application, ready to be customized. You just change the title to apply the app to the place, interest, or activity you want. Now you’re all set to start adding your own relevant trails, rocks, mountains, rides, or romantic spots, and invite your friends and neighbors to do the same.
If you know PHP, then it gets even better. You can go under the hood of the app by clicking on “view source,” and, with those PHP skills, change the user input forms, add or delete features, or make the app anything you want.
BAHT combines the benefits of gadgets, data, and the real world experience of you and others to help you find and share the perfect place. You can compare your trips against your friends’ trips—or blend different trips together to get a composite view of some new trip you’ve never thought of before.
BAHT helps you return to your favorite places over and over and easily find new favorites. It dissolves boundaries between the professional and the amateur by letting you create your own maps and your own mapping services. Ultimately, perhaps its most powerful role is that it helps you and your friends more easily share something valuable and important: this hugely complex and beautiful natural world we live in. I look forward to seeing what kinds of new projects you invent based on this starting point.
—Anselm Hook
From Google straight to your Global Positioning System receiver, thanks to GPSBabel.
GPSBabel (http://www.gpsbabel.org) makes it possible to convert driving directions from Google Maps into various formats usable by other software and devices. This is possible because Google encodes the coordinates of the entire route in the JavaScript that is sent to the Google Maps client and used to generate the route that is put on the map.
The first step is, of course, to get Google Maps to make some driving directions. We’ll use one of the examples given on the Google Maps home page. Enter “JFK to 350 5th Ave, New York” and hit the Search button. After a short calculation, a map like that in Figure 4-18 appears, with the route highlighted.
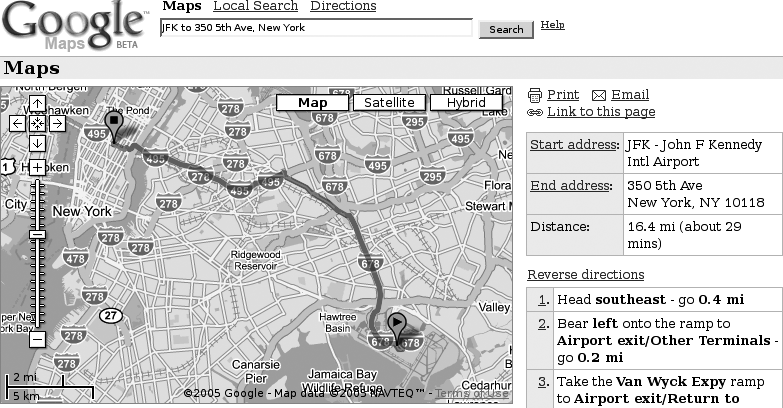
Now, we need to get the output into a predictable format. To do that, we first need a URL that contains everything we need to recreate our route. Fortunately, Google provides a tool to do just that! Click “Link to this page.” The displayed map won’t change, but the URL in the address bar will contain your query and the parameters needed to return to this map at this zoom level.
The last step is to modify that URL to output the JavaScript that the Google Maps client uses internally. To do that, just add
&output=js to the end of the URL in your address bar and hit Enter. Your URL will look like this (but all on one line):
	http://maps.google.com/maps?q=jfk+to+350+5th+ave,+new+york&spn
	   =0.103861,0.199934&hl=en&output=js
The observant reader will note that the instructions “JFK to 350 5th Ave, New York” are included in that URL, with spaces having been replaced with plus signs. With this information you can skip the steps of looking up an address, clicking on “Link to this page,” and changing the URL to include &output=js, and instead just enter the URL of the JavaScript page straight into your browser. Here is a link to the page containing the points for directions from JFK to San Francisco International Airport the hard way:
	http://maps.google.com/maps?q=jfk+to+sfo&spn
	   =0.103861,0.199934&hl=en&output=js
The resulting page will appear mostly blank, but the HTML source contains all the data we need to extract the coordinates of the route. Save that page to your local hard disk with the File → Save As menu option. If you are using Internet Explorer, make sure to select Web Page, HTML Only from the “Save as type” drop-down. Saving as Web Page, Complete will cause the file to be rewritten as non-compliant XHTML, which GPSBabel will not be able to read. Give the file a name—we’ll call ours nyc.htm—and hit the Save button.
Now we have a file to feed to GPSBabel. What can we do with it? One thing we can do is to load this route to a handheld GPS unit. These have limits on the number of points, so we can use GPSBabel to reduce the route Google Maps has computed for us to a smaller number of points. GPSBabel comes with a GUI frontend, but the real power lies in the command-line interface. For our example, we must use the command-line interface because the GUI does not support filters. Start a command prompt; make sure that GPSBabel is in your path, and switch to the directory where you saved your map file as nyc.htm. Connect a supported Magellan or Garmin GPS receiver to com1: or a serial or USB port. If you are running Linux, this is likely to be /dev/ttyS0 or /dev/ttyS1. If you are using Mac OSX with a USB adapter, it may be /dev/cu.usbserial0.
Assuming you used com1:, type the following all on one line and hit Enter. Otherwise, replace com1: with the name of your serial or USB port. For a Magellan GPS receiver:
c:\>gpsbabel –i google –f nyc.htm –x simplify,count=30 –o magellan –Fcom1:
c:\>gpsbabel –i google –f nyc.htm –x simplify,count=30 –o garmin –Fcom1:
That’s it! GPSBabel will read the driving directions produced by Google Maps, pick the 30 most salient points along the route, and upload the new route to your GPS receiver. Now you can follow along on this route as you walk, bicycle, or drive!
One other thing you might want to do is to save those points to a GPX file so that you can include them on your own Google Map, or upload them to a site like http://gpsvisualizer.net/. The Topografix site at http://www.topografix.com/gpx.asp describes the GPX format:
GPX (the GPS Exchange format) is a light-weight XML data format for the interchange of GPS data (waypoints, routes, and tracks) between applications and Web services on the Internet.
This command will convert all of the points, without simplifying them, into a GPX file:
c:\> gpsbabel –i google –f nyc.htm –o gpx –F nyc.gpxYou can also reduce the number of points from this GPX file and load them into your GPX. The following command will load the points from nyc.gpx, select the 30 best fit points and upload them to a Garmin GPS on com1:.
c:\>gpsbabel –i gpx –f nyc.gpx –x simplify,count=30 –o garmin –Fcom1:
Naturally, this is analogous to the earlier command we used to go directly from Google Maps output to the GPS receiver, except that this time the input file is in GPX format.
GPSBabel is such a great tool that any Google Maps hackers should consider becoming Babelheads!
The GPSBabel page at http://www.gpsbabel.org/.
Another implementation can be found at http://www.elsewhere.org/GMapToGPX/.
—Ron Parker
Going from here to there is okay, but going from here to there to another there to here is better.
In “Load Driving Directions into Your GPS” [Hack #35] we saw how to compute a route and load it into a GPS. The hack showed how to directly create a URL that will fetch the Google Maps file that contains the route points. GPSBabel can parse the points out of a route file and you can do whatever you would like with this information.
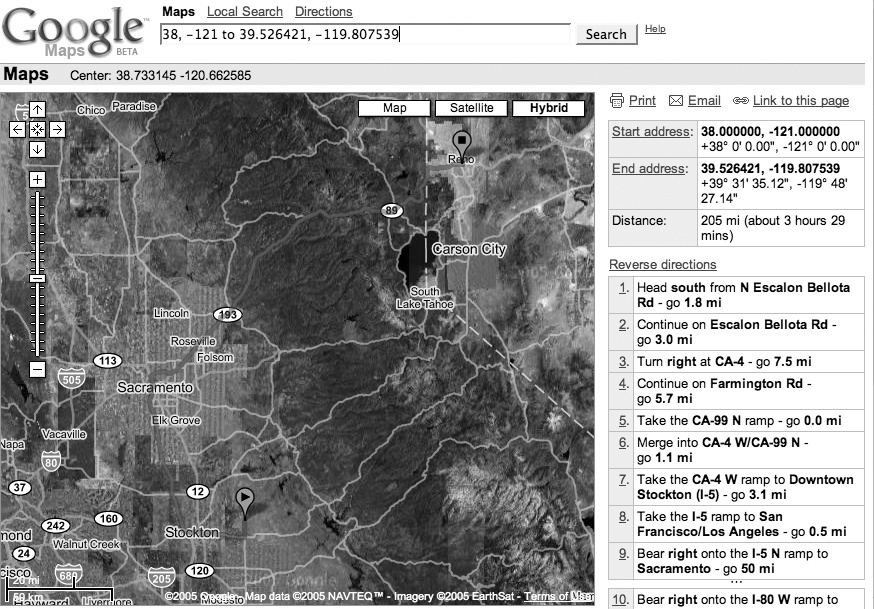
This suggests a script that takes a list of locations that Google can understand and then generates driving directions between each point. In addition to normal locations such as “San Francisco, CA to Denver, CO,” Google Maps can generate driving directions based on latitude and longitude. The results of searching for directions from 38, -121 to 39.526421, -119.807539 are shown in Figure 4-19.
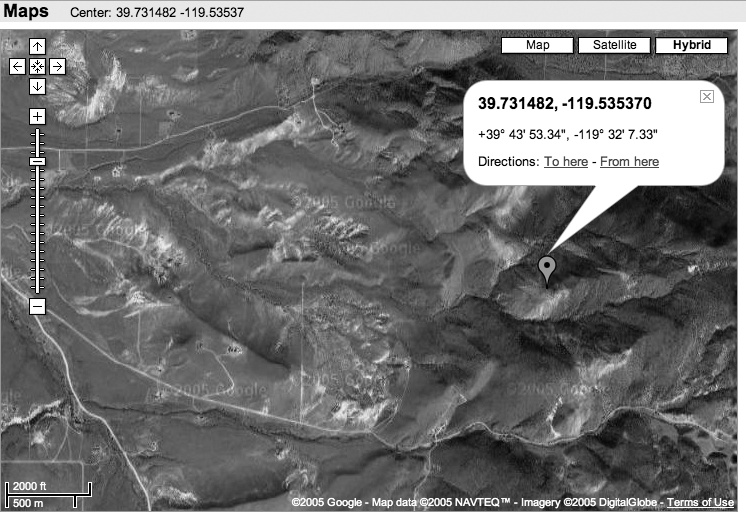
Lat/long routes don’t always work. There are some places that are just a bit too far off of the beaten track for road-based routing to be effective. If you try 38, -121 to 39.731482, -119.53537, you get “We could not calculate driving directions between 38, -121 and 39.731482, -119.53537.” Since 38, -121 worked in the first example, Google must have a problem with 39.731482, -119.53537. A glance at Figure 4-20 shows that Google should be forgiven for this routing difficulty. Apparently the engineers didn’t anticipate helicopter-based mountain-top expeditions.
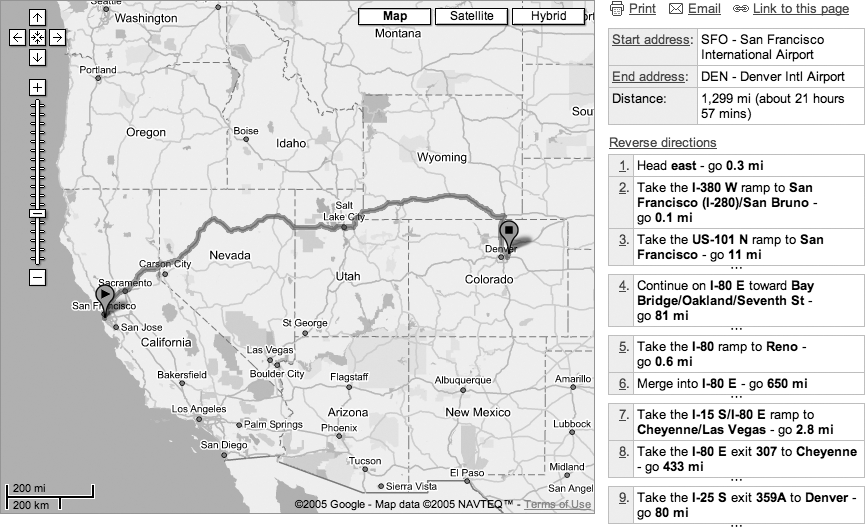
But lat/long–based directions work often enough to be interesting. Great, but why would you want to get driving directions for multiple points or for lat/longs? Let’s say you want to drive from San Francisco to Denver; you can generate the route in Figure 4-21 with the query SFO to DEN, using an airport-to-airport search. Why do you need more than one set of directions?
You’ve got everything you need—1,299 miles, and you are there. But it turns out you want to stop in Moab for some of that Slickrock action. You can’t (yet) enter a request to Google for multipart driving directions, such as SFO to Moab, UT to DEN, but with this hack you can get something similar. Download the Perl script called
takeme.pl from http://mappinghacks.com/projects/gmaps/takeme.html. The script can accept any combination of locations that Google can understand and GPS waypoints stored in GPX format. For example:
$ perl takeme.pl SFO to wy_small.gpx to Moab, UT, to DENThe program returns the combination of driving directions from each point to the next, as well as a simplified list of lat/long points.
	new route segment 37.61830, -122.38632 to 38.57320, -109.55060
	San Francisco Airport
	to Slick Rock Capitol

	-----------------------------------------------------------------
	Head    west
	0.5| mi (734 meters) for 1 min
	-----------------------------------------------------------------
	 Take the I-380 W
	 ramp to San Francisco (I-280)/San Bruno
	0.1| mi (197 meters) for 12 secs
You might want to specify multiple locations, including a detour to visit friends, or you might want to trick the routing algorithm into using a route that it considers sub-optimal. Here’s a real life example of tricking a routing algorithm: my dad and step-mom had just gotten a Prius with a navigation system—they had had it less than two weeks. My dad, while quite bright, is not particularly technical. One day they were driving and playing with the navigation system. My dad said, “Don’t set it to go to our destination until you get to this turn—it will take us a bad way from here.”
My nontechnical dad had figured out the tool in under a week. Without knowing how, he was dynamically gaming the system’s shortest-path algorithm by artificially increasing the weight of one segment by adding the cost of turning around to get back to that segment. He made that segment less attractive to the routing algorithm by inserting another segment in between himself and the dreaded slower path. Specifying intermediate points (or desired side trips) adds local knowledge to the cost calculation used in the routing system. In Google Maps terms, it sure would be nice to have “do not use this segment” checkboxes next to each step in the route, followed by “recalculate my route without the checked segments,” but until that happens, you can use the takeme.pl tool!
Plotting your GPS tracklogs on Google Maps allows others to see where you’ve been.
Sharing tracklogs and waypoints from your GPS receiver became a lot easier with the invention of the GPX format, which is an open XML standard that encodes your GPS wanderings to a file readable by many applications. The best waypoints are pubs—so why not plot them on Google Maps, as in Figure 4-22?
You can go to http://www.tom-carden.co.uk/googlegpx/ and upload your own GPX format file. Any waypoints appear as marker pins, and the start and end of tracks will be marked with pins, as shown in Figure 4-23.
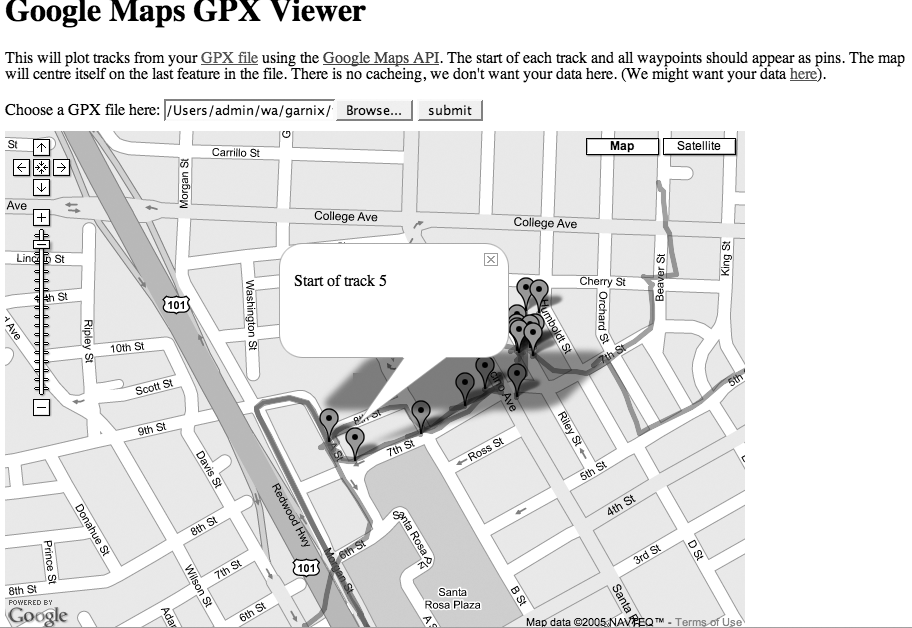
There are several ways to process a GPX file into something Google Maps will understand, and we demonstrate two methods here. Using server-side processing, you upload the file from your browser and process it on your server (in this case using Ruby) and return a script that displays the data. Alternatively, you can put the GPX onto your own server and use some JavaScript to open it, process it on the client side, and pass it to Google Maps. The usual caveats for passing information around in a browser apply—there are restrictions on what scripts are allowed to access—but old friends like the iframe element and new friends like XMLHttpRequest can help us here.
No matter what method you use to process the GPX data, a GPX file will typically contain thousands of points—far too many for Google Maps to handle. Why is this? When you display polylines in Google Maps, your vectors are rendered into an image file on Google’s servers. The more points, the more time it takes to generate the images. Except this isn’t the whole story—Google only does this if you aren’t using Internet Explorer. IE has a built-in vector language called VML, which renders the vectors very quickly in the browser.
Being fans of Firefox and Mozilla, for us it wasn’t good enough to rely on IE. Therefore we thought up a way to selectively choose which points to display so we didn’t have too many, yet had enough to show the route without slowing Google down. A seemingly obvious solution would be to simply drop every fifth point to reduce the number of points by 20%—but the problem is that one of those ignored points might be the crucial part of a turn or otherwise cause distortions of the route.
Consider another scheme in which points are intelligently dropped on straight lines but not on complex bends. In this scenario, successive points in a straight line add little information to a route and may be forgotten. Points that turn direction quickly would then be kept as they are more important than those that only reinforce a straight line. The key here is determining the amount of change in direction in order to pick those points that should be displayed.
You could simply choose an angle and choose successive points based on whether the path they mapped out deviated more than that angle, and it’s a good choice. The problem, however, is that a GPX file may have 1,000 or 10,000 points within it, and these must be mapped down to a sufficiently small number of points to actually plot in both cases because Google Maps can’t plot too many. And so we developed an adaptive algorithm that gets a good number of points to display.
Before describing the algorithm, we should be honest and point out that this hack doesn’t choose points based on angle, but something a little more crude that is effectively equivalent. Instead of angle, it is the difference vector between successive line segments. What does that mean? Perhaps the diagram shown in Figure 4-24 will help.
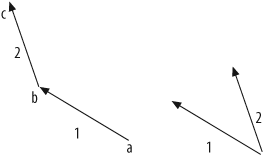
Consider three trackpoints recorded by your GPS unit, where you travel from a to b to the bottom of c. Take the vector 2 between b and c, so that it starts at a and you can compare the vector 1 between a and b to it. Notice the dashed line between them. This dashed line is the difference between the vectors. It’s like the angle between them but both quicker to compute and sufficient, because we only need a rough guess to figure out the change in direction.
There is one final fact we must admit, which is that these vectors are laid out in linear latitude and longitude. So when you’re in London one degree in latitude is a different absolute length (say, in meters) than one degree in longitude. You could equalize these but for our purposes it doesn’t matter that much.
Back to that adaptive algorithm: we choose a small number as a threshold for the length of that dashed line. Then, for every successive pair of line segments in a GPX track we see if the dashed line is bigger than our threshold. If it is bigger, then we include the point; otherwise, we forget about it. By going through the entire GPX file, we may decide to forget 100 points but have 4,000 left. This is far too many for Google to plot. We therefore make our small number a bit bigger and try again, this time dropping more points. We repeat this cycle until we have less than 200 points and then use those points to plot in our track.
This algorithm has been implemented with both a server-side Ruby backend and JavaScript client parsing.
Here is the Ruby script to place server side, if that’s the way you want to plot your GPX files. We recommend using Apache and mod_ruby to run it, and much documentation is available for both.
	#!/usr/bin/ruby

	# make sure we can speak CGI and XML:
	require 'cgi'
	require 'rexml/document'
	include REXML

	cgi = CGI.new

	print cgi.header("type"=>"text/html")

	stringfile = cgi['gpxfile']

	doc = Document.new stringfile.read

	# Put the header of the HTML file:

	puts '<!DOCTYPE html PUBLIC "-//W3C//DTD XHTML 1.0 Strict//EN"
	   "http://www.w3.org/TR/xhtml1/DTD/xhtml1-strict.dtd">
	<html xmlns="http://www.w3.org/1999/xhtml">
	  <head>
	    <script type="text/javascript">
	      function addPoints( ) {'

	count = 201
	trackcount = 0
	diff = 0.000000001
	firstpt = ''
	lastpt = ''

	# For each track point in a segment
	doc.elements.each('gpx/trk/trkseg') do |e|
	  count = 201
	  diff = 0.000000001

	# So long as the total count of points to draw is less than 200
	  while count > 200

	    output = '          parent.gpxtrack(new Array('
	    first = true

	    oldlon = 0.0
	    oldlat = 0.0
	    oldvx = 0.0
	    oldvy = 0.0
	    count = 0
	    # For each point in a segment
	    e.elements.each('trkpt') do |pt|
	      lat = pt.attributes['lat'].to_f
	      lon = pt.attributes['lon'].to_f
	      # Always add the first point
	      if first
	        output+= pt.attributes['lat'] + ',' + pt.attributes['lon']
	        first = false
	        count = 1
	        firstpt = 'parent.addpin(' + pt.attributes['lat'] + ',' +
	         pt.attributes['lon'] + ', "Start of track ' + trackcount.to_s + '");'
	      else
	        vx = oldlon - lon
	        vy = oldlat - lat

	        # If the point is bigger than our small value
	        if ((oldvx - vx)*(oldvx - vx))+((oldvy - vy)*(oldvy - vy)) > diff
	          # Then add it
	          count += 1
	          output += ',' + pt.attributes['lat'] + ',' + pt.attributes['lon']
	          oldvx = vx
	          oldvy = vy
	          oldlat = lat
	          oldlon = lon
	        end
	      end

	    end

	    # Make our small distance value 5 times bigger and try again
	    diff *= 5

	  end

	  if count > 1
	    puts output + '));'
	    puts firstpt
	    trackcount += 1
	  end

	end

	# Now, for each waypoint plot it with the description:
	doc.elements.each('gpx/wpt') do |e|

	  lat = e.attributes['lat']
	  lon = e.attributes['lon']

	  str = ''

	  e.elements.each('name') do |wpt|
	    str += wpt.get_text.value + '<br>'
	  end
	  e.elements.each('cmt') do |wpt|
	    str += wpt.get_text.value + '<br>'
	  end

	  e.elements.each('desc') do |wpt|
	    str += wpt.get_text.value
	  end

	  puts '        parent.addpin(' + lat + ',' + lon + ',"' + str + '");'

	end

	# put the end of the HTML
	puts ' }'
	puts '
	    </script>
	  </head>
	<body onload="addPoints( );">
	<p>uploaded successfully as far as we can tell</p>
	</body>
	</html>'
Once that script is in a suitable location, you need an HTML page with a little JavaScript to hook it up to.
We start with the most basic Google Maps instance, modified to support VML and Internet Explorer.
	<!DOCTYPE html PUBLIC "-//W3C//DTD XHTML 1.0 Strict//EN"
	    "http://www.w3.org/TR/xhtml1/DTD/xhtml1-strict.dtd">
	<html xmlns="http://www.w3.org/1999/xhtml" xmlns:v
	    ="urn:schemas-microsoft-com:vml">
	    <head>
	      <title>Google Maps GPX Viewer</title>
	      <style type="text/css">
	      v\:* {
	        behavior:url(#default#VML);
	      }
	      </style>
	      <script src="http://maps.google.com/maps?file=api&v=1&key
	         =YOUR_KEY_GOES_HERE" type="text/javascript"></script>
	    <script type="text/javascript">
	      //<![CDATA[
	      var map;
	      function addMap( ) {
	         map = new GMap(document.getElementById("map"));
	         map.addControl(new GLargeMapControl( ));
	         map.addControl(new GMapTypeControl ( ));
	         map.centerAndZoom(new GPoint(0.0, 0.0), 16);
	      }
	      //]]>
	    </script>
	    </head>
	    <body onLoad="onMap( );">
	       <div id="map" style="width: 740px; height: 500px; margin: 10px 0 0 0;">
	</div>
	    </body>
	</html>
The Ruby code described above expects to receive a GPX file from an HTML multipart form. That form should look something like this:
	<form name="gpxupload" action="ruby/upload-gpx.rbx"
	    enctype="multipart/form-data" method="POST" target="sekrit">
	   <label for="gpxfile">Choose a GPX file here:</label>
	   <input type="file" name="gpxfile" />
	   <input type="submit" value="submit" />
	</form>
You can see that this form is being submitted to a frame called sekrit. That’s pretty straightforward to add to the HTML too:
	<iframe width="740" height="200" border="1"
	    name="sekrit" id="sekrit"></iframe>
And once those items are in your HTML file, all that remains is to add the following JavaScript after the addMap( ) function.
	// whenever a waypoint element is encountered (used by Ruby and JS parsers)
	function addpin(lat,lon,text) {
	  if (lat && lon) {
	    var p = new GPoint(lon,lat);
	    var marker = new GMarker(p);
	    if (text) {
	      // supplied text is wrapped in a <p> tag but can contain other html
	      var html = "<p>" + text + "</p>";
	      GEvent.addListener(marker, "click", function( ) {
	        marker.openInfoWindowHtml(html);
	      });
	     }
	     map.addOverlay(marker);
	     map.centerAndZoom(p,4);
	   }
	}

	// whenever a trkseg element is encountered (only used by Ruby parser)
	function gpxtrack(track) {
	  if (track) {
	    if (track.length >= 4) {
	    var points = [];
	    for (i = 0; i < track.length; i+=2) {
	      points[points.length] = new GPoint(track[i+1],track[i]);
	    }
	    map.addOverlay(new GPolyline(points));
	    map.centerAndZoom(points[0],4);
	   }
	  }
}Instead of parsing the GPX on the server side, and returning some JavaScript to an iframe, which calls functions in its parent, we can actually use JavaScript to do the whole job—fetch the GPX file and parse it, too. The one problem with this approach is that JavaScript is only allowed to access files hosted on the same domain as the web page it runs in. To get around this, we implemented a PHP proxy that bounces remote GPX files off our server to let JavaScript have it’s way with them.
To see this in action, add the following to the JavaScript after the gpxtrack( ) function above.
	// this is called on submit from an html form
	function fetchfile( ) {

	  // disable the form (there's probably a nicer way to do this)
	  document.getElementById("submitbutton").disabled = true;
	  // find the URL from the form (you might want to check that it's a valid
 URL)
	  var url = document.getElementById('gpxfile').value;

	  // create an XMLHttpRequest object, using Google's utility which
	  // abstracts away the browser differences
	  var request = GXmlHttp.create( );

	  // fetch the URL via a proxy script on your server
	  // (otherwise you can only fetch URLs from the same domain
	  // as the javascript is server from)
	  request.open("GET", 'proxy.php?url='+URLencode(url), true);

	  // tell the request what to do if the file is successfully received
	  request.onreadystatechange = function( ) {
	    if (request.readyState == 4) {
	      var xmlDoc = GXml.parse(request.responseText);
	      if (xmlDoc) {

	        var lastPoint; // for centring the map on the last thing of interest

	        var trks = xmlDoc.documentElement.getElementsByTagName("trk");
	        for (var i = 0; i < trks.length; i++) {

	          var trksegs = trks[i].getElementsByTagName("trkseg");
	          for (var j = 0; j < trksegs.length; j++) {

	             var trkpts = trksegs[j].getElementsByTagName("trkpt");
	             var points; // array to contain GPoints
	             var count = 201;
	             var diff = 0.000000001;

	             while (count > 200) {

	               // empty the points array
	               points = [];

	               // we always add the first point
	               var first = true;

	               // characteristics of the last GPoint added to the points array
	               var oldlon = 0.0;
	               var oldlat = 0.0;
	               var oldvx = 0.0;
	               var oldvy = 0.0;

	               var lat;
	               var lon;
	               for (var k = 0; k < trkpts.length; k++) {
	                 lat = parseFloat(trkpts[k].getAttribute("lat"))
	                 lon = parseFloat(trkpts[k].getAttribute("lon"))
	                 if (first == true) {
	                   points[points.length] = new GPoint( lon, lat );
	                   first = false;
	                   count = 1;
	                 }
	                 else {
	                   vx = oldlon - lon;
	                   vy = oldlat - lat;
	                   dx = oldvx - vx;
	                   dy = oldvy - vy;
	                   if ( (dx*dx)+(dy*dy) > diff ) {
	                     count += 1;
	                     points[points.length] = new GPoint( lon, lat );
	                     oldvx = vx;
	                     oldvy = vy;
	                     oldlat = lat;
	                     oldlon = lon;
	                   }
	                 }
	               } // for

	               // if we have >200 pts, we'll try again using a bigger threshold
	               diff *= 5.0

	             } // while

	             map.addOverlay(new GPolyline(points));
	             lastPoint = points[0];
	           } // for j (each trkseg)

	         } // for i (each trk)

	         var wpts = xmlDoc.documentElement.getElementsByTagName("wpt");
	         for (var i = 0; i < wpts.length; i++) {
	           var text = "Waypoint info:<br/>"
	           for (var wpt = wpts[i].firstChild; wpt; wpt = wpt.nextSibling) {
	             // different browsers handle xml attributes differently
	             // this should present waypoint attributes as key:value pairs
	             if (wpt.text) {
	               text += wpt.nodeName + ": " + wpt.text + "<br/>";
	             }
	             else if (wpt.nodeType != 3) {
	               text += wpt.nodeName + ": " + wpt.firstChild.nodeValue + "<br/>";
	             }
	           }
	           addpin( parseFloat(wpts[i].getAttribute("lat")),
	                   parseFloat(wpts[i].getAttribute("lon")),
	                   text );
	         }

	         map.centerAndZoom(lastPoint,4);

	       }
	       else {
	         alert("xmldoc seems to be null: " + xmlDoc);
	       }
	     }
	   }
	   request.send(null);
	   document.getElementById("submitbutton").disabled = false;
	}

	// this is ugly, and possibly there's a better way to do
	// it with some "proper" javascript. I found it on the web…
	function URLencode(sStr) {
	  return escape(sStr).replace(/\+/g, '%2B')
	      .replace(/\"/g,'%22').replace(/\'/g, '%27');
	}
You can remove the iframe since we’re using XMLHttpRequest this time, and change the HTML form to the following:
	<form name="gpxform" onsubmit="fetchfile( ); return false;">
	   <label for="gpxfile">Type the (valid) URL of a (valid)
	        GPX file here:</label>
	   <input type="text" name="gpxfile" id="gpxfile" value="http://" />
	   <input type="submit" value="submit" id="submitbutton" name="submitbutton" />
	</form>
The PHP proxy we used in proxy.php looked like this:
	<?php
	   // note that this will not follow redirects
	   // you really should validate the URL too
	   readfile($_GET['url']);
	?>
And that’s it!
There are a lot more things you can do with this. A few of the most obvious include:
Fix the waypoint metadata JavaScript parser to work in Safari.
Implement the waypoint metadata parsing in Ruby.
In Ruby, save the resulting file on your server, so the maps are linkable.
With JavaScript or Ruby, accept a URL in a query string, and then fetch it via HTTP so that the maps are linkable.
For the Ruby version, submit the file using
XMLHttpRequestand return a bit of JavaScript toeval, instead of futzing around withiframe.
How to use Google Maps’ XSLT voodoo to process the GPX file: http://cse-mjmcl.cse.bris.ac.uk/blog/2005/07/26/1122414882406.html
How to modify the pin icon/contents: http://maps.kylemulka.com/gpxviewer.php
A standalone VB version: http://www.planetsourcecode.com/vb/scripts/ShowCode.asp?txtCodeId=61857&lngWId=1
—Tom Carden & Steve Coast
Found Wi-Fi nearby? Put it on a map!
My interest in Wi-Fi is what got me started with GIS. I had been following the early 802.11 devices and was psyched to read about new modern and cheaply made wireless equipment in the news—and then actually see them on the shelves of various stores. Businesses of all sizes and millions of households started buying and installing these devices all over the place. I wondered where these things were being installed, and just how many were around.
Not long afterwards, I learned that there were people who would go out in their cars with GPSs and laptops, recording the locations of these wireless signals. These wardrivers, I learned, weren’t breaking into these networks, but were comparing findings such as the funny names for some of the networks and the locations of the increasingly popular local wireless hotspots. I figured I had to try this out, and after about five minutes, I was hooked.
I was still curious about what my findings looked like. I had to figure out not only how to plot them, but also how to plot them on a map and on the Web. After a while, and with another curious person, Eric Blevins, we put together http://WiFiMaps.com.
WiFiMaps.com is a web-based geographic map of where Wi-Fi has been installed. The locations are updated by the users, who upload their wardriving scans of various areas. In turn, the site uses TIGER, Mapserver, and a host of other open source and otherwise free tools to plot street-level maps of Wi-Fi installations for those who wonder.
You too can do the same thing—and not just the wondering part, but also the where part. We’ll do some wardriving and use a PHP script to parse the data found, and then plot the Wi-Fi spots on Google Maps.
For collecting Wi-Fi data, I generally use Netstumbler, available from http://www.netstumbler.com, which is popular among wardrivers. For free ‘nix operating systems, Kismet (http://www.kismetwireless.net/) is the tool of choice, while on Mac OS X, there’s both MacStumbler (http://www.macstumbler.com/) and KisMAC (http://kismac.binaervarianz.de). In this hack, we’ll be exporting data from these programs in the WiScan log format, which all four programs should happily generate. WiScan is a tab-delimited text file with its own characteristics, and perhaps there are other wardriving packages that also export to this format.
So, go out for a wardrive! If you are in a densely populated area, even a 20-minute wardrive can produce thousands of points. Be safe! Don’t be tempted to access any of the networks you find while wardriving unless you have permission from the owner, or you are at a public hotspot. Also, pay attention to the road while collecting data—not your laptop.
We have four components to mapping the data you’ve just collected: the HTML form, the plain and simple Google Maps code, the wacky PHP parser bits, and some interesting local data to plot. You’ll need access to and permission for a web server with PHP, and to be familiar enough with those to get the code situated.
Let’s start with the HTML upload form, which will allow us to send our WiScan log to the server to be mapped. Call this file index.html:
	<html>
	    <head>
	        <title>Wi-Fi Data on Google Maps</title>
	    </head>
	    <body>
	        <form enctype="multipart/form-data"
	            action="post.php"
	            method="post">
	        Send this file:
	        <input name="userfile" type="file">
	        <input type="submit" value="Send File">
	        </form>
	    </body>
	</html>
This is quite simple, and I may have even not included some extra functionality. This seemed to work okay, however. Then we can go to the Google Maps default JavaScript setup described in Chapter 2. I decided to add the large zoom control and the map type control, so you can switch between street maps and satellite imagery.
	Map.addControl(new GLargeMapControl());
	Map.addControl(new GMapTypeControl());
Next is the magical PHP code. We’ll keep some sanity here by paring things down by MAC address and doing an average on the various points. This will give us a pseudocenter for placing our markers. We also use a spatial average to generate the starting map. Where you would normally put the following line in your JavaScript:
map.centerAndZoom(new GPoint(-122.141944, 37.441944), 4);
… replace it instead with the PHP code shown here:
	<?php
	        // PHP WiScan parser

	        // Strips-off header and entries with no lat/lng
	        function stripulate($line) {
	                if ( ereg("^#", $line) ) { return 0; }
	                if ( ereg("^[NS] 0.0000", $line) ) { return 0; }
	                return 1;
	        }

	        // self parsing accumulator
	    function splitotron($line) {
	                global $MAC;
	                global $center;

	                // Change N/S to +/-
	                $line = ereg_replace("^N ", "", $line);
	                $line = ereg_replace("^S ", "-", $line);

	                // Strip-off parenthesis
	                $line = ereg_replace("[ )\t(]+", "\t", $line);

	                // Change E/W to +/-
	                $line = ereg_replace("^([0-9.-]+)\tE\t", "\\1\t", $line);
	                $line = ereg_replace("^([0-9.-]+)\tW\t", "\\1\t-", $line);

	                // Split by tabs
	                $cols = preg_split("/\t/", $line);

	                // Add lats with same MAC
	                $MAC[$cols[4]]["lat"] += $cols[0];

	                // Add longs with same MAC
	                $MAC[$cols[4]]["lng"] += $cols[1];

	                // We'll just make them equal here
	                $MAC[$cols[4]]["ssid"] = $cols[2];

	                // Accumulate how many per MAC
	                $MAC[$cols[4]]["cnt"] ++;

	                // Add 'em all together for the center
	                $center["lat"] += $cols[0];
	                $center["lng"] += $cols[1];

	            // Accumulate for the center
	                $center["cnt"] ++;

	         }

	    // Deal with the upload
	    $name = $_FILES['userfile']['name'];
	    if (copy($_FILES['userfile']['tmp_name'], "tmp/$name")) {
	       $uploadfile = file("tmp/$name");

	       // Apply Stripulate function to the uploaded data
	       $uploadfile = array_filter($uploadfile, "stripulate");

	       // Apply Splitotron to the uploaded data
	       $uploadfile = array_map("splitotron", $uploadfile);

	       // Generate centerpoint for map
	       $centerlat = $center["lat"] / $center["cnt"];
	       $centerlng = $center["lng"] / $center["cnt"];
	       echo "map.centerAndZoom(new GPoint({$centerlng},{$centerlat}),2);";
	       // Generate points and markers
	       foreach ($MAC as $mac => $unique) {
	               $divlat = $unique["lat"] / $unique["cnt"];
	               $divlng = $unique["lng"] / $unique["cnt"];
	               echo "var point = new GPoint({$divlng}, {$divlat});\n";
	               echo "var marker = new GMarker(point);
	               \nmap.addOverlay(marker);";
	               }

	       }

	?>
Once you have these scripts in place, you will need to create a temporary directory with appropriate write permissions. You should then be able to call up your PHP script, upload a WiScan file, and have the results displayed on a Google Map, which might look like Figure 4-25.
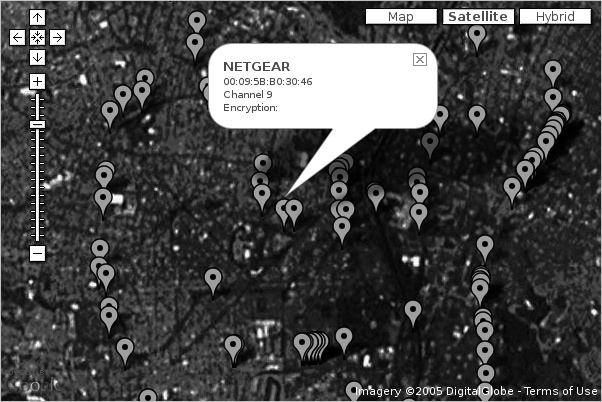
If you’re using Kismet, you can have it generate logfiles in its custom XML format and use a combination of JavaScript and XSLT to translate the log entries directly into HTML for the info window, without the need for PHP. You can see an example of this online at http://mappinghacks.com/projects/gmaps/kismet.html. Since you can view source on that page to see its inner workings, we’ll just cover the juicy bits. Here’s a somewhat simplified snippet of a Kismet XML log:
	<wireless-network wep="false"
	     first-time="Sat Nov 27 16:35:00 2004"
	     last-time="Sat Nov 27 18:21:56 2004">
	     <SSID>linksys</SSID>
	  <BSSID>00:11:22:33:44:55</BSSID>
	  <channel>6</channel>
	  <encryption>None</encryption>
	  <gps-info unit="metric">
	    <min-lat>6.2069</min-lat>
	    <min-lon>-75.5629</min-lon>
	    <max-lat>6.2078</max-lat>
	    <max-lon>-75.5618</max-lon>
	  </gps-info>
	</wireless-network>
Each wireless-network element in the log contains details about each network seen, including a gps-info element that describes the area in which the network was detected. We can use an XSLT stylesheet to turn each of these entries into HTML:
	<?xml version="1.0"?>
	<xsl:stylesheet version="1.0" xmlns:xsl="http://www.w3.org/1999/XSL/Transform">
	   <xsl:template match="wireless-network">
	       <div style="width: 200px; max-height: 75px;">
	           <div style="font-size: 125%; font-weight: bold;">
	               <xsl:value-of select="SSID" />
	           </div>
	           <div style="font-color: #ccc">
	               <div><xsl:value-of select="BSSID" /></div>
	               <div>Channel <xsl:value-of select="channel" /></div>
	               <div>Encryption: <xsl:value-of select="encryption" /></div>
	           </div>
	       </div>
	    </xsl:template>
	</xsl:stylesheet>
The stylesheet identifies a log entry by looking elements in the log called wireless-network, and then outputs an HTML div element, using the values of the SSID, BSSID, channel, and encryption elements from inside each log entry. The HTML that would result from the XSLT transformation of the example log entry using this stylesheet would look something like this:
	<div style="width: 200px; max-height: 75px;">
	  <div style="font-size: 125%; font-weight: bold;">linksys</div>
	  <div style="font-color: #ccc">
	    <div>00:11:22:33:44:55</div>
	    <div>Channel 6</div>
	    <div>Encryption: None</div>
	  </div>
	</div>
On our map page, we fetch the Kismet log using GXmlHttp and feed it to a function called mapFeed( ). This function uses the JavaScript DOM API to find all the
wireless-network entries and then looks inside each one to find the minimum latitude and longitude of the network’s coverage area. For each network node with geographic information, a GPoint object is created with its coordinates, which is passed to another function, addMarker( ), to create a marker on the map for that node.
	function mapFeed (xml) {
	    var items = xml.documentElement
	                   .getElementsByTagName("wireless-network");

	    map.clearOverlays( );

	    for (var i = 0; i < items.length; i++) {
	        var gpsinfo = items[i].getElementsByTagName("gps-info");
	        if (gpsinfo.length == 0) continue;

	        var lon = gpsinfo[0].getElementsByTagName("min-lon")[0]
	                            .childNodes[0].nodeValue;
	        var lat = gpsinfo[0].getElementsByTagName("min-lat")[0]
	                            .childNodes[0].nodeValue;
	        var x = parseFloat(lon);
	        var y = parseFloat(lat);
	        if (x && x != 90 && y && y != 180) {
	            var point = new GPoint(x, y);
	            var marker = addMarker(point, items[i]);
	            map.addOverlay(marker);
	        }
	    }
	}
The addMarker( ) function is almost painfully simple:
	function addMarker (point, xml) {
	    var marker = new GMarker(point);
	    GEvent.addListener(marker, "click", function ( ) {
	        marker.openInfoWindowXslt( xml, "kismet2marker.xsl" );
	    });
	    return marker;
	}
The supplied point is used to create a new GMarker, and then a click event is added to that marker, and the marker is returned. Later, when a user clicks on the marker, the event handler calls marker.openInfoWindowXslt( ), which fetches our XSLT stylesheet from the server, applies it to the DOM element containing the log entry for that wireless node, and then takes the resulting HTML and sticks it into a new info window over the marker. The result is quite elegant, because instead of having to assemble the HTML layout of the info window in JavaScript (which can get quite messy), we can use an external XSLT stylesheet to cleanly separate our logic and our presentation. If we want to add other data from the logfiles to the info window, we can do so by updating the XSLT without ever having to touch the JavaScript again.
The JavaScript in this example could stand some improvement. For example, we could fetch the maximum lat/long for each node and average them with the minimum lat/long for a more accurate position. We could also display a different marker based on the contents of the encryption field, so that we could see, at a glance, which networks were open and which were closed. We could add some logic to track the maximum and minimum coordinates of our logfile and set the map center and zoom level appropriately
[Hack #58]
. Finally, as wardriving logs tend to pick up lots of points quickly, we might want to look into using “Show Lots of Stuff—Quickly”
[Hack #59]
as a means of speeding up the map display.
—Drew from Zhrodague
Ever wanted to have your own spy in the sky watching your every move, tracking you wherever you go?
Google Earth, formerly known as Keyhole, is the desktop-based big brother to Google Maps, offering 3D overviews of major cities, mountains, and other terrain, as well as local businesses and information, driving directions, and maps. Its features are far too numerous to mention here, but you can find out more and download a free version at http://earth.google.com/. Tragically, although it’s based on the OpenGL standard, Google Earth is, as of this writing, supported on Windows only.
One of Google Earth’s most interesting features is the ability to bookmark a particular view of a place or places, and then export that view to other Google Earth users via the Keyhole Markup Language (KML) format. The XMLbased KML format is good for adding static content to Google Earth (e.g., bridges, monuments, or buildings), but how do we map things that move?
Fortunately, Google Earth has something called a Network Link, which we’ll look at a bit more in a second. The upshot is that we can use it to read in a .kml file that holds our position every few seconds. We also have a GPS system that updates our position every few seconds. The hack we’re going to attempt is to constantly get the values from the GPS system into the .kml file. This is surprisingly easy to do on Linux, but we’re running Google Earth on Windows, where things are slightly more, er, entertaining.
First, the tools we’re going to use: Google Earth (and its Network Link feature), Firefox, one Garmin GPS receiver with a serial cable, a copy of Garnix for MS-DOS, two .bat files, ping, possibly some sticky tape, string, and a bit of luck. We’ll talk about the other bits of software, like GPSBabel, but even if you don’t have all this stuff—i.e., you have a different brand of GPS receiver—there should still be enough here to get you hacking around any problems.
Let’s have a closer look at the .kml file we’re going to be creating. Start up Google Earth, zoom into someplace near home, and press Ctrl-N to add a new Placemark. Call it something useful like “Me” and click OK. The Placemark will appear on the map, as well as in the Places section over on the left. Rightclick on the Placemark and select Save As. Save it as me.kml (not .kmz) into somewhere really easy to get to, as we’ll be writing DOS .bat files in a while, so somewhere close to the root drive with a short name is preferable. I made a folder called c:\geo\ and used that.
If you open your .kml file in Notepad, or any other text editor, you’ll something along the lines of the following:
	<?xml version="1.0" encoding="UTF-8"?>
	<kml xmlns="http://earth.google.com/kml/2.0">
	<Placemark>
	  <name>Me</name>
	  <LookAt>
	    <longitude>-2.189175686596352</longitude>
	    <latitude>53.0420501867381</latitude>
	    <range>769.3231615683798</range>
	    <tilt>-8.237346562804484e-011</tilt>
	    <heading>-0.002462111503350637</heading>
	  </LookAt>
	  <styleUrl>root://styleMaps#default+nicon=0x307+hicon=0x317</styleUrl>
	  <Point>
	    <coordinates>-2.19004490258348,53.04134242507396,0</coordinates>
	  </Point>
	</Placemark>
	</kml>
The values we’re primarily concerned with are the <longitude>, <latitude> and <coordinates> elements. These should match each other, as the place we are looking at and the point we’re at should be the same. I normally set the tilt and heading values to be 0 when I generate .kml files with code.
Back to Google Earth, right-click the Placemark, and then delete it—back to square one. We’re doing this because it’s just no rock-n-roll fun as a “normal” Placemark: we’ll make ours far more dynamic, by loading it in as a Network Link!
From the top menu bar, pick Add → Network Link. Once more, pick a useful name, e.g., “Me”, and then hit the Browse button and locate the me.kml file we just saved. At the moment, it’s still acting as a normal Placemark, so change the time-based Refresh When option to Periodically and make the period every 10 seconds. Finally (for fun) tick the Fly to View on Refresh checkbox, then press OK.
What do we have? Google Earth loading in the same KML file over and over again, every 10 seconds, going to the same location over and over again. The next step is fairly obvious: we want to update the values in that .kml file every few seconds from some gnarly code we’ve thrown together. If you’re so inclined and outfitted, try firing up your favorite development environment and having it spit random values into the KML file—and then sit back and watch as Google Earth tries to fly all over the place!
Of course, we want your location, not some random one. We’ll be using your Garmin GPS receiver to get your position and the cable you probably felt you were paying far too much money for (unless it came with your receiver or you built it yourself, in which case, good for you) to connect it to your PC.
We also need some software that’ll fetch your longitude and latitude from the GPS device. You would think that would be a simple task, but unless my search engine fu is failing me badly, I couldn’t find anything that just got our location from the device. Lots of applications for downloading waypoints and tracklogs, loads of neat scripts for Linux, but Windows programs for lat and long in an easy to use format? No such luck.
The closest I could find was the MS-DOS binary version of Garnix from http://homepage.ntlworld.com/anton.helm/garnix.html. Download it and unzip it into your c:\geo\ folder, or where ever you decided to put your .kml file. You’ll need to edit the GARNIX.CFG file in Notepad to read as follows:
	port:         "com4";
	deg_min_sec;
	datum:        "WGS84";
	;grid:        "UTM";
	;zone:        "33";
	;
	;See datum.cfg for datum names
	;See grid.cfg for grid and zone names
Replace com4 with whatever com port your GPS device connects on—usually somewhere from com1 through com4—and make sure the semicolon is removed from the front of the deg_min_sec line. If you don’t know what com port your GPS uses, and you own Google Earth Plus, connect your GPS, turn it on and then pick Tools → GPS Device, which will probably figure out which port it’s connected on. Alternatively, you can experiment with EasyGPS from http://www.easygps.com.
With your GPS system connected to your PC, go outside until you get a GPS reading locked in and have your lat/long position. If you can’t go outside, try hanging the GPS unit out the window, maybe attach it to a stick or pole—this is where the sticky tape and string comes in! (And you thought we were kidding about that?) If none of those options are possible, then there’s a slightly less exciting one: most GPS units have a demo mode, hidden somewhere in the settings menu. If you turn that on, it’ll start making up positions for you.
Open up a command window by clicking Start → Run and then type in cmd, and click OK. Then change to the correct directory and test out Garnix as follows:
c:\>;cd c:\geoc:\geo\>garnix -x
With luck you’ll get a response along the lines of:
	Device ID:     eTrex Software Version 2.14
	Device Time:   17:06:31-2005/07/23

	Current Position (WGS84):
	Latitude    53deg  6min  2.43sec
	Longitude   -2deg 11min 55.59sec
Different devices may give slightly different results. We’ll have to deal with this later on, but it only takes a little tinkering.
Warning
If you can’t get connected with Garnix, all is not lost. As long as your GPS system is cofnnected on com ports 1 to 4 you can se G7To(W) from http://www.gpsinformation.org/ronh/#g7to. The command line you’ll need to use is:
c:\geo\> G7tow –n –i G45Pn is the serial port your unit is attached to. The output is different from Garnix, so you’ll need to hack the JavaScript shown later. Alternatively, you can try using GPSBabel, as described later on in the hack.
Now we have the information, but not in a useful format. There are a few options; for example, you could download the source code and hack it around to output the numbers in decimal format, or even take it a step further and write out the whole .kml file. (Please email us if you do this!) You could probably throw together some regular expressions in Perl to perform mysterious voodoo coding to automagically convert the output or, as we’re going to do now, turn to Firefox and code up a quick solution in JavaScript.
Before we do that, back to the command line once more, to do this:
c:\geo\> garnix –x > results.txtThis writes the information into a text file, which we can use for testing. You can return indoors now or pull the GPS back through the window and switch it off; we’ll not be needing it for a while.
Next, we need to turn the output from Garnix into something Google Earth can use. To keep things simple(ish) we’re going to use JavaScript and open the page in Firefox to run it. In the same folder as everything else, create an index.html file and copy the code below into it. Alternatively, you can download the code from http://googlemapshacks.com/projects/gmaps/tracking/.
	<!DOCTYPE HTML PUBLIC "-//W3C//DTD HTML 4.01 Transitional//EN">
	<html>
	<head>
	    <meta http-equiv="refresh" content="10">
	    <title>geo convert</title>

	<script>
	var readfile = "c:\\geo\\results.txt";
	var writefile = "c:\\geo\\me.kml";
	var fAlt = "750";
The above code sets up the HTML page to reload every 10 seconds and defines where we want to read and write the files to. The fAlt variable is the altitude we want the camera in Google Earth to hover above the surface. Different situations warrant different values, so it’s best to play around to see what suits you best.
The next two functions deal with reading and writing files to the local drive. A certain amount of jumping through security hoops is needed to get Firefox to allow JavaScript to interact with the filesystem. At the end of the fnRead function we’ll call the fnWrangleText function, which does the hard work.
When you run this page, just load it into Firefox as a file using File → Open File. You’re not trying to load this as a web page—and indeed the file read/write will fail if you do. No web server is needed for this hack!
	function fnWrite(sText) {
	    try {
	        netscape.security.PrivilegeManager.
	enablePrivilege("UniversalXPConnect");
	    } catch (e) {
	        alert("Permission to save file was denied.");
	    }
	    var file = Components.classes["@mozilla.org/file/local;1"]
	                     .createInstance(Components.interfaces.nsILocalFile);
	   file.initWithPath( writefile );
	   if ( file.exists( ) == false )
	       file.create( Components.interfaces.nsIFile.NORMAL_FILE_TYPE, 420 );
	   var outputStream =
	       Components.classes["@mozilla.org/network/file-output-stream;1"]
	              .createInstance( Components.interfaces.nsIFileOutputStream );
	   outputStream.init( file, 0x04 | 0x08 | 0x20, 420, 0 );
	   var result = outputStream.write( sText, sText.length );
	   outputStream.close( );
	}

	function fnRead( ) {
	     try {
	         netscape.security.PrivilegeManager.
	enablePrivilege("UniversalXPConnect");
	    } catch (e) {
	        alert("Permission to read file was denied.");
	    }
	     var file = Components.classes["@mozilla.org/file/local;1"]
	                      .createInstance(Components.interfaces.nsILocalFile);
	     file.initWithPath( readfile );
	     if ( file.exists( ) == false )
	         alert("File does not exist");
	     var is = Components.classes["@mozilla.org/network/file-input-stream;1"]
	                     .createInstance( Components.interfaces.
	nsIFileInputStream );
	    is.init( file,0x01, 00004, null);
	    var sis =
	         Components.classes["@mozilla.org/scriptableinputstream;1"]
	                 .createInstance( Components.interfaces.
	nsIScriptableInputStream );
	    sis.init( is );
	    var readText = sis.read( sis.available( ) );
	    fnWrangleText(readText);
	}
The next part is where it gets interesting. First of all, we’ll create pointers to the two textboxes that’ll we’ll use to see what’s going on.
	function fnWrangleText(sText) {
	    var sInput = document.getElementById('txtInput');
	    var sOutput = document.getElementById('txtOutput');
We want to get to the values right at the end of the text. There are all sorts of ways to do this, but I happen to find this the easiest to follow. We’re going to remove all the line breaks and extra spaces to make the text just one long line. Next, we turn the text into an array, using the spaces that are left as the divider, so that each word becomes its own element in the array.
	sText = sText.replace(/\s+/g, " ");
	sInput.value = sText;

	var aText = sText.split(" ");
The information we want is held in the last eight words, or elements, as they are now; therefore, we can count back from the end to get at the data we want. Sometimes, there will be a space at the very end, which we have to take into account. If we count back from the end, we see that “53deg” (using the example output from above) is the 7th word from the end, planning for the extra space we count 8 back to get at it. For the latitude we need the 8th, 7th, and 6th words from the end, then the 4th, 3rd, and 2nd for the longitude. The division of minutes by 60 and seconds by 3,600 allows us to combine all three values into decimal degrees.
	var fLatDeg = parseFloat(aText[aText.length-8]);
	var fLatMin = parseFloat(aText[aText.length-7])/60;
	var fLatSec = parseFloat(aText[aText.length-6])/3600;
	var fLat = Math.abs(fLatDeg) + fLatMin + fLatSec;
	if (fLatDeg < 0) fLat *= -1;

	var fLonDeg = parseFloat(aText[aText.length-4]);
	var fLonMin = parseFloat(aText[aText.length-3])/60;
	var fLonSec = parseFloat(aText[aText.length-2])/3600;
	var fLon = Math.abs(fLonDeg) + fLonMin + fLonSec;
	if (fLonDeg < 0) fLon *= -1;
One last check shown below makes sure we have a valid number for the latitude and longitude. It’s possible that your output from Garnix is slightly different from that shown above, so you may need to change the values needed to count back from the end. Sometimes you may also get a clash when you attempt to read the file just as Garnix is writing it, which will just cause us to skip an update using the code below.
	if (isNaN(fLon) || isNaN(fLat)) {
	    sOutput.value = fLatDeg + ' ' + fLatMin + ' ' + fLatSec + ' : '
	                + fLonDeg + ' ' + fLonMin + ' ' + fLonSec;
	    return;
	}
Finally the important bit: we construct the contents for our .kml file, putting the new values into it, then we send it to the fnWrite( ) function to save it back out.
	    sOutput.value = '<?xml version="1.0" encoding="UTF-8"?>\n';
	    sOutput.value = sOutput.value + '<kml xmlns="http://earth.google.com/kml/2.0">\n';
	    sOutput.value = sOutput.value + '<Placemark>\n';
	    sOutput.value = sOutput.value + '   <name>Me</name>\n';
	    sOutput.value = sOutput.value + '   <LookAt>\n';
	    sOutput.value = sOutput.value + '    <longitude>' + fLon + '</longitude>\n';
	    sOutput.value = sOutput.value + '    <latitude>' + fLat + '</latitude>\n';
	    sOutput.value = sOutput.value + '     <range>' + fAlt + '</range>\n';
	    sOutput.value = sOutput.value + '     <tilt>0</tilt>\n';
	    sOutput.value = sOutput.value + '     <heading>0</heading>\n';
	    sOutput.value = sOutput.value + '     </LookAt>\n';
	    sOutput.value = sOutput.value +
	        '  <styleUrl>root://styleMaps#default+nicon=0x307+hicon=
	             0x317</styleUrl>\n';
	    sOutput.value = sOutput.value + '     <Point>\n';
	    sOutput.value = sOutput.value +
	        '  <coordinates>' + fLon + ',' + fLat + ',0</coordinates>\n';
	    sOutput.value = sOutput.value + ' </Point>\n';
	    sOutput.value = sOutput.value + '</Placemark>\n';
	    sOutput.value = sOutput.value + '</kml>\n';

	    fnWrite(sOutput.value);

	}
	</script>
	</head>
The onLoad attribute of the body element below starts the whole thing off. The remainder of the HTML is just layout and formatting.
	<body onload="fnRead( )">
	<table>
	    <tr>
	        <td>
	            <strong>Input Text</strong><br />
	            <textarea id="txtInput" cols="80" rows="3"></textarea>
	        </td>
	        <td rowspan="2" valign="top"><strong>Map Results</strong></td>
	     </tr>
	    <tr>
	         <td>
	             <strong>Output Text</strong><br />
	             <textarea id="txtOutput" cols="80" rows="18"></textarea>
	         </td>
	     </tr>
	     <tr>
	           <td colspan="2"><strong>Save Results</strong></td>
	     </tr>
	</table>
	</body>
	</html>
We have Google Earth loading in the .kml file every 10 seconds and the JavaScript page reading in the results.txt file and writing out the me.kml file every 10 seconds. There’s just one thing left to do, which is to grab the data from the GPS unit every few seconds. Time to go back outside or put the unit into demo mode! What we want to do is call the command garnix –x > results.txt once every few seconds. We could, for example, write a .bat file called go.bat and put the following in it:
	garnix -x > results.txt
	go
That’ll run the command and then call itself again. However, that’ll really mess us up: CPU usage will rocket up and, most of the time, the file will be in an open, deleted, or being-created state. As a result, our JavaScript will never get a look inside. We need to be able to pause the running for a short while.
Sadly, Microsoft didn’t ship MS-DOS with a pause or wait command. There is a file called sleep.exe that’s part of a 12MB resource kit, but I for one don’t want to download 12MB worth of files just for one small application. It’s cheeky, but here’s what we’ll do: we’ll create a new file called wait.bat and enter this into it:
	@ping 127.0.0.1 -n 11 -w 1000 > nul
	go
We’re going to ping ourselves as a way of inserting a delay in our script. (yes, seriously—we did say it was a hack!) The parameters we use are -w 1000, which sets the timeout to 1,000 milliseconds, and -n 11, which tells it to send off 11 pings. In principle, this should delay for about 10 seconds, since it won’t pause after the last ping. With a bit of experimentation, you’ll be able to calibrate how many pings you need for certain lengths of time.
Now, go back and edit the original go.bat file like this:
	garnix -x > results.txt
	wait
And we’re all set!
Wire up the GPS unit and make sure it’s on and connected. Then check that the correct com port is selected in the garnix.cfg file. Take a deep breath and type go from the Windows command line. A cycle should start with go.bat calling wait.bat and wait.bat after a delay calling go.bat. To stop it, type Ctrl-C.
Now, get all three things running: the .bat file cycle in the command shell, the index.html page reloading in Firefox, and, lastly, Google Earth reading in the me.kml file.
I’ll be the first to admit that needing a wireless connection when you’re on the move isn’t always ideal or even possible. First off, if you’re planning a car trip or even a quick walk, you can go over the route in Google Earth first, and it’ll cache the high-resolution images, roads, and other details you decide to enable. You can increase the size of the cache by going to Tools → Options → Cache. Stick the GPS unit and the laptop onto the dashboard, and off you go! You’re just playing with the files in the local cache, so no Internet connection is needed.
You’re about to cycle across the country, so obviously you’re going to be uploading your photos to Flickr and blogging your progress. It’s all very well using the GPS and Google Earth to determine where you are, but what about letting other people know? We want to put our .kml file up onto the Internet so other people can connect to it with their Network Link.
It’s time to update our index.html file. Edit the table at the bottom to look like this:
<table> <tr> <td> <strong>Input Text</strong><br /> <textarea id="txtInput" cols="80" rows="3"></textarea> </td><td rowspan="2" valign="top"> <strong>Map Results</strong><br /> <iframe id="iMap" width="300" height="400"></iframe> </td></tr> <tr> <td> <strong>Output Text</strong><br /> <textarea id="txtOutput" cols="80" rows="18"></textarea> </td> </tr> <tr><td colspan="2"> <strong>Save Results</strong><br /> <iframe id="iSave" width="800" height="40"></iframe> </td></tr> </table>
To put the .kml file up onto the Internet, we’re going to need a server and some server-side scripting. I’ll use PHP as an example, but it should be easy enough to convert to any other language. Here’s the PHP file, which we’ll call saveKML.php, and which needs to be uploaded to a server someplace:
	<?php
	$kml = '<?xml version="1.0" encoding="UTF-8"?>';
	$kml .= '<kml xmlns="http://earth.google.com/kml/2.0">';
	$kml .= '<Placemark>';
	$kml .= ' <name>Me</name>';
	$kml .= ' <LookAt>';
	$kml .= ' <longitude>'.$HTTP_GET_VARS['fLon'].'</longitude>';
	$kml .= '   <latitude>'.$HTTP_GET_VARS['fLat'].'</latitude>';
	$kml .= '   <range>750</range>';
	$kml .= '   <tilt>0</tilt>';
	$kml .= '   <heading>0</heading>';
	$kml .= ' </LookAt>';
	$kml .= ' <styleUrl>root://styleMaps#default+nicon=0x307+hicon=0x317</
	styleUrl>';
	$kml .= ' <Point>';
	$kml .= '     <coordinates>'.$HTTP_GET_VARS['fLon'].','.$HTTP_GET_
	VARS['fLat'].'</coordinates>';
	$kml .= '   </Point>';
	$kml .= '</Placemark>';
	$kml .= '</kml>';
	$fr = @fopen('me.kml', 'w');
	@fputs($fr, $kml);
	fclose($fr);
	header('Content-Type: text/plain');
	print 'saved';
	?>
The above script takes two parameters, fLon and fLat, from the URL and uses them to build and save a KML file. You’ll probably want to change the name in <name>Me</name> to your name, and change the me.kml to something else.
In order to upload the coordinates to the server, we’ll add this line at the end of the fnWrangleText( ) function:
	document.getElementById('iSave').src =
	    'http://www.yourserver.com/urlPath/saveKML.php?fLat=' + fLat + '&fLon='
	+ fLon;
Each time your index.html file reloads, it’ll attempt to call the remote file and pass it your current location. If you happen to be near a Wi-Fi hotspot, your position will be updated. All your friends and family can add your .kml file as a Network Link set to update every 30 mins or so and use it to watch your daily progress.
Tip
An easier way of getting people to update a network link is to set up the Network Link as you’d want other people to use it, save it, then point people to that file rather than the actual me.kml file. Doing so will automatically subscribe them to the Network Link without any effort.
The file will look like this:
	<?xml version="1.0" encoding="UTF-8"?>
	<kml xmlns="http://earth.google.com/kml/2.0">
	<NetworkLink>
	    <description>
	       Follow my cycle tour across the USA.
	    </description>
	    <name>My Road Trip</name>
	    <Url>
	       <href>http://www.yourserver.com/
	         urlPath/me.kml</href>
	       <refreshMode>onInterval</refreshMode>
	       <refreshInverval>1800</refreshInverval>
	    </Url>
	</NetworkLink>
	</kml>
If you don’t have a server, you can still update your position by using a service such as Geobloggers.com using the following URL:
	document.getElementById('iSave').src =              'http://www.geobloggers.com/
	recordObject?objName=geoFlickrBot' +
'&objKey=A56C-2256-FE23&fLat=' + fLat + '&fLon=' + fLon;Finally, add this line at the end of the fnWrangleText( ) function.
	document.getElementById('iMap').src =
	     'http://www.geobloggers.com/mob/index.cfm?lat=' + fLat + '&lon=' + fLon;
If you have a connection to the Internet, Firefox will load the mobile phone version of Geobloggers into the other iframe. It shows you the nearest three photos to your current location along with the direction and distance to them. If you are wandering around a city, then every time you found some wireless access, you’d get updates of nearby photos to go and hunt out.
If you’re stuck without Internet access, browse to http://www.geobloggers.com/mob/ using your phone’s web browser and enter your position via a form.
Besides having time-based network links, you can also have network links that update as you move around the Earth. Try adding a new network link to Google Earth, but this time set the location to http://www.geobloggers.com/fullscreenBackend/dataFeed.cfm. Set the View-Based Refresh to After Camera Stops, and make the delay four seconds. When you zoom into a location and then pause, after four seconds Google Earth will start to load in Flickr Photos from Geobloggers for the area you are looking at. Combine this with the hack just described and as you move around photos taken by Flickr users will appear.
If you want to see photos from just a single user add ?sUsername=[username] onto the end of the URL. Alternatively, if you’re viewing an area where you take a lot of photos yourself, you can add ?sExcludeUsername=[your username] to the URL to get everyone else’s photos.
—Dan Catt
Generate street maps from Google’s real-time taxi-mapping service.
One of the first Google Map Hacks was released by Google itself. The Google Ride Finder is ostensibly a mapping service to find nearby taxis and airport shuttles in major metro areas. While it’s useless for getting a ride with these centrally booked services, it really functions as a very engaging advertisement for these companies. (And, while we’re at it, don’t we actually need the public transit Google Maps Hacks extended for live updates for sustainable transport alternatives?)
The real appeal is how Google Ride Finder demonstrates the use of realtime, updating spatial data. The immediacy of the Web, combined with geo visualization, has powerful possibilities. In this hack, that live data will be repurposed to reveal the street map “ghost” of airport shuttles and taxis, producing raw data that might be consumed by grassroots mapping projects such as OpenStreetMap ( http://www.openstreetmap.org/).
The Google Ride Finder lives at http://labs.google.com/ridefinder. The initial view shown in Figure 4-26 is of North America, with push pins marking the areas for which they have data.
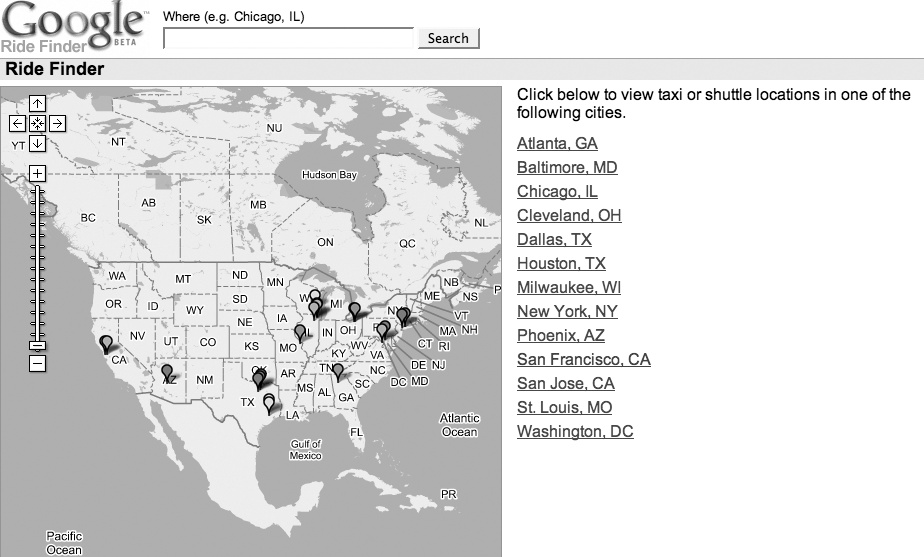
If you zoom in to Chicago, you’ll get a view like Figure 4-27. Each pushpin represents an individual vehicle, almost all of them taxicabs.
Like Google Local searches, Google Ride Finder receives its annotations in their geodata format. To find the location of this feed, look in the JavaScript file http://labs.google.com/ridefinder/data?file=ride_js, referenced from the HTML source. The Update Vehicle Locations button calls refreshMarkers(), which then calls updateMarkers(). This function constructs the following URL:
var j="/ridefinder/data?marker=1&lat="+f+"&lon="+g+"&z="+m+ "&src="+w+"¬es="+(new Date()).getTime();
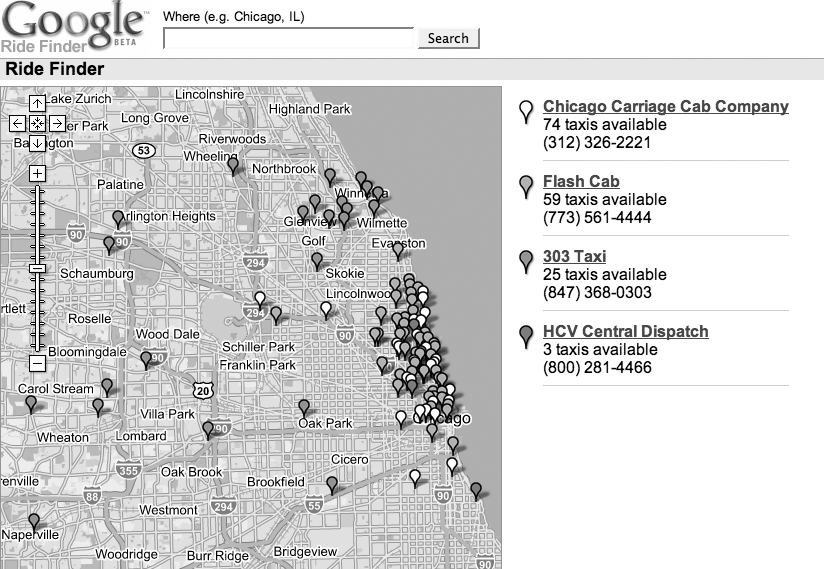
In this bit of code, f and g are the lat/long center of the map, m is the zoom level, and w is hardcoded to 3. The notes argument is a timestamp, which seems to be appended to avoid hitting any cache. Constructing a URL with, for example, the center of Manhattan and scale 8, confirms that this is the feed for Ride Finder.
http://labs.google.com/ridefinder/data?marker=1&lat=40.750422 &lon=-73.996328&z=8&src=3¬es=
Although each annotation within the feed corresponds to the location of an individual vehicle, no unique identifier is included to link two annotations across an update. It’s possible to get near-matches by measuring spatial proximity in successive feeds, which update every five minutes according to Google. The interested reader is invited to give it a try and and see if you can build a poor man’s real-time traffic monitoring application.
Here, we’re going to accumulate taxi positions over a few days and build up a street map of the city of your choice. Set the latitude and longitude of the data URL, derived from another source, such as http://geocoder.us/. Setting zoom to 8 is sufficient to cover a metro region. Append the current timestamp to avoid the cache.
Paste the following code into a file called accumulate.pl:
#!/usr/bin/perl
$dir = ".";
$date = time;
$lat = 40.750422;
$lon = 73.996328;
$url = " http://labs.google.com/ridefinder/data?"
. "marker=1&lat=$lat&lon=$lon&z=8&src=1¬es=$date";
system("/usr/bin/wget –P $dir $url");The variable $dir specifies where you will store the location data files. For example, ~/data will store them in the subdirectory named data/ under your home directory. You want the script to run every five minutes in order to collect data. You can obsessively watch the clock and start the script yourself, or, under a *nix variant, you can use the scheduling feature of the modern operating system. Edit your crontab with the command crontab –e. This line will run the script every five minutes.
0-59/5 * * * * /home/ride_finder/accumulate.pl
Change /home/ride_finder to match the directory in which you installed the accumulate.pl script.
After about 24 hours, you’ll have enough data to start building ghost maps. This Perl script,
draw.pl, simply strips the lat/long from the standard input and plots the points as an unprojected map. You’ll also need the
Image::Magick module from the CPAN, which you can find at http://search.cpan.org/~jchristy/PerlMagick/.
	#!/usr/bin/perl

	use Math::Trig qw(deg2rad rad2deg asin);
	use Image::Magick;
	use POSIX qw(floor);

	$lat = 40.750422;
	$lon = -73.996328;
	$d = 20;
	$w = 1500;
	$h = 1500;

	sub latlon2xy {
	    my ($lat,$lon) = @_;
	    my @xy;
	    $xy[1] = $h * ($north - $lat) / ($north - $south);
	    $xy[0] = $w * ($lon - $west) / ($east - $west);
	    return @xy;
	}

	$radius = 6378.1; #km
	$lat = deg2rad($lat);
	$lon = deg2rad($lon);
	$arc = $d / $radius;

	$north = rad2deg($lat + $arc);
	$south = rad2deg($lat - $arc);
	$west = rad2deg ($lon+asin(-1*sin($arc)/cos( asin(sin($lat)*cos($arc)) )));
	$east = rad2deg ($lon+asin( sin($arc)/cos( asin(sin($lat)*cos($arc)) )));

	my $img = new Image::Magick->new(size=> $w . "x" . $h, quality=> '100');
	$img->ReadImage('xc:white');
	while (<>) {
	    @points = split "<location", $_;
	    foreach $p (@points) {
	        $p =~ /lat="(.*?)" lng="(.*?)"/;
	        @xy = latlon2xy($1,$2);
	        if ($xy[0] >= 0 && $xy[0] <= $w
	                    && $xy[1] >= 0 && $xy[1] <= $h) {
	            $img->Set('pixel[' . floor($xy[0])
	                                . ',' . floor($xy[1]) . ']'=>'#f00');
	        }
	    }
	}
	$img->Write(filename=>"out.jpg");
In order to run the hack, we’ll assume you have the script in the current directory and the data you accumulated earlier in a subdirectory called data/. From there, run:
$ perl draw.pl data/*The script writes the result to an image called out.jpg in the current directory. Set variables within the script for the lat/long center of the data feed, and a distance in kilometers of your choosing, which are used to calculate the extents of the map, and the width and height of the image. You want the lat/long to be close to the same as you selected in accumulate.pl. With lat/long translated to x/y coordinates, ImageMagick is employed to plot each point.
At first you may see just the barest outline of the city, with some major roads and bridges perhaps. With more days of data, individual streets will begin to form along lines of highest density, as suggested by Figure 4-28. (GPS in these vehicles can be inaccurate, resulting in a distribution over the actual street location, possibly bleeding into off-street space and buildings.) Peculiarities of taxi travel will become apparent, with routes to the airport overemphasized and route variations along socioeconomic and districting lines. Maybe you can spot drivers’ favorite places for a coffee break.
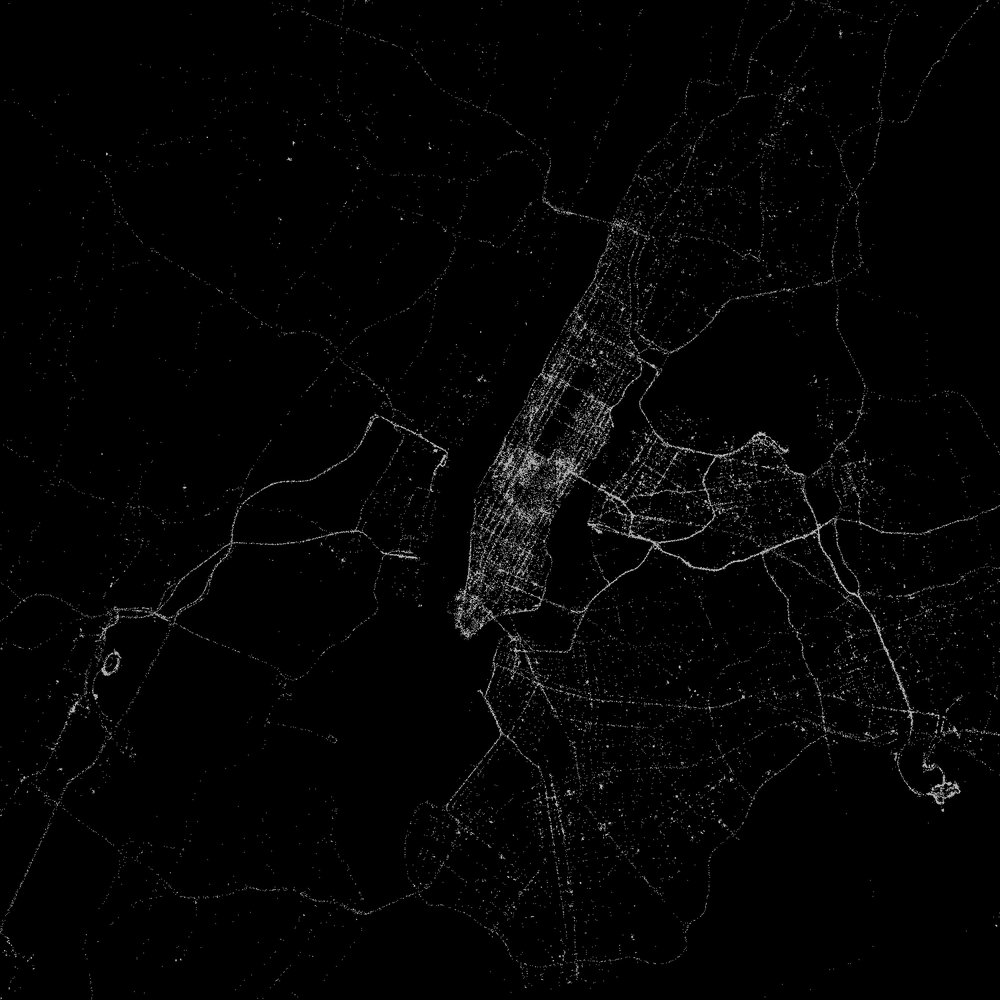
For a neat variation, build an animated GIF with ImageMagick by grouping points by the hour, gradually revealing the street map ghost. Have fun!
crontab tips are available at http://www.everything2.com/index.pl?node_id=765412
—Mikel Maron
The democratization of research is demonstrated, and Google Maps serves the cause of justice by answering a basic, but disputed, factual question.
In January of this year, I was pulled over by a traffic officer for “disobeying a steady red,” a.k.a. running a red light. I pleaded not guilty to the charge, and, nearly six months later, I went to court to find out the fate of my ticket violation. In the end, it was nearly down to my word against the officer’s— but Google Maps saved the day!
There I was, on a bench waiting for my name to be called at the downtown Manhattan DMV hearings bureau. After hearing several testimonies from other drivers I knew this judge wasn’t going to be sympathetic to my troubles. She heard driver after driver, but only one had a happy ending (from the driver’s point of view).
So I was worried, because being found guilty would mean a $150 fine, plus $50 in penalties, and—worst of all—points on my license. I began to contemplate how it all happened since it had been so long. I jotted down some notes on a small piece of paper, and then came the moment of truth.
After my name was called, I gathered my belongings and made my way up to the stand where the ticketing officer joined me. The judge swore her in and asked for her testimony. The officer did just what I expected—after all, I had been listening to those prior testimonies—and began to describe the scene of the violation. In her story, I noticed one fatal flaw, which I wanted to exploit—but I had no proof whatsoever. The officer stated that the street I was on was a one-way westbound street, and that I was turning onto an avenue that was a two-way street separated by a concrete divider. The flaw was that I had actually been on a two-way street, not a one-way.
At last, the time came for my testimony, and I stated that I had been in midturn, when an oncoming vehicle came toward me very quickly, and I had decided not to make the turn until that SUV passed me. The Judge stopped and asked me how there could be an oncoming vehicle if the street was only one-way. I stated that it was actually a two-way street. The officer reiterated that it was a one-way. Who was the judge to believe? I was desperate for proof, so I did the obvious: I whipped out my notebook computer. I was very lucky to find an extremely bad connection via Wi-Fi. I pulled up Firefox and went to maps.google.com. I typed up the intersection and zoomed in as close as possible, as shown in Figure 4-29.
As you can see, Cathedral Parkway (a.k.a. 110th Street) has no arrow indicating the traffic directions. However, 109th and 111th do. I explained to the judge that this means that 110th is a two-way street. The traffic officer begged to differ. She said perhaps an arrow was simply missing from the equation. So I called her bluff and showed the judge another intersection— the one at Times Square, as shown in Figure 4-30.
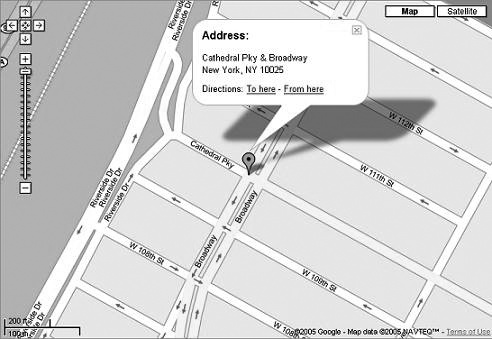
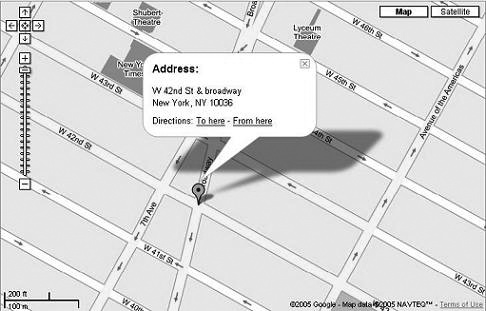
I asked Her Honor if she was familiar with 42nd Street. She nodded, and I continued by observing how all the neighboring streets have arrows to show the direction of traffic, with one exception: 42nd Street, which is wellknown to be a two-way street. The judge replied that, due to the officer’s poor memory, the violation would have to be dismissed.
Thank you, Google Maps: you rule!
This story was originally posted on Gear Live. Gear Live is a web magazine devoted to the high-tech lifestyle, with news, previews, reviews, commentary, and the occasional tip on traffic law:
http://www.gearlive.com/index.php/news/article/google_maps_helps_fight_traffic_tickets_07160942/ The ACLU has an informative publication called Know Your Rights: What To Do if You’re Stopped by the Police at http://www.aclu.org/PolicePractices/PolicePractices.cfm?ID=9609&c=25
—Andru Edwards & Edwin Soto, http://www.gearlive.com
Get Google Maps Hacks now with the O’Reilly learning platform.
O’Reilly members experience books, live events, courses curated by job role, and more from O’Reilly and nearly 200 top publishers.

