Chapter 1. Introducing Data Observability
Once upon a time, there was a young data analyst named Alex who had a deep passion for data. Alex loved the way data could help businesses make informed decisions, drive growth, and achieve success. However, Alex was also aware of the dangers of misinterpreting data or not having enough visibility into the data.
Alex was working on a critical project with a data engineer named Sarah. Sarah was responsible for preparing the data and making sure it was ready for analysis. As they delved deeper into the project, Alex and Sarah realized that there were many variables at play, and the data they were working with was not as straightforward as they had initially thought.
One day, while Alex was iterating on his analysis to generate insights, it appeared to him that the results presented on that day were looking odd and hard to relate to what he had seen to that point. He went to Sarah to discuss the case, but Sarah needed more context on his previous interpretation was or what his expectations were, and what he was asking her to check.
After four days of collaboration, pair review, and several brainstorming sessions, Sarah and Alex discovered that subtle changes in the distribution of half a dozen variables of the incoming data shifted the generated insights, several transformation steps later. Some variables had more missing values, hence they were dropped in the cleaning transformation, others had their average value increased greatly, and one of the datasets was refreshed with almost twice as much data as it had in the past thanks to better extraction from the operational sources.
Although Sarah and Alex originally thought the quality of the data may have dropped, it appeared that the data simply changed, and their assumptions about the data had to be aligned. They realized that they were lucky this had happened before deploying the project in production, and this kind of situation would probably happen many times in the future. If they didn’t anticipate these changes, they would be in trouble.
That experience made them realize the importance of data observability. They needed to have visibility into the data, its transformations, and its usage so they would be able to react quickly to any changes. They started to embrace data observability principles and instrumented their data pipelines to add the needed capabilities that provide real-time insights into the data, its quality, and its usage.
From that day on, they have been backed with dashboard and notification systems that track the health of the data in the pipelines and alert them to any issues that need attention to ensure that the client always receives accurate and reliable data.
Through this experience, Alex and Sarah learned that data is a living and breathing entity that needs to be continuously monitored and observed. They realized that, without data observability, they never would be able to react quickly to changes, putting the project’s success at risk.
If you’re reading this book, it’s likely because you, like Sarah and Alex, have experienced or anticipate experiencing similar situations in your own work with data. You understand the power of data, but also the potential for disastrous consequences when even subtle changes go unnoticed.
But you don’t know what you need to do or how to get started. There’s no need to worry anymore. In this book you’ll learn what Alex and Sarah did to embrace data observability principles and ensure that their data pipelines are reliable and that their clients receive accurate and trustworthy data. By applying these principles to your own work, you can avoid the pitfalls of unreliable data and build a strong foundation for success in your data-driven projects.
Before I dig further into what data observability is and offers at scale, let’s first look at how data teams are evolving and identify the challenges they face.
Scaling Data Teams
More roles, more responsibility, more engineering.
A data team is a group of data practitioners who work together to collect, process, analyze, and interpret data to generate insights and inform decision-making to drive better business outcomes and improve organizational performance.
Because data teams play a strategic role in organizations, their operational efficiency can become a bottleneck to incorporating high-demand data into critical business operations. To cope with this, data teams evolved similarly to IT teams in the 1950s—dedicated roles such as systems engineers, web engineers, or backend engineers were added to support specific operations instead of having generalist roles.1
As data teams have increased their operational complexity with additional roles, more interactions and interdependencies across members and teams have been created, increasing the need for greater visibility, transparency, and standardization.
In the remainder of this section, I will use search trends as an example that illustrates the creation and scaling of data teams along with the data engineer role. The impact and challenges coming with it are addressed in the following section, which also describes other roles, such as analytics engineers, for example.
Let’s start with a Google Trends search (Figure 1-1) for the term “data team” from 2004 to 2020. We can see that while data teams have always been around, the interest in data teams began increasing in 2014 and accelerated significantly between 2014 and 2020.
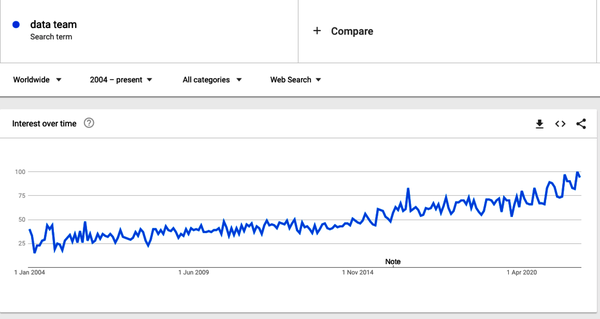
Figure 1-1. Google search trend for “data team”
This is despite interest in “Big Data” decreasing (as shown in Figure 1-2).
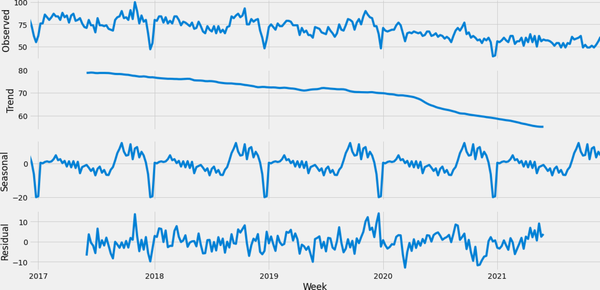
Figure 1-2. Analysis of “Big Data” search term on Google Trends2
Obviously, this doesn’t mean that Big Data was not needed anymore, but, as Figure 1-3 shows, in 2014 the focus started to shift toward data science because its link with value generation was more intuitive.
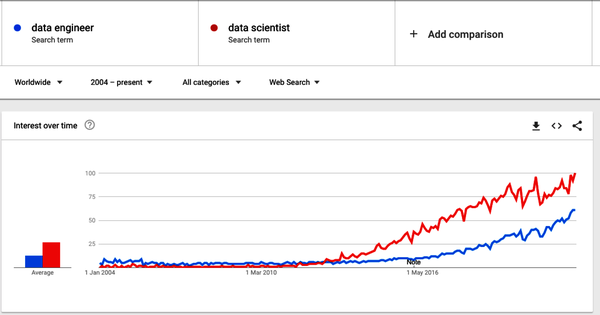
Figure 1-3. Google trends for search terms “data engineer” and “data scientist”
However, even as interest began to climb in data science, it was clear that data availability was a roadblock to many data science projects.
Data science teams have not replaced big data teams. Instead, data teams have embraced analytics, and thus added this relatively new role of data scientist.
As data and analytics became more central to companies’ success, providing the right data to the right people has remained a constant challenge. Gartner noted that by 2018,3 data engineers had become crucial in addressing data accessibility challenges and that data and analytic leaders must, therefore, “develop a data engineering discipline as part of their data management strategy.”
Hence, it became evident that a role dedicated to producing data for downstream use cases was missing. This is why, since around 2020, as companies began to bring on engineers specifically to help build data pipelines and bring together data from different source systems, the search volume for data engineers has increased significantly. Today, as also shown in Figure 1-3, data engineering is trending toward catching up to data scientist in search popularity.
Data as a Metric
Data availability is one of the metrics driving data observability. There are important metrics and metadata relating to data availability, such as the time to live (TTL) and refresh rate (freshness) of a dataset. Still, there are also nuances we’ll get into throughout the book such as sourcing data, privacy and security ramifications, etc. Meanwhile, though, separating roles allows the different skills time and space to be built and the resources to be focused on the different phases of data projects.
As previously introduced, scaling data teams this way with more people, roles, and responsibilities comes with its own challenges. Let’s dig into that topic in the next section.
Challenges of Scaling Data Teams
As companies look to scale their data usage, they also must scale their data teams. I will cover the challenges and their consequences with the following examples:
-
A description of the emergence of roles and responsibilities in a data team.
-
An analysis of the operational complexity as the team grows.
-
An illustration of the challenges of (data) issuance management and their impact on the mood and efficiency of the data team.
-
A note of caution to avoid failures on the ML/AI journey.
Consider a data team that starts with a single person tasked to do the data ingestion, data integration, and even the final report. For this person, a first project might consist of producing a view of recent customer acquisitions.
The data engineer would have to query and ingest the source data from the company’s customer relationship management (CRM) system into the data lake, integrate it into the data warehouse, and create a report that gives the head of sales insight into the progress of the sales made over the past few weeks.
This first data team member is, in essence, a Swiss Army knife: covering both data engineering and data analysis responsibilities to deliver the project outcome (report).
In a larger data team, the skills required for this work are balanced between data engineering, data analysis, and business analysis. As a team of one, though, an individual must master the technologies required to build and run the pipeline, and reporting tools, and understand business key performance indicators (KPI)s. It is worth noting that each of these areas requires specific expertise.
So far, this person is happy, and the scope of work and responsibilities are as shown in Figure 1-4.
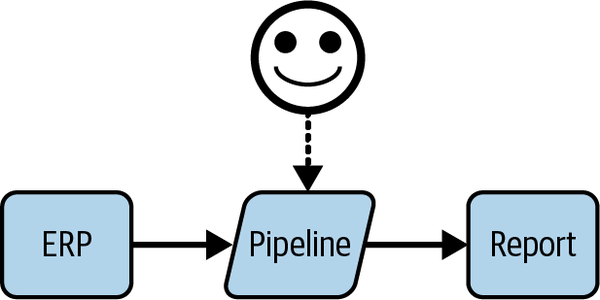
Figure 1-4. A happy single-person data team and its work
Of course, the process is not quite as simple. For example, an entire systems development life cycle (SDLC) should be followed to get the data into production and allow it to be available for analysis by the final user. At a very abstract level, however, this basic process outlined is what we mostly think of as “producing value” with a data project.
With only one team member and one data project, the whole data ecosystem is relatively under control.
The process is simple enough for one person, and the responsibility for the entire project is also attributed to that individual. Because there is just a single person on the team, they also have a close relationship with the business stakeholders—such as the head of sales—and have, therefore, built some domain knowledge around the use case and the business objective of the project. While this role is typically what a business analyst would perform, in this case, the data engineer takes on this role as well.
Thus, if the user raises any issues, it is clear who should work on troubleshooting. After all, they not only executed each step of the process but also know each area of the process.
However, as stakeholders become aware of the potential and value data can provide, more requests are made to this person for new reports, information, projects, etc. As a result, there is an increase in the complexity of the demands and ultimately, the individual reaches their limits of production capacity under the current setup. Consequently, it becomes urgent to grow the team and invest in specialized members to optimize productivity.
In the next section, we’ll see how this team starts growing as specific roles are created, as presented in Table 1-1, which also highlights each role’s responsibilities and dependencies.
| Title/role | Responsibilities | Dependencies |
|---|---|---|
| Software and Operation Engineer | Build and maintain the platform; manage security and compliance; oversee site reliability engineering (SRE) | Receive recommendations from other teams about what to monitor and what to consider an error |
| Data Engineer | Build the data pipelines and manage the data from deployment to production | Rely on IT to build the platform and set up the tools to monitor the pipeline and systems, including data observability tools |
| Analytics Engineer | Similar to data engineering with a stronger focus on data modeling and reusability | Rely on data engineering team to make the operational data sources available in the analytic platform |
| Analytic/data scientist | Build analytics and AI/ML models that can analyze and interpret data for the business team’s use cases | Rely on the data and analytic engineering team to build the pipeline to generate the data they will be using in their report and machine learning models |
| Data Steward | Ensure data is under control and respect data governance policies; also facilitate data product or project scoping with their understanding of the data and its potential and quality | Rely on the metadata and other information available about the data provided by the upstream teams to create and maintain trust in the data used by the downstream users |
| Business/Domain Stakeholder | Sponsor use cases and use data analysis to make business decisions | Rely on all upstream teams (likely across other domains) to ensure data and analyses are accurate |
a Note: I have not added data owners and data product owners/managers because their needs and dependencies are relatively covered by the stewards and stakeholder. Of course, I am not saying they are the same! | ||
There is also a shortage in data engineering, data science, and data analyst skills on the market, hence growing a team is extremely challenging.4
This is especially true at the beginning when everything needs to be built in parallel, such as the culture, the maturity, the organizational structure, etc. Thus, it becomes even more essential to keep the talent you have, and this means ensuring that their roles and responsibilities align with their skill sets. So, in the next section, we will discover how these roles are added, what they will be expected to do, and what will happen to the team over time.
Segregated Roles and Responsibilities and Organizational Complexity
The single-person team has reached its maximum capacity to build new reports and has added another member to get back on track with the pace of the incoming requests. As stated earlier, it is important to specialize the team members to maximize their output, satisfaction, and, of course, quality of work. So we now have a data analyst delivering the reports defined with the stakeholders, upon the datasets built by a data engineer.
The impact of segregating the roles is that the data engineer is now farther from the stakeholders and loses direct contact with the business needs. In a way, the data engineer loses part of the visibility about the project’s final purpose and part of the responsibility for the final outcome. Instead, the engineer will focus all efforts and energy on their deliverables—the ETL, SQL, or whatever framework or system was used to build the data.
The team and its deliveries are represented in Figure 1-5, where we see the distance and dependencies taking place.
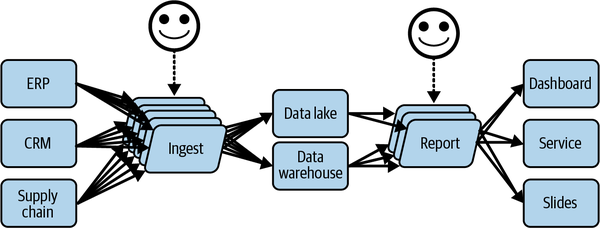
Figure 1-5. The team is growing, as is the complexity
Figure 1-5 also shows the scope of produced work under the new management system by the data team after a few projects have been delivered. The data ecosystem begins to grow, and there is less end-to-end visibility, as it is scattered across both brains, and the responsibility across team members starts siloing.
Next, a data scientist is added to the team, as stakeholders are willing to explore setting up automated decision-making systems that don’t require a human in the loop, or having someone on the team dedicated to overseeing the results and to scaling the value generated by the data.
As shown in Figure 1-6, this adds more scale, and those projects will require more data at a faster speed and more complex mechanisms, as the whole process needs to be automated to generate the expected results.
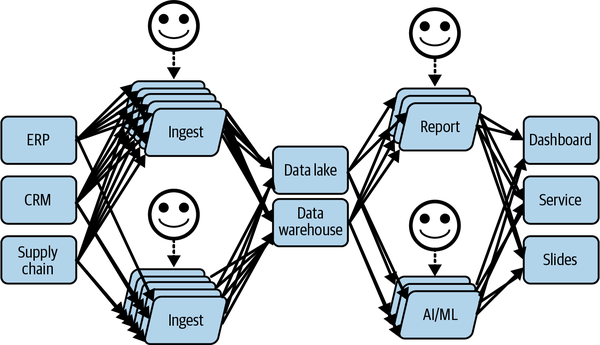
Figure 1-6. Data team evolving toward the use of automated decision making with AI
As time passes and the whole system scales, issues inevitably begin to occur. As noted in the Google paper, “Data Cascades in High-Stakes AI,”5 there is a 92% prevalence for at least one data issue to happen in any project.
Because the system has evolved so much and so rapidly, these issues are hard to troubleshoot and resolve. What is happening? No one knows, in fact.
The lack of visibility within the system combined with its complexity makes it like a complete black box, even for those who built it (some time ago).
The organization’s data ecosystem, as you can see in Figure 1-7, has become like a “legacy system” in IT—only it happened faster.
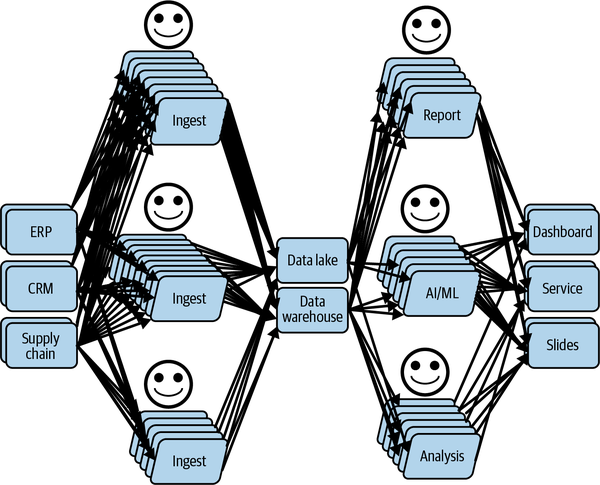
Figure 1-7. Efficient data team delivering projects in production after some time
In further sections, I will walk you through the journey of handling those issues and their consequences on the data teams’ dynamics. However, before that, let’s analyze the anatomy of such data issues.
Anatomy of Data Issues and Consequences
Data issues are a constant and common challenge for most organizations. In one survey by Dun & Bradstreet,6 42% of businesses said they have struggled with inaccurate data.
The most common reasons for data issues are:
- Regulatory
- Data privacy or other data regulations require changes in how data is collected, ingested, or stored, which can create unforeseen issues. For example, the passage to GDPR forced retail companies to change the data they collected and to limit it to only that needed to optimize their recommendation engine in full respect of the customers’ integrity.
- Business demands
- Different business use cases require different configurations of data. For example, a business use case would rely on the shipping address and not the billing address. Therefore, the billing address can be discarded from the data. However, if the financial office uses the same data, they may need those billing addresses, but may have lost access to them, because this usage was not “known.”
- Human error
- Often, data issues are caused by simple human error. For example, a data engineer accidentally publishes a transformation application that deletes all negative values for an amount column instead of setting them with the null value. Consequently, the data user gets less data than expected, which reduces the accuracy of their analyses.
- Latent information error
- This is a not a data error but an error of interpretation of the data. For example, because of a transporter strike, the sales of blue-colored sneakers dropped a lot, due to stock not being refilled. However, the sneakers’ popularity was so good, buyers bought brown ones instead. The marketing team, unaware of the ground truth (e.g., a latent variable related to the transportation efficiency and availability of stock), estimated that brown was the new blue. So more brown sneakers were produced, and remained unsold when the strike stopped a week after.
- Data drift error
- More insidious, this error is also a misinterpretation of the data, likely due to a latent variable; however, the interpretation was initially accurate. Over time, the data genuinely changes so much that the assumptions no longer hold true; therefore, the insights are wrong. An example of such drifts can occur in fashion, when a product is appreciated by people aged, say, 28-31, but the ranges in the data are 25–30 and 30–35. In this case, the next year, it is likely that the interest in the 25–30 range (the 29-year-old people) drops dramatically, but moves to the 30–35 range (the 30–32-year-old people); hence the associated products to recommend must change to accommodate the most represented range.
One of the most challenging aspects of what causes a data issue is that the engineers involved in creating the change to the data or application often don’t realize the implications of the changes they’ve made. And unfortunately, the issue isn’t usually discovered until the end of the data value chain. All in all, the whole point of this book is to teach how everyone can take part in the responsibility to react fast to any such situations, while continuing to assess, communicate, and validate their understanding and assumptions about the data.
Usually, as we discussed in the scaling data team story, business users are working along like normal, running reports, etc., and realizing through a gut feeling and their own previous experience using the data that the numbers “don’t look right.”
But, at that point, it’s already too late. Business decisions may have already been made based on faulty data before the inaccuracies were discovered.
With no time to fix data issues, data teams scramble to figure out who has the knowledge and skills to help resolve the issue. Yet, it’s often unclear who is responsible, or what knowledge and skills you need to address the issue. Analysts? Engineers? IT?
And the responsibility can change from one moment to the next. Perhaps the analyst changed how some information is calculated that is now impacting sales reports, but perhaps even before that, the data engineering team adjusted one of the connections supporting the sales analytics tool the business users use to run the sales reports.
To try and resolve the issue, everyone relies on everyone else’s knowledge about what was done, how things work, where the documentation is, if it is accurate, the understanding of the last changes in the (code) history, and the list goes on. After all, it boils down to manually trying to find and fix the issue collegially or the hard way (alone and in the dark). This is because no one is certain about what fields or tables will affect downstream data consumers.
The expense and time involved in resolving the issue and its negative impact on businesses’ productivity, sales, overall revenue, and even reputation are significant.
The Dun & Bradstreet report also tells us that almost one in five businesses has lost customers due to incomplete or inaccurate data. Nearly a quarter of companies say poor quality data has led to inaccurate financial forecasts, and, of course, the remaining 75% have likely suffered from inaccurate data, but for other usages. Still, a 25% wrong financial forecast is impressive for such a crucial topic for the stability of a company.
Constant data issues can lead to a lack of confidence in making business decisions based on data insights. In a recent study of 1,300 executives, 70% of respondents said they aren’t confident the data they use for analysis and forecasting is accurate.
Impact of Data Issues on Data Team Dynamics
First and foremost, the data issue is detected by the data user, who starts having doubts because either the data received seems odd compared to what was expected, or the results of the analyses are not what was anticipated. The direct side effect of those doubts is the sentiment of mistrust that gets installed in the user’s mind against the team that produced the data, or the whole data platform.
Issues Could Also Be Data Changes in Disguise
This case can happen even when the data has no “issues,” because data changes naturally, as it represents reality, which changes without notice. In such a case, the user simply might not yet be aware of the changes. However, for simplicity, I will assume that the issue is real for the remainder of this discussion.
Figure 1-8 depicts the current situation, where one of the consumers is starting to have concerns about the data, and who imagines that the issue just discovered may have other, yet-to-be-discovered, consequences in some or all applications that use it (also known as data cascade, issue propagation).
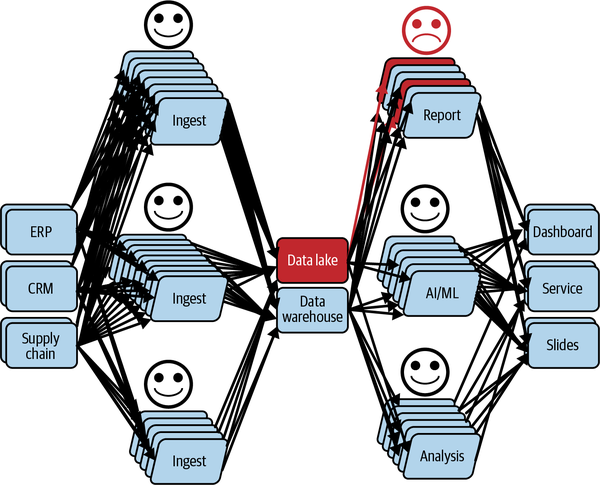
Figure 1-8. A user not cool about what has been discovered: a data issue
In this scenario, users always detect issues at the wrong moment for them. They need the data at that moment; otherwise, they wouldn’t be accessing or checking the data.
So the user is stuck and of course, becomes grumpy. Indeed, instead of working on the planned tasks, the user has to find out how the data can be “fixed.” Consequently, the final stakeholders will not have their data on time.
Moreover, finding how the data can be fixed is not straightforward, as the received data might have been corrupted by any of the applications that produced it. At this point, the process to follow depends on how the (data) operations are organized; an example could be, creating an “incident” (a ticket) with the comment “data is not right, please fix ASAP.”
Eventually, in our example process, the faulty data has a data steward attributed to it. The data steward is responsible for unblocking the user (at the very least) and analyzing the potential for other consequences, which may result in more incidents.
To resolve such an incident, the data steward will have to involve the team or person responsible for producing that data. And now, the timeline depends on the availability of those who will need time to diagnose the symptoms and elaborate on a solution.
Well, this sounds easier than it really is. The incident needs to be reassigned to the producer, who is probably already busy with ongoing projects and unlikely to identify the issue instantly. That’s assuming you can even identify the right producer! Instead, likely all producers will be contacted, probably summoned to a meeting, to understand the situation. They will challenge the “issue” (e.g., “are you sure this is an issue”?), and ask for more details, which loops back to the already angry user (who is most likely not going to be very cooperative).
Consequently, the applications that are touching this data and identified as potential culprits have to be thoroughly analyzed, which involves the following tasks:
-
Access the production data to manually verify and understand the data issue by running a series of exploratory analyses (e.g., queries, aggregation computations in Spark). Given that, the permission to access the data might not be granted yet.
-
Repeat this operation by time-traveling the data (when possible) to identify when the issue started to show up (e.g., a delta table can help to do the time-traveling, but the time when the problem appeared still needs to be found).
-
Access the production logs of the applications (by SSHing on the machines or from the logging platform), to analyze their behavior and even review their history (version, etc.), in case the application’s business logic has changed, which could impact the results. Given that, as for data access, the logs might require special permissions to be accessible.
-
Analyze the business’s logic to trace back to the original data consumed by the applications to identify potential data cascades (issue propagation).
-
Repeat until the root cause is found, you know which data and applications need some repair, and finally, execute the back-filling (to reestablish the truth).
So, let’s be honest—because time is critical (remember, the user is upset), it is likely that the root cause won’t be tracked, but either one of these two temporary-definitive patches will be applied:
-
Run an ad hoc script (aka data quality tool) to “fix” the data that is causing the process to become out of control (e.g., outside the lifecycle of the data, etc.).
-
Update one of the applications to “clean” the received data. This involves fixing the problem locally, and is likely to have awkward side effects, such as removing or imputing null values that can change the distribution of the variables if the number goes up and have side effects downstream (e.g., bad decisions).
In fact, this process, called “troubleshooting,” has puzzled many people, many of whom weren’t even needed for this incident. It is worth noting that while the troubleshooting was happening the scope of the issue has grown significantly, as shown in Figure 1-9.
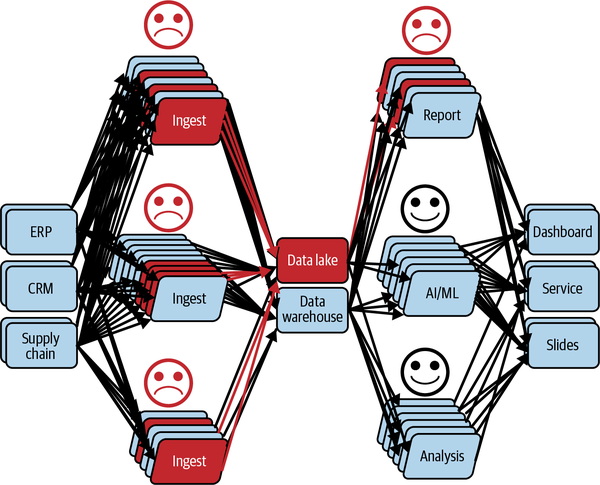
Figure 1-9. People involved in the incident analysis (troubleshooting)
Moreover, the issue detected on this data may have other consequences (remember, data cascades!) on other projects, users, and decisions, which has the effect of further expanding the scope of the issue to all usages of the data.
Another process, called impact analysis, is somewhat close to the troubleshooting we’ve just covered. However, its goal is slightly different, as it aims to prevent or communicate issues.
In fact, not only is the goal different, but an impact analysis is also much trickier and more sensitive, because it requires requesting time from all users to check their data, results, analyses, or decisions.
Even worse, some may discover that decisions were wrong for a longer period of time, potentially as long as the issue has appeared, with everything happened silently.
At this point, the scope of the data issue, considering both the troubleshooting and the impact analysis, is as big as Figure 1-10 shows. And the data steward has to resolve this as fast as possible.
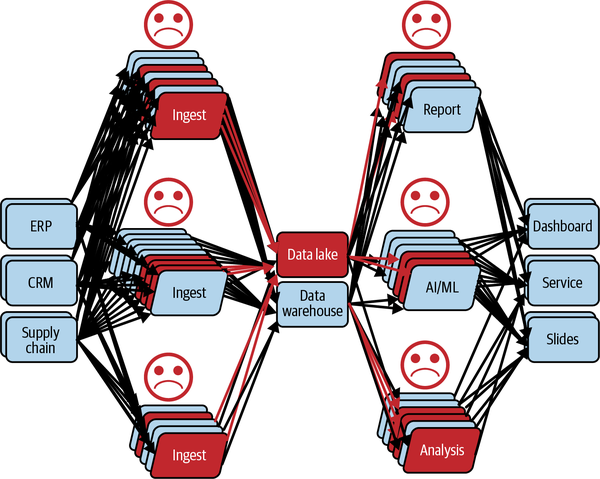
Figure 1-10. The scope to resolve a data issue
This is why we call data a “silent killer.” In our example, it slowed everyone down, destroyed all trust, and generated stress, anger, and anxiety without raising any alerts or “exceptions” (as in software). In fact, data doesn’t raise alerts, or exceptions—yet, anyway; however, there is a way to enable this capability, which we will see in the next chapter.
In this analysis, I have highlighted the challenges around the time and the people involved in the process, and the significant efforts wasted on ad hoc patching, which just creates more data debt. Despite the importance of those challenges, there is another inestimable resource that we lost instantly at the time when the issue was detected: trust in both the data and the data team.
This trust has taken months, if not years (e.g., for sensitive AI-based projects) to build, but because nothing had been anticipated to maintain it, it fell apart like a house of cards, within seconds. This kind of scenario and the resulting consequences for the general mood lead to discouragement and turnover of highly talented team members.
Hence, we can identify many questions raised throughout the incident management process that can be mood destroyers if they are raised at the wrong time:
-
Who is responsible for this issue?
-
Why am I the one who:
-
Discovered the problem?
-
Should be questioned about it?
-
-
Why is the user telling me the data seems inaccurate?
-
Is the data really inaccurate?
-
What apps could be causing this?
-
What upstream data could be the cause?
-
What are the unknown consequences of this issue (i.e., what other projects is this data used in that could also be impacted)?
Understanding why these questions are raised allows us to identify the very source of the problem, and it goes beyond any data issues and their causes. The challenge to address is not the data itself; it is the lack of clarity about accountability and responsibility across the data team members and stakeholders, strengthened by the lack of visibility into the data processes in the wild (i.e. production, during its use).
Consequently, when these questions are raised by or posed to data teams, they can create and reinforce barriers to the creation of value from using data as they will incur the following costs:
-
Take significant time to resolve, during which the data is still unusable by the consumer.
-
Require significant energy and imply that there is a diminished capability to solve the problem at the source and that a local “patch” will be the likely default solution.
-
Provoke anxiety and exacerbate the loss of confidence in deliverables, data, and suppliers.
This is where data observability plays a key role—helping to generate greater visibility into the health of the data and the data ecosystem, and better assigning (distribute, decentralize) of both accountability and responsibility.
Scaling AI Roadblocks
In the previous section, we covered the challenges many face when scaling up data teams. In this section, I will focus on one of the most critical achievements that any organization expects from their data teams, scaling their AI capabilities.
However, these same types of visibility challenges that limit value when issues arise also create significant challenges when implementing AI.
In an analysis performed by Gartner (see Figure 1-11) the most important roadblocks faced by companies in developing their data and AI programs included data volume and/or complexity, data scope or quality problems, and data accessibility challenges.
The good news is that data observability helps with these roadblocks, but before we get into how, let’s look a bit deeper at the primary barriers and why they exist.
The survey results indicate that technology-related challenges account for 29% of issues and the complexity of existing infrastructure accounts for 11%. Interestingly, almost half (48%) of respondents indicated that they experience challenges relate to a lack of visibility due to the complexity of the system in place and a lack of clarity on who was responsible for remedying the issues.
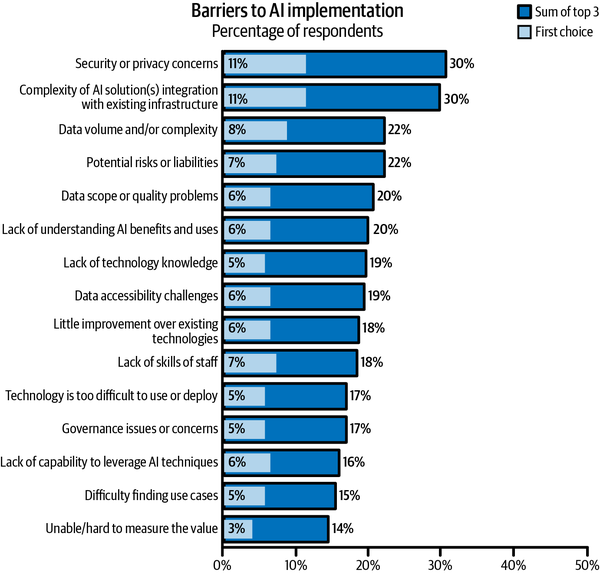
Figure 1-11. Gartner survey’s results about AI roadblocks. Source: Gartner (March 2023)
Let’s take a look at some of the common roadblocks:
- Security/privacy concerns or potential risks or liability
- Nearly one-fifth (18%) of respondents to Gartner’s survey picked these issues as their biggest barrier to AI implementation. Risk management security is all about knowing who, why, and for what purpose the data will be used. There is also a potential risk or liability if the outcomes from the data are inaccurate because the data itself is wrong, which can lead to bad business decisions. Finally, there is concern that the outcome may not meet certain ethical constraints.
- Data volume and complexity
- This issue was the top barrier for 8% of respondents. The complexity and the size of the data require a lot of experimentation to understand and derive value from it. Because of a lack of visibility on experiments that were performed, such as profiling and wrangling, they are repetitive when being performed on the same big and complex datasets. However, this process takes time and effort.
- Data scope and quality
- For 6% of respondents, data quality issues were the top barriers. If the data quality is unknown, then it’s very difficult to have any confidence in the outcome or final results produced from the data.
- Governance issues or concerns, lack of understanding of AI benefits and uses, and difficulty finding use cases
- A total of 16% of respondents felt that one of these issues was the biggest challenge in implementing AI. Data governance is a big issue because documentation is manual and time consuming, which means it’s not always done properly, and therefore its overall impact and value are not always apparent. But without good data governance, the quality of the data fed into AI algorithms could be impacted, and without visibility on the data quality, stakeholders may worry about the security of the data and whether the AI outputs are accurate.
At the time of writing, a disruption in the usage of AI, namely its accessibility by the public, has emerged, with the usage of generative AI for text generation based on a type of model called a Large Language Model (LLM). The most popular tool built using this method is ChatGPT, from OpenAI, as it gives any non-AI-savvy person the ability to chat with an algorithm; meaning, have a structured discussion where each new answer considers the remainder of the discussion (the context). The discussion generally aims at generating content based on some instructions (yes, like coding), such as blog post, definition, structured point of view, pitches, and so forth.
However, the accuracy of the response and how the data is used in these large models was highlighted from the very first weeks of its general availability. For example, Italy forbade access to the service for some time as it was considered to potentially help spread misinformation and bias. Although it was reopened after its compliance with age policies had been verified, clarity about inaccurate or biased information hasn’t been similarly provided.
For such tools, used by millions or even billions of persons around the globe, it is crucial to set the right expectation (e.g., accuracy, timeliness, etc.) to avoid inappropriate decisions or global movements relying on wrong “generated” information. This is nothing but taking what was discussed in this section to yet another level of magnitude, that is, not only to companies mature enough to leverage AI regularly for business decisions, which is likely to impact their ecosystems,7 but also applying the logic to small businesses and individuals as well.
So far, I have taken you on the journey of scaling data teams and AI, and we have identified several challenges, such as a lack of visibility (data pipelines, data usages,), and a lack of clarity about responsibility and accountability that results in distrust and chaos, leading to a loss of interest or confidence in data. This highlights the overall importance of data management. Therefore, the next section covers its challenges at scale, which will allow everything to come together, and introduces data observability as a glue, a solution for these challenges.
Challenges with Current Data Management Practices
As with any company transformation, data transformation and the associated creation of data teams poses the question of the teams’ locations within the organization. Should there be one central data team? Should it be in IT? Or, maybe there should be one data team per business domain? Should they be under IT, or in each domain? But then, how do they collaborate, and how do they stay consistent, and efficient? Et cetera, et cetera.
Those questions are being addressed in many ways; Data Mesh (addressed in Chapter 3) is one of the few (not to say the only one) that has addressed them by rethinking data management at all levels, including at the architectural, cultural, and organizational levels.
However, independently of the position of data teams in the structure, let’s analyze the impact that scaling them up has on data management.
Data management is a vast topic that is widely defined in the literature. For this analysis, I will concentrate on how data management is defined by DAMA8 in their Data Management Body of Knowledge v2 (DMBOK2)9 book.
In DMBOK2, data management comprises many areas, such as data architecture, metadata, and data quality. All those areas are participating in leveraging the value of the data, alongside data governance, which is meant to dictate the policies that must be respected to ensure the data value is generated efficiently and according to the organization’s core principles.
This is very well represented in the Data Management Wheel of the framework shown in Figure 1-12.
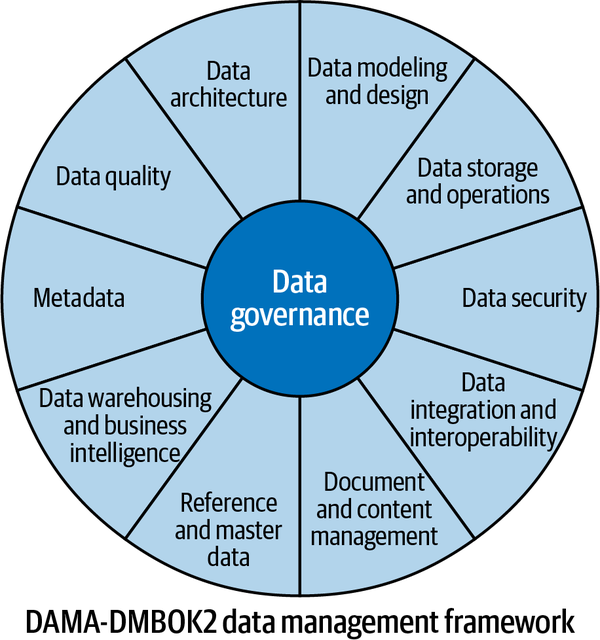
Figure 1-12. Data Management Wheel from DMBOK2 (Copyright © DAMA International)
With more businesses becoming data businesses, both data-savvy business teams and data teams are spreading throughout organizations. Therefore, data culture is no longer restricted to a well-defined center of expertise, but is a value that must be included in the whole organization’s values.
Consequently, the areas delineated by the wheel have evolved to adapt to the different situations and needs. One of the most prominent areas that has seen an increase in global exposure since 2017 is data governance, which is covered in the next section. For example, we’ll discuss how this exposure impacts other areas, such as data quality and metadata.
Effects of Data Governance at Scale
Many challenges result from the evolutions of data management practices and technologies, but I’ll concentrate on one specific challenge: how to control, at scale, how that the data culture is sustained, by respecting not only data governance principles but also the definition and the implementation of the resulting policies. Data governance defines the policies, and each area is responsible for defining, planning, and executing the implementation.
However, along with the implementation, many dependencies across different areas are introduced, plus the fact that everything scales; without a harmonized, defined, and global control layer, any area that presents a default can break the machine.
This is why I am proposing not necessarily to change the structure of data management as presented in the DMBOK2, but to extend it with an extra area, surrounding the data governance area.
This new area is for data observability, which will extend the data management practices of organizations by giving them the ability to measure the health and usage of the data within their system, as well as health indicators of the overall system.10 Nevertheless, a more detailed definition of data observability will be explained in the section “The Areas of Observability”
Having data observability at this position in the wheel makes it apparent that everyone is responsible for implementing it. Its principles and policies should be integrated throughout all areas.
The result is presented in Figure 1-13; however, it doesn’t mean there is necessarily a need for a data observability role, team, or division. It states that at scale, the control must become explicit, as data observability becomes a challenge, when, at a smaller scale, it can be handled in a more ad hoc fashion.
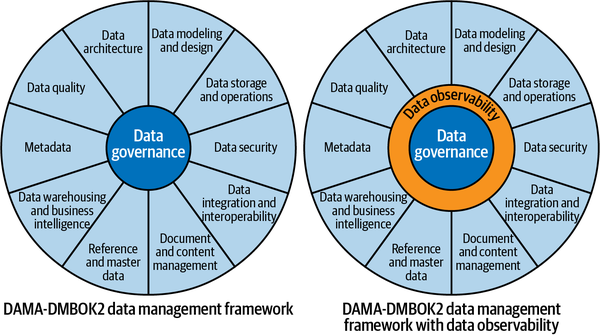
Figure 1-13. Data Management Wheel extended with data observability (Copyright © DAMA International)
In the remainder of this book, we’ll look at how observability extends from the IT DevOps landscape and how to apply it to data and data teams.
At this point, it should be clear that transversal challenges (data management) and local challenges (within a data team) have become bottlenecks to scaling up data strategies and enabling the maximum return on the investment in data in the last few years. Let’s now talk about a solution to address those challenges across the board, that is, with data observability.
Data Observability to the Rescue
Up to this point, I’ve discussed the challenges faced by data teams as they grow and the roles that a lack of visibility and an absence of clarity about responsibilities play in making it difficult for organizations to scale their data and analytics strategies.
However, this is not the first time we’ve encountered such challenges; the closest example is when IT scaled rapidly, which led to the development of DevOps culture.
DevOps has evolved over the years, as more IT practices (e.g., the service mesh) have required more best practices and associated tooling to support them efficiently.
The most well-known example of such best practices is probably CI/CD (continuous integration and continuous deployment), but observability at the infrastructure or application level has also become part of any architecture meant to give more visibility and build confidence in their application and systems while also speeding up the time to market and reducing downtime.
Associated markets have therefore emerged and grown to support these observability requirements. A variety of companies have developed DevOps-related services and technologies at all levels of maturity of the IT environment (e.g., Datadog, Splunk, New Relic, Dynatrace, etc.).
In IT, “observability” is the capability of an IT system to generate behavioral information to allow external observers to reconstruct (modelize) its internal state. By extension, continuous observability allows an external observer to continuously modelize the internal state.
Fundamentally, an observer cannot interact with the system while it is functioning (e.g., we can’t log onto the server); it can only observe information that can be perceived, which are therefore called “observations.”
Now, let’s discuss what those observations are.
The Areas of Observability
An IT system is complex by nature as it is composed of several categories that can drastically expand in number, such as infrastructure, cloud, distributed, machine learning, deep learning, etc.
In this book, however, I’ll avoid getting too fine grained, but will aggregate the categories of an IT system that can be “observed” into several areas, and one of them is related to data, as represented by Figure 1-14.
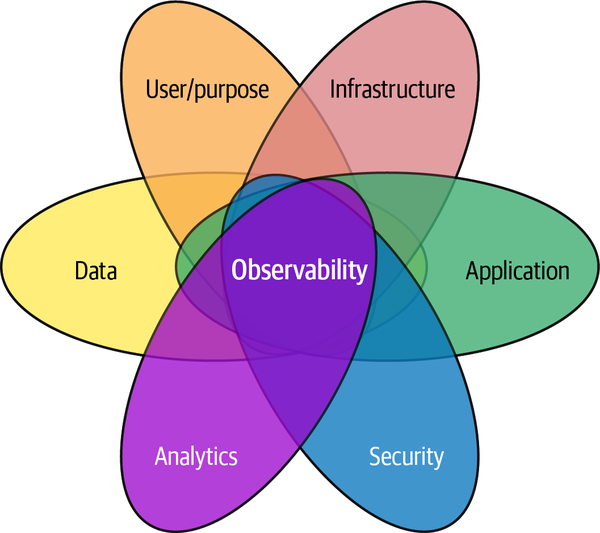
Figure 1-14. Areas of IT observability
These areas are not totally independent of each other, as they have a lot of interactions as they encode the system’s complexities. This is why a Venn diagram seemed to be the best representation.
Before covering the “data” area and “data observability” in detail, let’s briefly review the others:
- Infrastructure
- Using infrastructure log metrics, you can infer the performance characteristics associated with internal infrastructure components. Proactive actionable alerts can be set when there is a failure or certain performance parameters aren’t met.
- Application
- Observing application endpoints, versions, open threads, number of requests, exceptions, etc., can help determine how well the application is performing and identify if or why there are issues.
- User/Purpose
- It is useful to understand and “observe” who is using or implementing applications, what the purpose of a project is, and the goal of the project. This helps to understand the most frequent projects or goals, detect duplicate efforts, or compose centers of expertise.
- Analytics
- Observing analytics, from simple transformations to complex AI models, helps identify and learn from the ongoing usages of data and the insights generated from them.
- Security
- Observing security-related operations, such as modifications of who is granted access or assigned roles, or metrics on which roles are used more often than others, gives visibility on the efficiency of the security system in place, and possible areas of improvement.
Some of these areas have already been well-covered in the DevOps literature. However, we are focusing specifically on data observability. Therefore, we conclude that data observability can be defined as the following:
Data observability is the capability of a system that generates information on how the data influences its behavior and, conversely, how the system affects the data.
A system is data observable if it has the “data observability” capability.
A system is (fully) observable if it has the “observability” capabilities (infrastructure, application, user, analytics, security, and data).
It is worth noting that Gartner has defined data observability as the following, which aligns well with our definition:11
Data observability is the ability of an organization to have a broad visibility of its data landscape and multi-layer data dependencies (like data pipelines, data infrastructure, data applications) at all times with an objective to identify, control, prevent, escalate and remediate data outages rapidly within acceptable data SLAs.
Data observability uses continuous multi-layer signal collection, consolidation, and analysis over it to achieve its goals as well as inform and recommend a better design for superior performance and better governance to match business goals.
The Gartner definition also discusses how data observability can be used (e.g., to prevent issues). However, I didn’t include this as part of my definition because I want to focus on what it is, not what it does (also, I don’t define an apple as a fruit that can satisfy my hunger).
That said, it is important to know the benefits of data observability. In the next section, we’ll dive into data observability use cases in more detail.
Nevertheless, both Gartner and I agree that there is an important “multi-layer” or “multi-area” component that should be considered. I have, however, used the term “areas” because layers imply there is some independence, which, in reality, is not the case.
From this definition, we can look at the dimensions composing data observability as a result of its interactions with the other areas of observability.
I will start with the main dimension formed from observations intrinsic to the dataset. Those observations are essentially metadata such as the fields (e.g., columns, JSON attribute), the format (e.g., CSV), the encoding (e.g., UTF-8), and to some extent, the definitions of the information available.
They allow an observer to understand (mainly) the dataset’s structure and how it changes over time.
If we were to stop here, we wouldn’t be able to leverage data observability to its maximum capacity. For this, we must connect those core observations to the other areas we highlighted earlier to give the observer the following benefits:
- Infrastructure
- Identify where the data resides physically (e.g., file path on a server, the server hosting a database—ideally its connection string), and whether it could impact the data itself or the following areas.
- Application
- Be aware of which components of your organization’s data system are storing or using the data (e.g., a transformation script, a web service); this could also include the code repository and the version.
- User/purpose
- Contextualize and ease the knowledge handover with information about who was involved in the data production or consumption, its security settings, and in which projects (which have purposes) the data has shown itself to bring value.
- Security/privacy
- Control how liable and appropriate are the data collections, accesses, and usages.
- Analytics
- Understand how value is created with the data, through transformation (lineage), AI (machine learning training, predictions,), or even, simply, migration.
As for any new concepts, especially those that touch the organizational culture, ways of working, and technologies, it is crucial to understand their use cases. Therefore, I will cover the most common and valuable data observability use cases in the next section.
How Data Teams Can Leverage Data Observability Now
The main use cases of data observability are currently oriented toward data issue management. However, as data continues to proliferate and its uses expand, there will be many more use cases to come.
Low Latency Data Issues Detection
The more synchronized data observability is with the application (its usage context), the smaller the delay between the issues and their detection will be. In fact, data observability can be leveraged at the exact moment of data usage to avoid any lags between monitoring and usage. This will allow you to detect data issues as quickly as possible, helping you to avoid having data users find issues before you.
Leveraging data observability this way reduces the time to detect (TTD) issues, as data engineers are alerted in a timely manner because any data usage issues are observed in real time (aka synchronized observability).
Efficient Data Issues Troubleshooting
In most organizations, when data issues arise, data engineers spend a lot of time figuring out what the problem is, where it originated, and how to fix it. And every step of the process takes a lot of time. With data observability, the time to resolve (TTR) is much faster because there is visibility into the entire system, thanks to contextual observability, which provides information on the data and its usage context. This enables data engineers to fix issues before they impact downstream business users.
Preventing Data Issues
When implemented as part of the entire development lifecycle, including production, data observability provides continuous validation of the health of the data and the data ecosystem. Continuous validation can perceptibly improve the reliability of the applications and prevent data issues, lowering the total cost of ownership.
Decentralized Data Quality Management
Service level agreements (SLAs) can manage and ensure data quality, just as they are used in IT DevOps to ensure reliability and other key metrics. This new managing data quality requires data observability, which on the one hand, can provide synchronized (near-real-time) and continuous validation of the data, which further improves the efficiency of any service level agreements (SLOs) in place. But more importantly, on the other hand, data observability will allow SLAs and SLOs to be defined at the granularity of their usage, and within the context (the application, for example). This capability solves one of the most important roadblocks of data quality management programs, the definition of SLAs by owners, stewards, or subject matter experts (SMEs) who have a hard time defining a single set of constraints that will supposedly meet all usage expectations. Hence, they cannot come up with a single (central) set of SLAs, as each use case is likely to perceive the SLAs differently. The key difference with data SLAs is that they can take a very large number of forms that feels quickly infinite; for example, you could have SLAs for the min representation, number of nulls, number of categories, skewness, quantile 0.99, etc., for a single field from a random CSV file. Hence, leveraging data observability to decentralize the SLAs in a contextualized manner (the usage) is key to managing data quality and defining a culture of accountability and clear roles and responsibilities.
Complementing Existing Data Governance Capabilities
Remember the DAMA-DMBKO2 data governance framework from earlier? Because data observability is part of that architecture and surrounds all of the areas of data governance, it provides visibility into all of the different components that interact at the data level. This enables data teams to automatically create documentation using the same kind of data, data storage, and data modeling, and provides greater visibility into the different data models that exist, what data has been published to the data catalog, which analytics have been run on what data, and which master data was used.
The Future and Beyond
By better understanding the different use cases for data observability, you should now be able to understand how data observability can be used to help optimize your data systems as well as data teams.
In the coming chapters, I’ll go even deeper, detailing how to set up these use cases and covering best practices to capture the information necessary for each use case in the most efficient and valuable manner.
Conclusion
Data observability is an essential capability for modern organizations that rely on data to achieve their objectives. As data teams continue to grow in size and complexity, it becomes increasingly important to establish practices that promote transparency, governance, and data validation. This book focuses on the technical aspect of data governance through the lens of data observability. By embracing simple yet powerful habits, organizations can ensure that their data efforts are visible, controllable, and manageable across the entire data lifecycle. The following chapters will explore the core principles of data observability and best practices and recipes for making a system data observable.
1 Mary K. Pratt, “CIO (Chief Information Officer),” TechTarget, accessed April 11, 2022.
2 Cf. My O’Reilly report What Is Data Observability?.
3 Roxane Edjlali, Ehtisham Zaidi, and Nick Heudecker, “Data Engineering Is Critical to Driving Data and Analytics Success,” Gartner Research, October 4, 2018, https://oreil.ly/EPBEn.
4 Jen DuBois, “The Growing Demand for Data Engineers,” Quanthub, April 26, 2023, https://oreil.ly/0Yrqo.
5 Nithya Sambasivan, Shivani Kapania, Hannah Highfill, Diana Akrong, Praveen Paritosh, and Lora M. Aroyo,“‘Everyone wants to do the model work, not the data work’: Data Cascades in High-Stakes AI,” In proceedings of the 2021 CHI Conference on Human Factors in Computing Systems, pp. 1-15, 2021, https://oreil.ly/EbEAW.
6 Dr. Anthony Scriffignano, “Data Management Study: The Past, Present, and Future of Data,” Dun & Bradstreet, June 24, 2019, https://oreil.ly/s1LVH.
7 Of course, the ecosystem can be dramatic for large companies, but still…
8 DAMA is a global data management community.
9 DAMA International, Data Management Body of Knowledge (DMBOK), Second edition. (Technics Publications, 2017).
10 Petrella, What Is Data Observability?
11 Gartner®, “Quick Answer: ‘What is Data Observability,’” Ankush Jain, 8 June 2022.
Get Fundamentals of Data Observability now with the O’Reilly learning platform.
O’Reilly members experience books, live events, courses curated by job role, and more from O’Reilly and nearly 200 top publishers.

