So far we've created a simplified view for entering items in the Phone List, we've seen the datasheet view, and we've created a view for the Phone List web part. That's a pretty good survey of the basic uses of views. We use views to:
Simplify data entry.
Summarize information in a web part.
Group or filter information for a specific purpose or audience.
Earlier, I said views are like reports. Actually, they are a lot better: reports are static, but views are updated every time you refresh the web page. In this section, I'll focus on how to create views that help monitor the status of items in an Issue Tracking list.
Tip
The Issue Tracking list is one of the most useful templates included in SharePoint. It helps manage problems (a friend calls those opportunities) and their resolutions. It can automatically send email when an issue is assigned, and it keeps a history of the issue as changes are made.
To create the Issue Tracking list for this sample:
Click Site Actions → Create, and click the Issue Tracking link under the Tracking heading in the middle of the page.
Name the list "Problem Reports" and click Create.
The Issue Tracking template includes views that display All Issues, Active Issues, and My Issues (issues assigned to you). Management wants to see issues that have not yet been assigned and issues that are either overdue or are taking a long time to resolve. In this sample, I'll create two new views to address those needs:
The Unassigned view will show only items that have not yet been assigned to anyone.
The Alert view will display items that are past their due date or more than two weeks old.
The Unassigned view is the easiest, so I'll create that first. To create a view of unassigned items:
Drop-down the View list and click Create View as shown in Figure 4-11. SharePoint displays the Create View page.
Click Standard View. SharePoint displays the Create View page.
Name the view "Unassigned," select "Make this the default view," and scroll down to the Filter section.
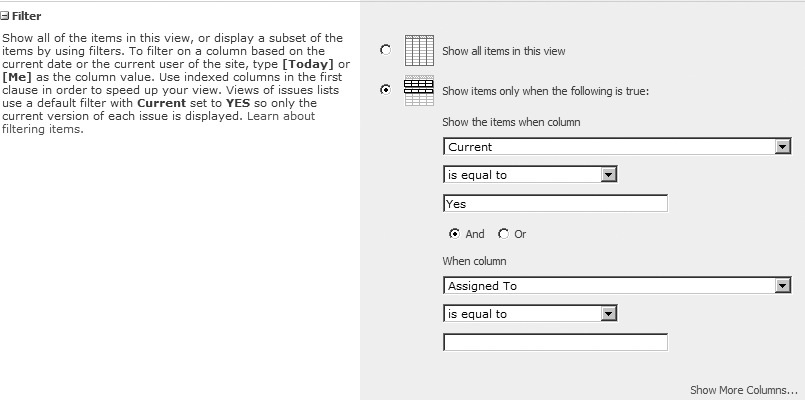
Click And, and select "Assigned To is equal to" as shown in Figure 4-12. (Leave the last field blank.)
Scroll to the end of the page and click OK. SharePoint creates the view and makes it the new default view for the list.
Click New; add a test item to verify that the view displays only unassigned items.
The Current column filter in Figure 4-12 ensures that the most recent item appears in the view. If you remove that filter, the item history is also displayed.
Warning
Use the And filter operator to narrow the list of items displayed in a view. Use the Or filter operator to broaden the list of displayed items.
Creating the Alert view is more complex because there are two different criteria:
Management wants to see items that aren't resolved by their due date.
It also wants to include items that are more than 14 days old.
To satisfy that last requirement, we need to add a calculated column based on the Created date. Then, we can create a view that uses a filter to combine the criteria. To add the calculated column:
On the list toolbar, click Settings → Create Column. SharePoint displays the Create Column page.
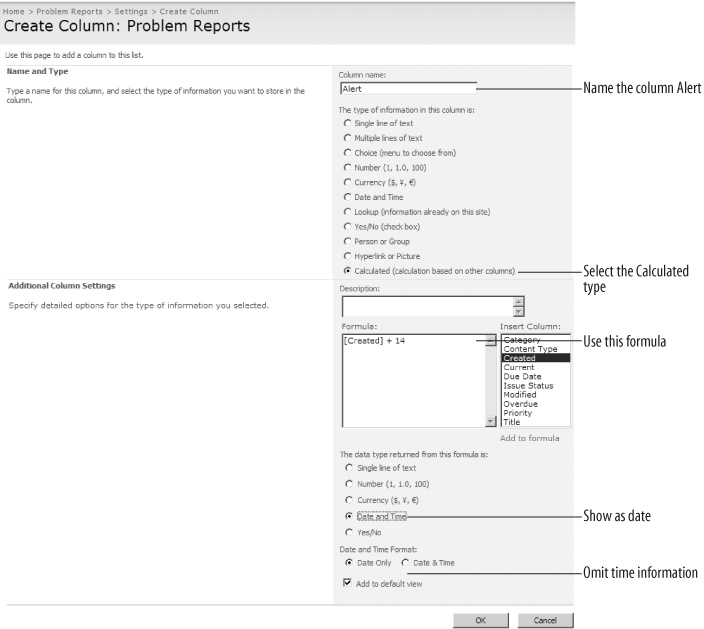
Complete the page as shown in Figure 4-13 and click OK. SharePoint adds a new calculated Alert column to the list.
Figure 4-13. Create an Alert column that calculates the date two weeks after the problem is reported
To create the Alert view:
Drop-down the View list and click Create View. SharePoint displays the Create View page.
Click Standard View. SharePoint displays the Create View page.
Name the view "Alert" and scroll down to the Filter section.
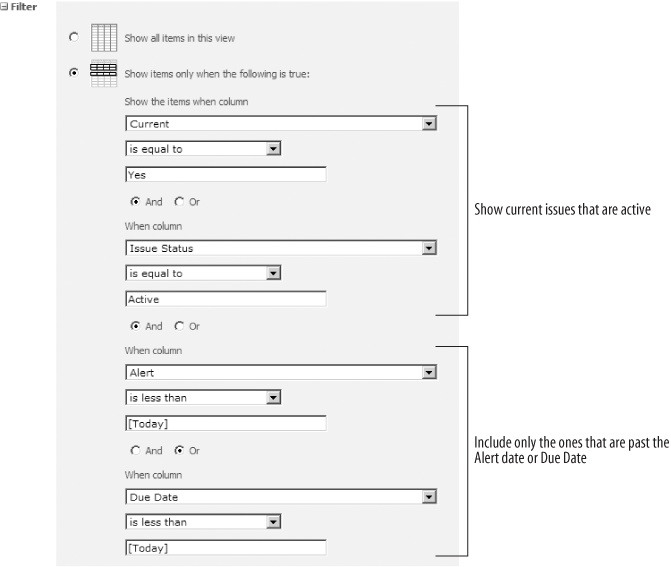
Complete the filter as shown in Figure 4-14.
Scroll to the end of the page and click OK. SharePoint creates the view and makes it the new default view for the list.
Change the Due Date of the test item to verify that the view displays only overdue items.
The trick of adding a calculated column to help create a view is a good one to know, especially when working with dates. That technique is required because SharePoint doesn't let you perform calculations within filters. Try entering the filter "Due Date is less than [Today] - 7"—it won't work!
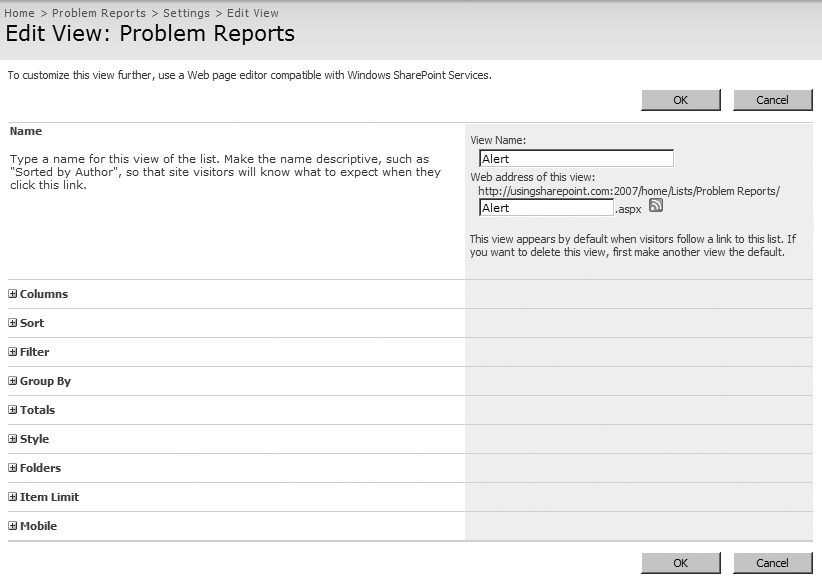
In addition to the filter settings, views have a number of other settings that let you format their appearance on the Create View and Edit View pages (see Figure 4-15).
View settings are organized into the following sections:
- Columns section
Lets you select which columns to display. It's a good idea to limit the number of columns to what fits horizontally on a standard display. Otherwise, users will have to scroll sideways to get the whole view.
- Sort section
Specifies the columns to sort on. Use sorting to help users find the information they want. Usually that means sorting by Title in ascending order or by Create (creation date) in descending order (most recent first).
- Group By section
Use this section to create tree-views of list items. Group By sections also sort items and take precedence over the Sort section. The Phone List web part uses Group By to organize phone numbers by department.
- Total section
Use this section to provide a count or sum of items. Totals combine with Group By to give running totals for each category.
- Style section
This section applies formatting to the view. I like to use the Shaded view for most lists since it makes rows easier to read. (Shaded applies shading to alternate rows.)
- Folders section
This section applies to document libraries, so I'll discuss that in Chapter 5.
- Item Limit section
This section sets the size of the batch of items displayed on a page. If you want to display all of the items in a list, set the number very high. Otherwise, large lists are broken into multiple pages.
- Mobile section
The Mobile lets you create a view for mobile devices, which have much smaller screens.
The best way to learn about formatting views is to experiment with the settings yourself. It's a good idea to create a style guide when you find a combination of settings that you like. I've found these general design rules work best:
Limit the number of columns to what will appear on a screen that is 1,024 pixels wide. 800 pixels generally won't fit enough information, and most displays now support 1,024.
Use the Shaded style. I've noticed folks have less trouble reading that style, and it looks nice.
Avoid Totals in standard views. They look better and make more sense in datasheet views.
Set the item limit so that views page or scroll—don't do both. I've found users often miss the paging links at the bottom of the page, but they understand how to scroll. I reserve paging for lists with more than 1,000 items, and then I try to fit each page on a single screen (Number of items to display: 20, display items in batches of specified size).
Feel free to use those suggestions as a starting point for your own style guide, or come up with one that's completely your own. If you include pictures and print it out, folks will be more likely to follow the guide (and you'll be surprised by how welcome it is).
Get Essential SharePoint 2007, 2nd Edition now with the O’Reilly learning platform.
O’Reilly members experience books, live events, courses curated by job role, and more from O’Reilly and nearly 200 top publishers.


