Chapter 5. Linear Regression
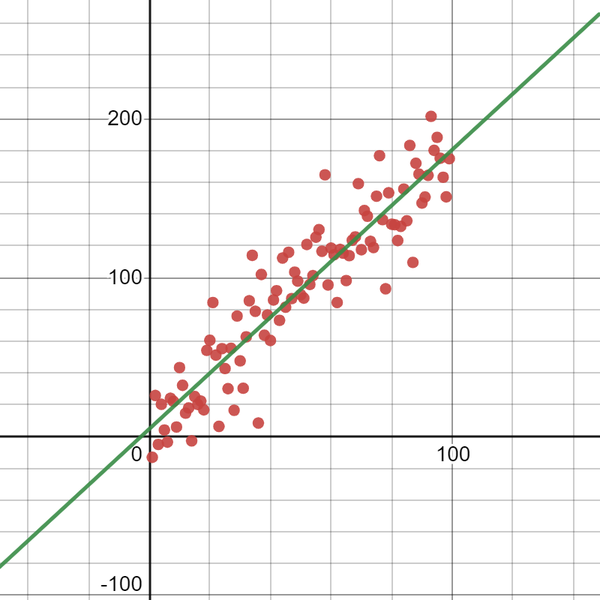
One of the most practical techniques in data analysis is fitting a line through observed data points to show a relationship between two or more variables. A regression attempts to fit a function to observed data to make predictions on new data. A linear regression fits a straight line to observed data, attempting to demonstrate a linear relationship between variables and make predictions on new data yet to be observed.
It might make more sense to see a picture rather than read a description of linear regression. There is an example of a linear regression in Figure 5-1.
Linear regression is a workhorse of data science and statistics and not only applies concepts we learned in previous chapters but sets up new foundations for later topics like neural networks (Chapter 7) and logistic regression (Chapter 6). This relatively simple technique has been around for more than two hundred years and contemporarily is branded as a form of machine learning.
Machine learning practitioners often take a different approach to validation, starting with a train-test split of the data. Statisticians are more likely to use metrics like prediction intervals and correlation for statistical significance. We will cover both schools of thought so readers can bridge the ever-widening gap between the two disciplines, and thus find themselves best equipped to wear both hats.

Get Essential Math for Data Science now with the O’Reilly learning platform.
O’Reilly members experience books, live events, courses curated by job role, and more from O’Reilly and nearly 200 top publishers.

