Part III. Cleaning and Exploring Data with pandas
In this part of the book, in the second phase of our toolchain (see Figure III-1), we take the Nobel Prize dataset we just scraped with Scrapy in Chapter 6 and first clean it up, then explore it for interesting nuggets. The principal tools weâll be using are the large Python libraries Matplotlib and pandas.
Note
The second edition of this book is using the same Nobel dataset scraped in the first. It was felt that available time was better spent writing new material and updating all the libraries than changing the exploration and analysis. Dataviz usually involves working with older datasets, and the few additional Nobel winners donât change the substance of the material at all.
pandas will be introduced in the next couple of chapters, along with its building block, NumPy. In Chapter 9, weâll use pandas to clean the Nobel dataset. Then in Chapter 11, in conjunction with Pythonâs plotting library Matplotlib, weâll use it to explore it.
In Part IV, weâll see how to deliver the freshly cleaned Nobel Prize dataset to the browser, using Pythonâs Flask web server.
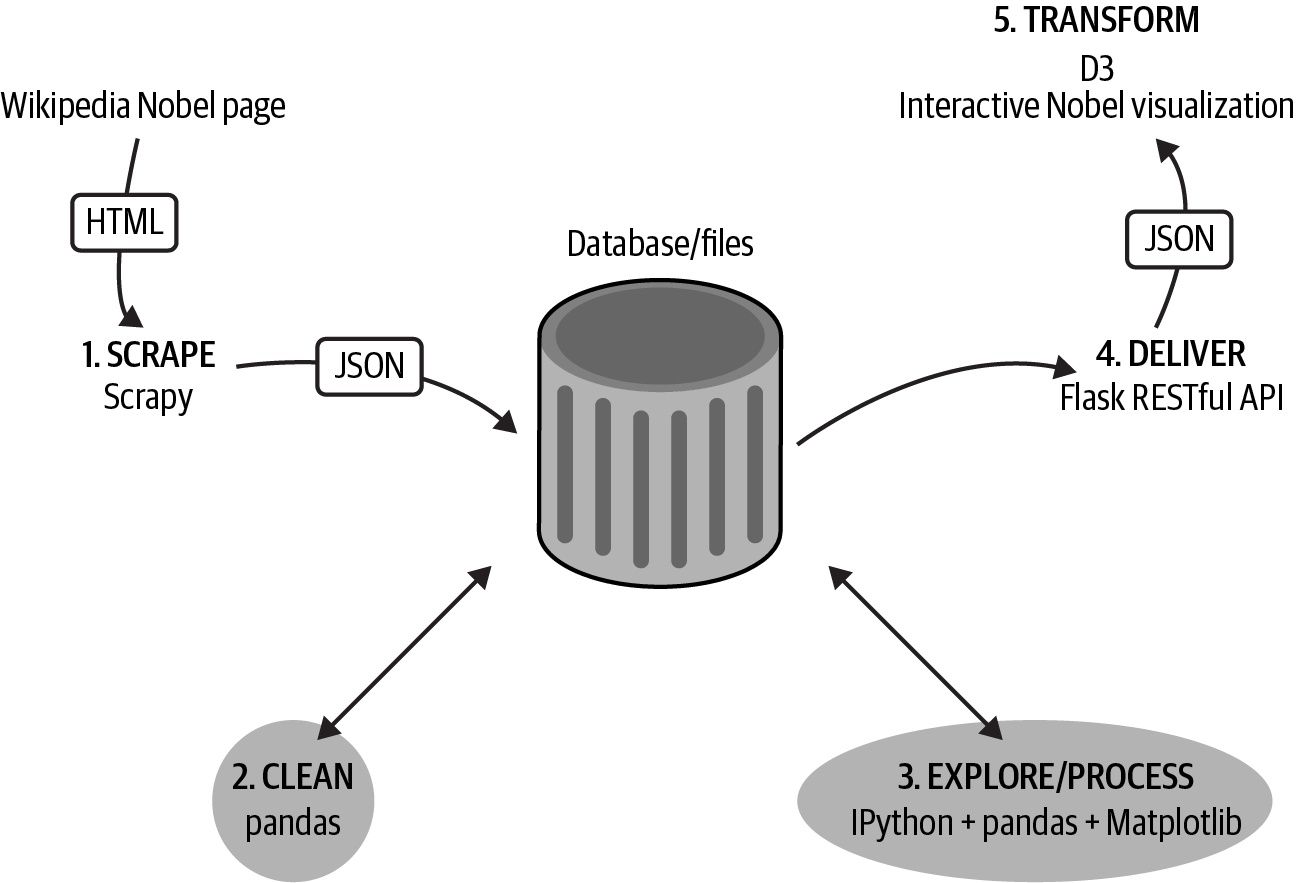
Figure III-1. Our dataviz toolchain: cleaning and exploring the data
Tip
You can find the code for this part of the book at the bookâs GitHub repo.
Get Data Visualization with Python and JavaScript, 2nd Edition now with the O’Reilly learning platform.
O’Reilly members experience books, live events, courses curated by job role, and more from O’Reilly and nearly 200 top publishers.

