Part IV. Delivering the Data
In this part of the book, weâll see how to deliver our select Nobel Prize dataset, recently cleaned and explored, to the browser, wherein JavaScript and D3 will turn it into an engaging, interactive visualization (see Figure IV-1).
The great thing about using a general-purpose library like Python is that you can as easily roll a web server in a few, impressively succinct lines, as mine your data with powerful data-processing libraries.
The key server tool in our toolchain is Flask, Pythonâs powerful but lightweight web framework. In Chapter 12, weâll see how to serve your data statically (serving system files) and dynamically, usually as a database selection specified in the request. In Chapter 13, weâll see how two Flask-based libraries make creating a RESTful web API the work of a few lines of Python.
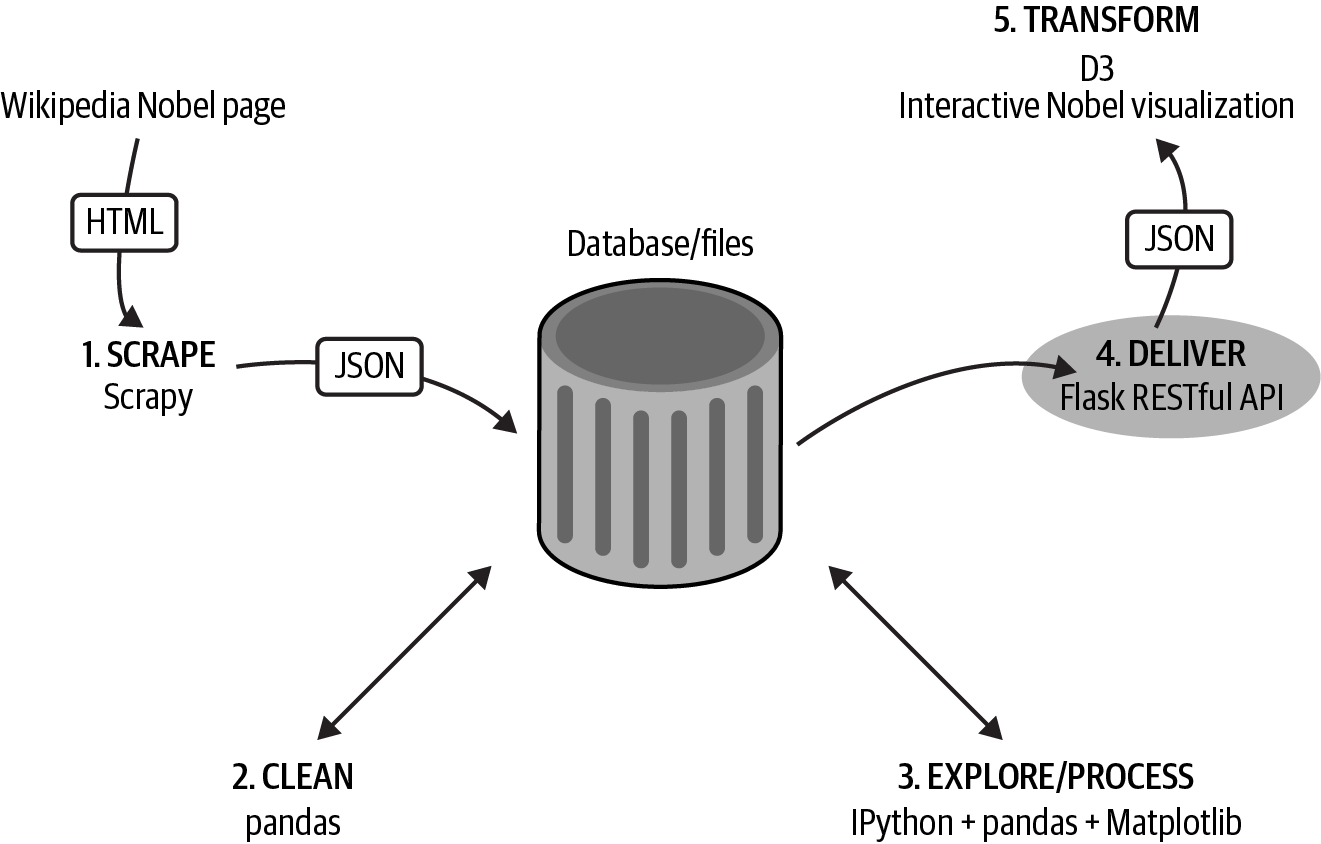
Figure IV-1. Delivering the data
Tip
You can find the code for this part of the book at the bookâs GitHub repo.
Get Data Visualization with Python and JavaScript, 2nd Edition now with the O’Reilly learning platform.
O’Reilly members experience books, live events, courses curated by job role, and more from O’Reilly and nearly 200 top publishers.

