Part II. Getting Your Data
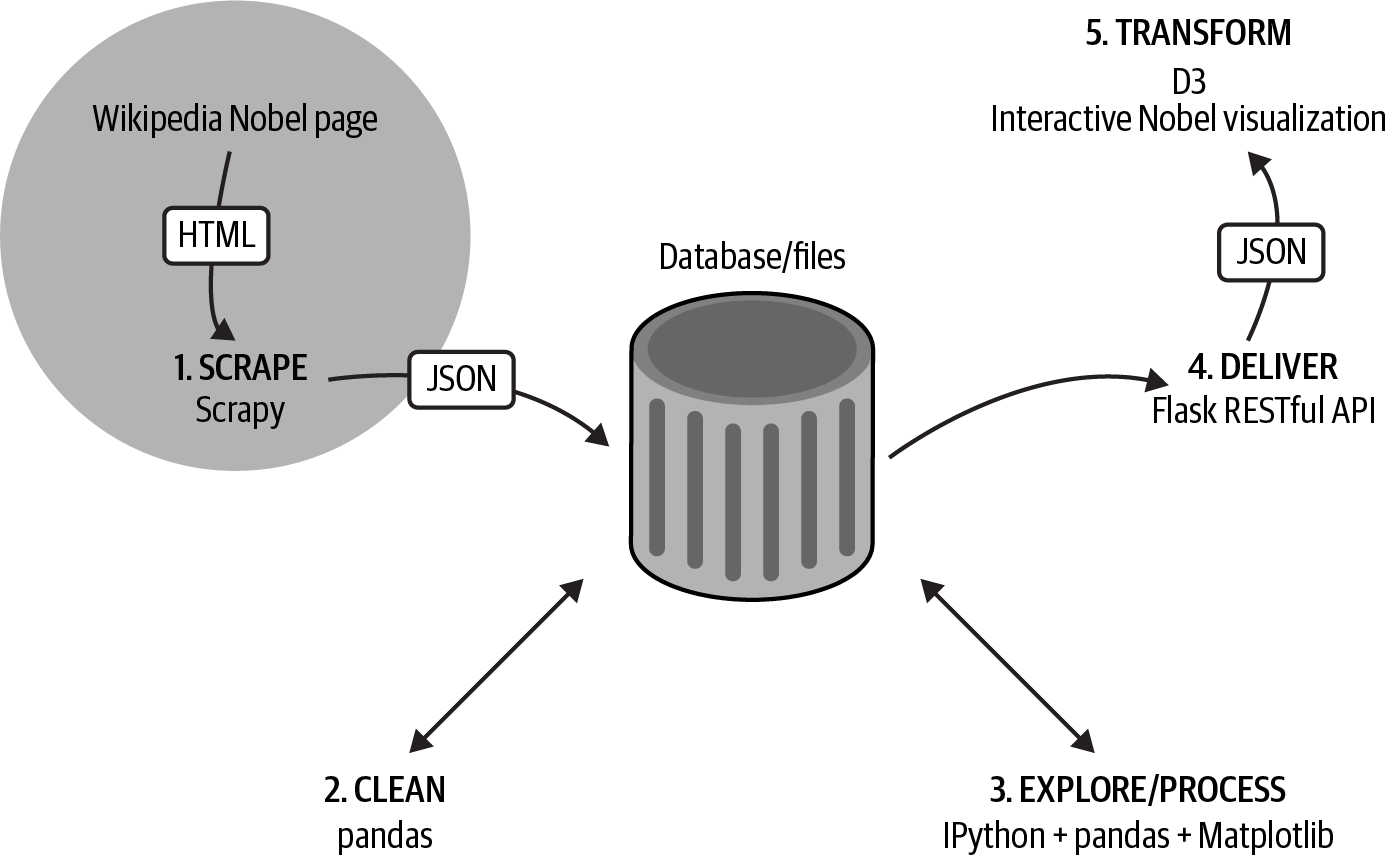
In this part of the book, we start our journey along the dataviz toolchain (see Figure II-1), beginning with a couple of chapters on how to get your data if it hasnât been provided for you.
In Chapter 5 we see how to get data off the web, using Pythonâs Requests library to grab web-based files and consume RESTful APIs. We also see how to use a couple of Python libraries that wrap more complex web APIs, namely Twitter (with Pythonâs Tweepy) and Google Docs. The chapter ends with an example of lightweight web scraping with the Beautiful Soup library.
In Chapter 6 we use Scrapy, Pythonâs industrial-strength web scraper, to get the Nobel Prize dataset weâll be using for our web visualization. With this dirty dataset to hand, weâre ready for the next part of the book, Part III.

Figure II-1. Our dataviz toolchain: getting the data
Tip
You can find the code for this part of the book at the bookâs GitHub repo.
Get Data Visualization with Python and JavaScript, 2nd Edition now with the O’Reilly learning platform.
O’Reilly members experience books, live events, courses curated by job role, and more from O’Reilly and nearly 200 top publishers.

