Chapter 1. Making Better Decisions Based on Data
The primary purpose of data analysis is to make better decisions. There is rarely any need for us to spend time analyzing data if we aren’t under pressure to make a decision based on the results of that analysis. When you are purchasing a car, you might ask the seller what year the car was manufactured and the odometer reading. Knowing the age of the car allows you to estimate the potential value of the car. Dividing the odometer reading by the age of the car allows you to discern how hard the car has been driven, and whether it is likely to last the five years you plan to keep it. Had you not cared about purchasing the car, there would have been no need for you to do this data analysis.
In fact, we can go further—the purpose of collecting data is, in many cases, only so that you can later perform data analysis and make decisions based on that analysis (see Figure 1-1). When you asked the seller the age of the car and its mileage, you were collecting data to carry out your data analysis. But it goes beyond your data collection. The car has an odometer in the first place because many people, not just potential buyers, will need to make decisions based on the mileage of the car. The odometer reading needs to support many decisions—should the manufacturer pay for a failed transmission? Is it time for an oil change? The analysis for each of these decisions is different, but they all rely on the fact that the mileage data has been collected.
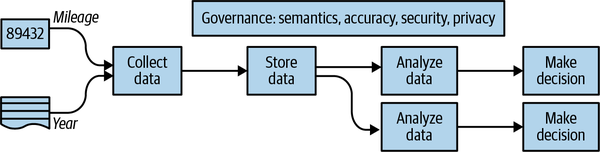
Figure 1-1. The purpose of collecting data is to make decisions with it.
If you are in the business of making a lot of decisions using car mileage, it makes sense to store the data that you have collected so that future decisions are easier to make. Collecting data takes time and effort, whereas storing it is relatively inexpensive. Of course, you have to plan on storing the data in a way that you will know what it means when you need it later. This is called capturing the semantics of the data and is an important aspect of data governance, to ensure that data is useful for decision making.
Collecting data in a form that enables decisions to be made places requirements on the collecting infrastructure and the security of such infrastructure. How does the insurance company that receives an accident claim and needs to pay its customer the car’s value know that the odometer reading is accurate? How are odometers calibrated? What kinds of safeguards are in place to ensure that the odometer has not been tampered with? What happens if the tampering is inadvertent, such as installing tires whose size is different from what was used to calibrate the odometer? The auditability of data is important whenever there are multiple parties involved, and ownership and use of the data are separate. When data is unverifiable, markets fail, optimal decisions cannot be made, and the parties involved need to resort to signaling and screening.1
Not all data is as expensive to collect and secure as the odometer reading of a car.2 The cost of sensors has dropped dramatically in recent decades, and many of our daily processes produce so much data that we find ourselves in possession of data that we had no intention of explicitly collecting. Because the hardware to collect, ingest, and store the data has become cheaper, we often default to retaining the data indefinitely, keeping it around for no discernible reason. As the size of data within an organization increases, it becomes more and more essential to organize and catalog it carefully. So, if we’re to perform analysis on all of this data that we somehow managed to collect and store, we better have a purpose for it. Labor remains expensive.
Another reason to be purposeful about the data we collect and store is that a lot of it is about people. Knowing the mileage of the car that someone drives gives us a lot of information about them, and this is information that they may not want to share other than for the specific purpose of estimating the market price of their car. Privacy and confidentiality need to be considered even before any data is collected, so that appropriate decisions can be made about what data to collect, how to control access to it, and how long to retain it. This is even more important when the data is provided at significant cost, risk, and/or loss of bodily autonomy, as is the case for much biomedical patient data. Having a data privacy expert examine your schema and data protection practices is an investment that will pay for itself manyfold in terms of regulatory compliance and public relations.
Data analysis is usually triggered because a decision needs to be made. To move into a market or not? To pay a commission or not? How high to bid up the price? How many bags to purchase? Whether to buy now or wait a week? The decisions keep multiplying, and because data is so ubiquitous now, we no longer need to make those decisions based on heuristics or simple rules of thumb. We can now make those decisions in a data-driven manner.
Of course, we don’t need to create the systems and tools to make every data-driven decision ourselves. The use case of estimating the value of a car that has been driven a certain distance is common enough that there are several companies that provide this as a service—they will verify that an odometer is accurate, confirm that the car hasn’t been in an accident, and compare the asking price against the typical selling price of cars in your market. The real value, therefore, comes not in making a data-driven decision once, but in being able to do it systematically and provide it as a service.3 This also allows companies to specialize in different business areas and continuously improve the accuracy and value of the decisions that can be made.
Many Similar Decisions
Because of the low costs associated with sensors and storage, there are many industries and use cases that have the potential to support data-driven decision making. If you are working in such an industry, or you want to start a company that will address such a use case, the possibilities for supporting data-driven decision making have just become wider. In some cases, you will need to collect the data. In others, you will have access to data that was already collected, and, in many cases, you will need to supplement the data you have with other datasets that you will need to hunt down. In all these cases, being able to carry out data analysis to support decision making systematically on behalf of users is one of the most important skills to possess.
In this book, I will take a decision that needs to be made and apply different statistical and machine learning methods to gain insight into making that decision. However, we don’t want to make that decision just once, even though we might occasionally pose it that way. Instead, we will look at how to make the decision in a systematic manner so that we use the same algorithm to make the decision many, many, many times. Our ultimate goal will be to provide this decision-making capability as a service to our customers—they will tell us the things they reasonably can be expected to know, and we will either know or infer the rest (because we have been systematically collecting data). Based on this data, we will suggest the optimal decision.
Whether or not a decision is a one-off is the primary difference between data analytics and data science. Data analytics is about manually analyzing data to make a single decision or answer a single question. Data science is about developing a technique (called a model or algorithm) so that similar decisions can be made in a systematic way. Often, data science is about automating and optimizing the decision-making process that was first determined through data analysis.4
When we are collecting the data, we will need to look at how to make the data secure. This will include how to ensure not only that the data has not been tampered with but also that users’ private information is not compromised—for example, if we are systematically collecting odometer mileage and know the precise mileage of the car at any point in time, this knowledge becomes extremely sensitive information. Given enough other information about the customer (such as the home address and traffic patterns in the city in which the customer lives), the mileage is enough to be able to infer that person’s location at all times.5 So, the privacy implications of hosting something as seemingly innocuous as the mileage of a car can become enormous. Security implies that we need to control access to the data, and we need to maintain immutable audit logs on who has viewed or changed the data.
It is not enough to simply collect the data or use it as-is. We must understand the data. Just as we needed to know the kinds of problems associated with odometer tampering to understand the factors that go into estimating a vehicle’s value based on mileage, our analysis methods will need to consider how the data was collected in real time and the kinds of errors that could be associated with that data. Intimate knowledge of the data and its quirks is invaluable when it comes to doing data science—often the difference between a data-science startup idea that works and one that doesn’t is whether the appropriate nuances have all been thoroughly evaluated and taken into account.
When it comes to providing the decision-support capability as a service, it is not enough to simply have a way to do it in some offline system somewhere. Enabling it as a service implies a whole host of other concerns. The first set of concerns is about the quality of the decision itself—how accurate is it typically? What are the typical sources of errors? In what situations should this system not be used? The next set of concerns, however, is about the quality of service. How reliable is it? How many queries per second can it support? What is the latency between some piece of data being available and it being incorporated into the model that is used to provide systematic decision making? In short, we will use this single use case as a way to explore many different facets of practical data science.
The Role of Data Scientists
“Wait a second,” I imagine you saying, “I never signed up for queries-per-second of a web service. We have people who do that kind of stuff. My job is to write SQL queries and create reports. I don’t recognize this thing you are talking about. It’s not what I do at all.” Or perhaps the first part of the discussion was what puzzled you. “Decision making? That’s for the business people. Me? What I do is to design data processing systems. I can provision infrastructure, tell you what our systems are doing right now, and keep it all secure. Data science sure sounds fancy, but I do engineering. When you said Data Science on the Google Cloud Platform, I was thinking that you were going to talk about how to keep the systems humming and how to offload bursts of activity to the cloud.” A third set of people are wondering, “How is any of this data science? Where’s the discussion of different types of models and of how to make statistical inferences and evaluate them? Where’s the math? Why are you talking to data analysts and engineers? Talk to me, I’ve got a PhD.” These are fair points—I seem to be mixing up the jobs done by different sets of people in your organization.
In other words, you might agree with the following:
-
Data analysis is there to support decision making.
-
Decision making in a data-driven manner can be superior to heuristics.
-
The accuracy of the decision models depends on your choice of the right statistical or machine learning approach.
-
Nuances in the data can completely invalidate your modeling, so understanding the data and its quirks is crucial.
-
There are large market opportunities in supporting decision making systematically and providing it as a service.
-
Such services require ongoing data collection and model updates.
-
Ongoing data collection implies robust security and auditing.
-
Customers of the service require reliability, accuracy, and latency assurances.
What you might not agree with is whether these aspects are all things that you, personally and professionally, need to be concerned about. Instead, you might think of yourself as a data analyst, a data engineer, or a data scientist and not care about how the other roles do whatever it is that they do.
There are three answers to this objection:
-
In any situation where you have small numbers of people doing ambitious things—a scrappy company, an innovative startup, an underfunded nonprofit, or an overextended research lab—you will find yourself playing all these roles, so learn the full lifecycle.
-
The public cloud makes it relatively easy to learn all the roles, so why not be a full stack data scientist?
-
Even if you work in a large company where these tasks are carried out by different roles, it is helpful to understand the end-to-end process and concerns at each stage. This will help you collaborate with other teams better.
Let’s take these answers one by one.
Scrappy Environment
At Google, we look at the role of a data engineer quite expansively. Just as we refer to all our technical staff as engineers, we look at data engineers as an inclusive term for anyone who can “shape business outcomes by performing data analysis.” To perform data analysis, you begin by preparing the data so that you can analyze it at scale. It is not enough to simply count and sum and graph the results using SQL queries and charting software—you must understand the nuances of the data and the statistical framework within which you are interpreting the results. This ability to prepare the data and carry out statistically valid data analysis to solve specific business problems is of paramount importance—the queries, the reports, and the graphs are not the end goal. A verifiably accurate decision is.
Of course, it is not enough to do one-off data analysis. That data analysis needs to scale. In other words, an accurate decision-making process must be repeatable and be capable of being carried out by many users, not just you. The way to scale up one-off data analysis is to make it automated. After a data engineer has devised the algorithm, they should be able to make it systematic and repeatable. Just as it is a lot easier when the folks in charge of systems reliability can make code changes themselves,6 it is considerably easier when people who understand statistics and machine learning can code those models themselves. A data engineer, Google believes, should be able to go from building statistical and machine learning models to automating them. They can do this only if they are capable of designing, building, and troubleshooting data processing systems that are secure, responsible, reliable, fault-tolerant, scalable, and efficient.
This desire to have engineers who know data science and data scientists who can code is not Google’s alone—it’s common at technologically sophisticated organizations and at small companies. When a scrappy company advertises for data engineers or for data scientists, what they are looking for is a person who can do all the three tasks—data preparation, data analysis, and automation—that are needed to make repeatable, scalable decisions on the basis of data.
How realistic is it for companies to expect a Renaissance person, a virtuoso in different fields? Can they reasonably expect to hire data engineers who can do data science? How likely is it that they will find someone who can design a database schema, write SQL queries, train machine learning models, code up a data processing pipeline, and figure out how to scale it all up? Surprisingly, this is a very reasonable expectation because the amount of knowledge you need in order to do these jobs has become a lot less than what you needed a few years ago.
Full Stack Cloud Data Scientists
Because of the ongoing movement to the cloud, data scientists can do the job that used to be done by several people with different sets of skills. With the advent of autoscaling, serverless, managed infrastructure that is easy to program, there are more and more people who can build scalable systems. Therefore, it is now reasonable to expect to be able to hire data scientists who are capable of creating holistic data-driven solutions to your thorniest problems. You don’t need to be a polymath to be a full stack data scientist—you simply need to learn how to do data science on the cloud.
Saying that the cloud is what makes full stack data scientists possible seems like a very tall claim. This hinges on what I mean by “cloud”—I don’t mean simply migrating workloads that run on premises to infrastructure that is owned by a public cloud vendor. I’m talking, instead, about truly autoscaling, managed services that automate a lot of the infrastructure provisioning, monitoring, and management—services such as Google BigQuery, Vertex AI, Cloud Dataflow, and Cloud Run on Google Cloud Platform. When you consider that the scaling and fault-tolerance of many data analysis and processing workloads can be effectively automated, provided the right set of tools is being used, it is clear that the amount of IT support that a data scientist needs dramatically reduces with a migration to the cloud.
At the same time, data science tools are becoming simpler and simpler to use. The wide availability of frameworks like Spark, Pandas, and Keras has made data science and data science tools extremely accessible to the average developer—no longer do you need to be a specialist in data science to create a statistical model or train a random forest. This has opened up the field of data science to people in more traditional IT roles.
Similarly, data analysts and database administrators today can have completely different backgrounds and skill sets because data analysis has usually involved serious SQL wizardry, and database administration has typically involved deep knowledge of database indices and tuning. With the introduction of tools like BigQuery, in which tables are denormalized and the administration overhead is minimal, the role of a database administrator is considerably diminished. The growing availability of turnkey visualization tools like Tableau and Looker that connect to all the data stores within an enterprise makes it possible for a wider range of people to directly interact with enterprise warehouses and pull together compelling reports and insights.
The reason that all these data-related roles are merging together, then, is because the infrastructure problem is becoming less intense and the data analysis and modeling domain is becoming more democratized.
If you think of yourself today as a data scientist, or a data analyst, or a database administrator, or a systems programmer, this is either totally exhilarating or totally unrealistic. It is exhilarating if you can’t wait to do all the other tasks that you’ve considered beyond your ken if the barriers to entry have fallen as low as I claim they have. If you are excited and raring to learn the things you will need to know in this new world of data, welcome!7 This book is for you.
If my vision of a blend of roles strikes you as an unlikely dystopian future, hear me out. The vision of autoscaling services that require very little in the form of infrastructure management might be completely alien to your experience if you are in an enterprise environment that is notoriously slow moving—there is no way, you might think, that data roles are going to change as dramatically as all that by the time you retire.
Well, maybe. I don’t know where you work or how open to change your organization is. What I believe, though, is that more and more organizations and more and more industries are going to be like digital natives. There will be increasingly more openings for full stack data scientists, and data engineers will be as sought after as data scientists are today. This is because data engineers will be people who can do data science and know enough about infrastructure so as to be able to run their data science workloads on the public cloud. It will be worthwhile for you to learn data science terminology and data science frameworks, and make yourself more valuable for the next decade.
Collaboration
Even if you work in a company with strict separation of responsibilities, it can be helpful to know how the other teams do their work. This is because there are many artifacts that they create that you will use, or that you will create and they will use. Knowing their requirements and constraints will help you be more effective at communicating across organizational boundaries.
The various job roles related to data and machine learning are shown in Figure 1-2. All these roles collaborate in creating a production machine learning model. Between data ingestion and the end-user interface, there are multiple handoffs. Every such handoff presents an opportunity for misunderstanding the requirements of the next stage or for an inability to take over what’s been created at the previous stage.
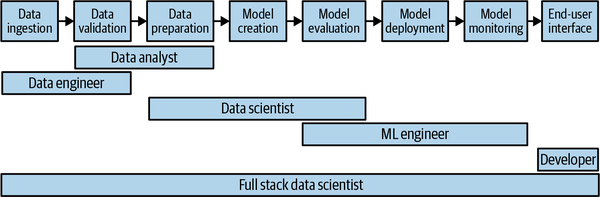
Figure 1-2. There are many job roles that need to collaborate to take a data science solution from idea to production. Every handoff carries a risk of failure.
Understanding the adjacent roles, the tools they work with, and the infrastructure that they use can help you reduce the chances of the baton getting dropped.
That said, it is very difficult to get a clean separation of responsibilities—the best organizations that I know, the ones that have hundreds to thousands of machine learning models in production, employ full stack data scientists that work on a problem from inception to production. They may have specialist data analysts, data engineers, data scientists, or ML engineers, but mostly in a maintenance capacity—the innovation tends to be done by the full stack folks. Even the full stack data scientists have areas in which they are stronger and areas where they collaborate with specialists.
Best Practices
This entire book consists of an extended case study. Solving a real-world, practical problem will help cut through all the hype that surrounds big data, machine learning, cloud computing, and so on. Pulling a case study apart and putting it together in multiple ways illuminates the capabilities and shortcomings of the various big data and machine learning tools that are available to you. A case study can help you identify the kinds of data-driven decisions that you can make in your business and illuminate the considerations behind the data you need to collect and curate, as well as the kinds of statistical and machine learning models you can use. I will attempt, throughout this book, to apply current best practices.
Simple to Complex Solutions
One of the ways that this book mirrors practice is that I use a real-world dataset to solve a realistic scenario and address problems as they come up. So, I will begin with a decision that needs to be made and apply different statistical and machine learning methods to gain insight into making that decision in a data-driven manner. This will give you the ability to explore other problems and the confidence to solve them from first principles. As with most things, I will begin with simple solutions and work my way to more complex ones. Starting with a complex solution will only obscure details about the problem that are better understood when solving it in simpler ways. Of course, the simpler solutions will have drawbacks, and these will help to motivate the need for additional complexity.
One thing that I do not do, however, is to go back and retrofit earlier solutions based on knowledge that I gain in the process of carrying out more sophisticated approaches. In your practical work, however, I strongly recommend that you maintain the software associated with early attempts at a problem, and that you go back and continuously enhance those early attempts with what you learn along the way. Parallel experimentation is the name of the game. Due to the linear nature of a book, I don’t do it, but I heartily recommend that you continue to actively maintain several models. Given the choice of two models with similar accuracy measures, you can then choose the simpler one—it makes no sense to use more complex models if a simpler approach can work with some modifications.8 Another reason to have multiple models is that a drop-in replacement is useful to have if you discover that the current production model drops in accuracy or is discovered to have unwanted behaviors.
Cloud Computing
Before I joined Google, I was a research scientist working on machine learning algorithms for weather diagnosis and prediction. The machine learning models involved multiple weather sensors, but were highly dependent on weather radar data. A few years ago, when we undertook a project to reanalyze historical weather radar data using the latest algorithms, it took us four years to do. However, more recently, my team was able to build rainfall estimates off the same dataset, but were able to traverse the dataset in about two weeks. You can imagine the pace of innovation that results when you take something that used to take four years and make it doable in two weeks.
Four years to two weeks. The reason was that much of the work as recently as five years ago involved moving data around. We’d retrieve data from tape drives, stage it to disk, process it, and move it off to make way for the next set of data. Figuring out what jobs had failed was time consuming, and retrying failed jobs involved multiple steps including a human in the loop. We were running it on a cluster of machines that had a fixed size. The combination of all these things meant that it took incredibly long periods of time to process the historical archive. After we began doing everything on the public cloud, we found that we could store all of the radar data on cloud storage and, as long as we were accessing it from virtual machines (VMs) in the same region, data transfer speeds were fast enough. We still had to stage the data to disks, carry out the computation, and bring down the VMs, but this was a lot more manageable. Simply lowering the amount of data movement between tape and disk and running the processes on many more machines enabled us to carry out processing much faster; to the credit of elasticity (the ability to seamlessly increase the number of resources we can assign to a job in the public cloud.
Was it more expensive to run the jobs on 10 times more machines than we did when we did the processing on premises? No, because the economics are usually in favor of renting on demand rather than buying the processing power outright, especially if you will not be using the machines 24-7. Whether you run 10 machines for 10 hours or 100 machines for 1 hour, the cost remains the same. Why not, then, get your answers in an hour rather than 10 hours?
In this book, we will do all our data science on Google Cloud in order to take advantage of the near-infinite scale that the public cloud offers.
Serverless
When we did our weather data preparation using cloud-based VMs, we were still not taking full advantage of what the cloud has to offer. We should have completely foregone the process of spinning up VMs, installing software on them, and looking for failed jobs—what we should have done was to use an autoscaling data processing framework such as BigQuery or Cloud Dataflow. Had we done that, we would have been able to run our jobs on thousands of machines and might have brought our processing time from two weeks to a few hours. Not having to manage any infrastructure is itself a huge benefit when it comes to trawling through terabytes of data. Having the data processing, analysis, and machine learning autoscale to thousands of machines is a bonus.
The key benefit of performing data engineering in the cloud is the amount of time that it saves you.9 You shouldn’t need to wait days or months—instead, because many jobs are embarrassingly parallel, you can get your results in minutes to hours by having them run on thousands of machines. You might not be able to afford permanently owning so many machines, but it is definitely possible to rent them for minutes at a time. These time savings make autoscaled services on a public cloud the logical choice to carry out data processing.
Running data jobs on thousands of machines for minutes at a time requires fully managed services. Storing the data locally on the virtual machines or persistent disks as with the Apache Hadoop cluster doesn’t scale unless you know precisely what jobs are going to be run, when, and where. You will not be able to downsize the cluster of machines if you don’t have automatic retries for failed jobs and more importantly, shuffle the data around in remaining data nodes (assuming there is enough free space). The total computation time will be the time taken by the most overloaded worker unless you have dynamic task shifting among the nodes in the cluster. All of these point to the need for autoscaling services that dynamically resize the cluster, split jobs down into tasks, move tasks between compute nodes, and can rely on highly efficient networks to move data to the nodes that are doing the processing.
On Google Cloud Platform, the key autoscaling, fully managed, “serverless” services are BigQuery (for data analytics), Cloud Spanner (for databases), Cloud Dataflow (for data processing pipelines), Cloud Pub/Sub (for message-driven systems), Cloud Bigtable (for high-throughput ingest), Cloud Run or Cloud Functions (for applications, tasks), and Vertex AI (for machine learning).10 Using autoscaled services like these makes it possible for a data engineer to begin tackling more complex business problems because they have been freed from the world of managing their own machines and software installations whether in the form of bare hardware, virtual machines, or containers. Given the choice between a product that requires you to first configure a container, server, or cluster, and another product that frees you from those considerations, choose the serverless one. You will have more time to solve the problems that actually matter to your business.
A Probabilistic Decision
Imagine that you are about to take a flight and, just before the flight takes off from the runway (and you are asked to switch off your phone), you have the opportunity to send one last text message. It is past the published departure time and you are a bit anxious. Figure 1-3 presents a graphic view of the scenario.
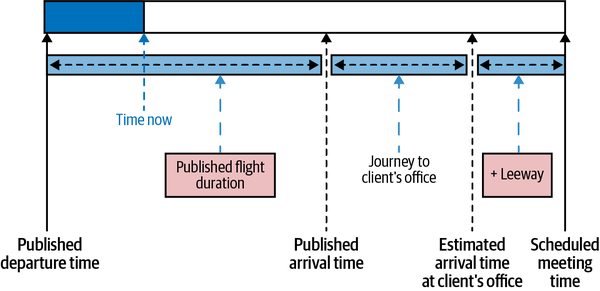
Figure 1-3. A graphic illustration of the case study: if the flight departs late, should the road warrior cancel the meeting?
The reason for your anxiety is that you have scheduled an important meeting with a client at its offices. As befits a rational data scientist,11 you scheduled things rather precisely. You have taken the airline at its word with respect to when the flight would arrive, accounted for the time to hail a taxi, and used an online mapping tool to estimate the time to the client’s office. Then, you added some leeway (say 30 minutes) and told the client what time you’d meet them. And now, it turns out that the flight is departing late. So, should you send a text informing your client that you will not be able to make the meeting because your flight will be late or should you not?
This decision could be made in many ways, including by gut instinct and using heuristics. Being very rational people, we (you and I) will make this decision informed by data. Also, we see that this is a decision made by many of the road warriors in our company day in and day out. It would be a good thing if we could do it in a systematic way and have a corporate server send out an alert to travelers about anticipated delays if we see events on their calendar that they are likely to miss. Let’s build a data framework to solve this problem.
Probabilistic Approach
If we decide to make the decision in a data-driven way, there are several approaches we can take. Should we cancel the meeting if there is greater than a 30% chance that you will miss it? Or should we assign a cost to postponing the meeting (the client might go with our competition before we get a chance to demonstrate our great product) versus not making it to a scheduled meeting (the client might never take our calls again) and minimize our expected loss in revenue? The probabilistic approach translates to risk, and many practical decisions hinge on risk. In addition, the probabilistic approach is more general because if we know the probability and the monetary loss associated with missing the meeting, it is possible to compute the expected value of any decision that we make. For example, suppose the chance of missing the meeting is 20% and we decide to not cancel the meeting (because 20% is less than our decision threshold of 30%). But there is only a 25% chance that the client will sign the big deal (worth a cool million bucks) for which you are meeting them. Because there is an 80% chance that we will make the meeting, the expected upside value of not canceling the meeting is 0.8 × 0.25 × 1 million, or $200,000. The downside value of not canceling is that we do miss the meeting. Assuming that the client is 90% likely to blow us off in the future if we miss a meeting with them, the expected downside is 0.2 × 0.9 × 0.25 × 1 million, or $45,000. This yields an expected value of $155,000 in favor of not canceling the meeting. We can adjust these numbers to come up with an appropriate probabilistic decision threshold.
Another advantage of a probabilistic approach is that we can directly take into account human psychology. You might feel frazzled if you arrive at a meeting only two minutes before it starts and, as a result, might not be able to perform at your best. It could be that arriving only two minutes early to a very important meeting doesn’t feel like being on time. This obviously varies from person to person, but let’s say that this time interval that you need to settle down is 15 minutes. You want to cancel a meeting for which you cannot arrive 15 minutes early. You could also treat this time interval as your personal risk aversion threshold, a final bit of headroom if you will. Thus, you want to arrive at the client’s site 15 minutes before the meeting and you want to cancel the meeting if there is a less than 70% chance of doing that. This, then, is our decision criterion:
Cancel the client meeting if the probability of arriving 15 minutes early is 70% or less.
I’ve explained the 15 minutes, but I haven’t explained the 70%. Surely, you can use the aforementioned model diagram (Figure 1-3, in which we modeled our journey from the airport to the client’s office), plug in the actual departure delay, and figure out what time you will arrive at the client’s offices. If that is less than 15 minutes before the meeting starts, you should cancel! Where does the 70% come from?
Probability Density Function
It is important to realize that the model diagram (Figure 1-3) of times is not exact. The probabilistic decision framework gives you a way to treat this in a principled way. For example, although the airline company says that the flight duration is 127 minutes and publishes an arrival time, not all flights are exactly 127 minutes long. If the plane happens to take off with the wind, catch a tail wind, and land against the wind, the flight might take only 90 minutes. Flights for which the winds are all precisely wrong might take 127 minutes (i.e., the airline might be publishing worst-case scenarios for the route). Google Maps predicts journey times based on historical data, and the actual journeys by taxi will be centered around those times. Your estimate of how long it takes to walk from the airport gate to the taxi stand might be predicated on landing at a specific gate, and actual times may vary. So, even though the model depicts a certain time between airline departure and your arrival at the client site, this is not an exact number. The actual time between departure and arrival might have a distribution that looks like that shown in Figure 1-4.
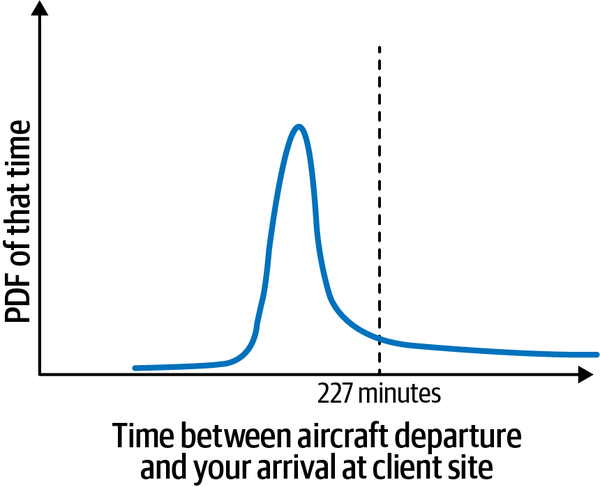
Figure 1-4. There are many possible values for the time differences between aircraft departure and your arrival at a client site, and the distribution of that value is called the probability density function.
The curve in Figure 1-4 is referred to as the probability density function (abbreviated as the PDF). In fact, the PDF can be (and often is) greater than one. In order to get a probability, you will need to integrate the probability density function.12 A simple way to do this integration is provided by the cumulative distribution function (CDF).
Cumulative Distribution Function
The cumulative probability distribution function of a value x is the probability that the observed value X is less than the threshold x. For example, you can get the cumulative distribution function (CDF) for 227 minutes by finding the fraction of flights for which the time difference is less than 227 minutes, as shown in Figure 1-5.
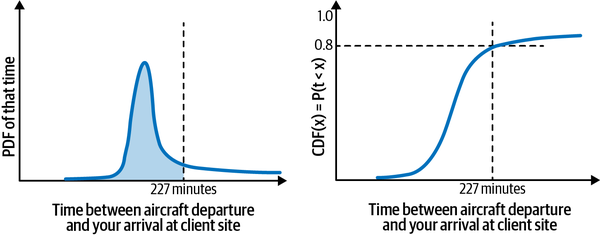
Figure 1-5. The CDF is the area under the curve of the PDF. It is easier to understand and keep track of than the PDF. In particular, it is bounded between 0 and 1, whereas the PDF could be greater than 1.
Let’s interpret the graph in Figure 1-5. What does a CDF (227 minutes) = 0.8 mean? It means that 80% of flights will arrive such that we will make it to the client’s site in less than 227 minutes—this includes both the situation in which we can make it in 100 minutes and the situation in which it takes us 226 minutes. The CDF, unlike the PDF, is bounded between 0 and 1. The y-axis value is a probability, just not the probability of an exact value. It is, instead, the probability of observing all values less than that value.
Because the time to get from the arrival airport to the client’s office is unaffected by the flight’s departure delay,13 we can ignore it in our modeling. We can similarly ignore the time to walk through the airport, hail the taxi, and get ready for the meeting. So, we need only to find the probability of the arrival delay being more than 15 minutes. If that probability is 0.3 or more, we will need to cancel the meeting. In terms of the CDF, that means that the probability of arrival delays of less than 15 minutes has to be at least 0.7, as presented in Figure 1-6.
Thus, our decision criteria translate to the following:
Cancel the client meeting if the CDF of an arrival delay of 15 minutes is less than 70%.
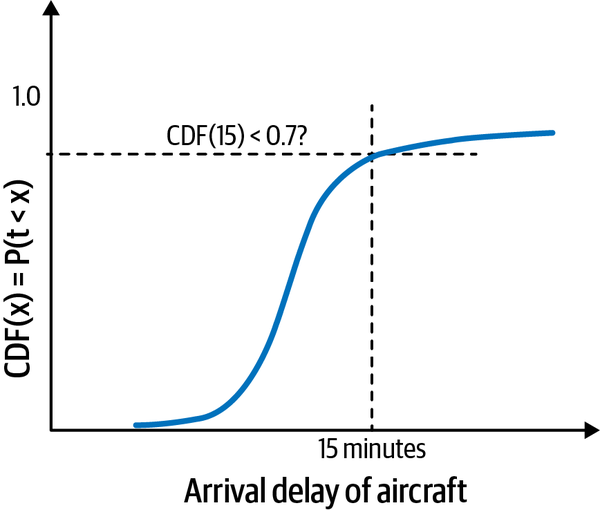
Figure 1-6. Our decision criterion is to cancel the meeting if the CDF of an arrival delay of 15 minutes is less than 70%. Loosely speaking, we want to be 70% sure of the aircraft arriving no more than 15 minutes late.
The rest of this book is going to be about building data pipelines that enable us to compute the CDF of arrival delays using statistical and machine learning models. From the computed CDF of arrival delays, we can look up the CDF of a 15-minute arrival delay and check whether it is less than 70%.
Choices Made
What data do we need to predict the probability of a specific flight delay? What tools shall we use? Should we use Hadoop? BigQuery? Should we do it on my laptop or should we do it in the public cloud? The question about data is easily answered—we will use historical flight arrival data published by the US Bureau of Transportation Statistics, analyze it, and use it to inform our decision. Often, a data scientist would choose the best tool based on their experience and just use that one tool to help make the decision, but here, I will take you on a tour of several ways that we could carry out the analysis. This will also allow us to model best practice in the sense of picking the simplest tool and analysis that suffices.
Choosing Cloud
On a cursory examination of the data, we discover that there were more than 30.6 million flights in 2015–2019.14 My laptop, nice as it is, is not going to cut it. We will do the data analysis on the public cloud. Which cloud? We will use the Google Cloud Platform (GCP). Although some of the tools we use in this book (notably Hadoop, Spark, Beam, TensorFlow, etc.) are available on other cloud platforms, the managed services I use (BigQuery, Cloud Dataproc, Cloud Dataflow, Vertex AI, etc.) are specific to GCP. Using GCP will allow me to avoid fiddling around with virtual machines and machine configuration and focus solely on the data analysis. Also, I do work at Google, so this is the platform I know best.
Not a Reference Book
This book is not an exhaustive look at data science—there are other books (often based on university courses) that do that. It is also not a reference book on Google Cloud—the documentation is much more timely and comprehensive. Instead, this book allows you to look over my shoulder as I solve one particular data science problem using a variety of methods and tools. I promise to be quite chatty and tell you what I am thinking and why I am doing what I am doing. Instead of presenting you with fully formed solutions and code, I will show you intermediate steps as I build up to a solution.
This learning material is presented to you in three forms:
-
This book that you are reading.
-
The code referenced throughout the book on GitHub. Note in particular, the README.md file in each folder of the GitHub repository.
-
Labs with instructions that allow you to try the code of this book in a sandbox environment, available at https://qwiklabs.com.
Rather than simply read this book cover to cover, I strongly encourage you to follow along with me by also taking advantage of the code. After reading each chapter, or major section in each chapter, try to repeat what I did, referring to the code if something’s not clear.
Getting Started with the Code
To begin working with the code, follow these steps:
-
Sign up for the free trial if you haven’t already done so. Otherwise, use your existing GCP account.
-
Create a new project and give it any name you want. I suggest calling it
ds-on-gcp. GCP will assign a unique project ID to your project (see Figure 1-7). You will need to provide this unique ID whenever you do anything that is billable. Once you are finished working through this book, simply delete the project to stop getting billed.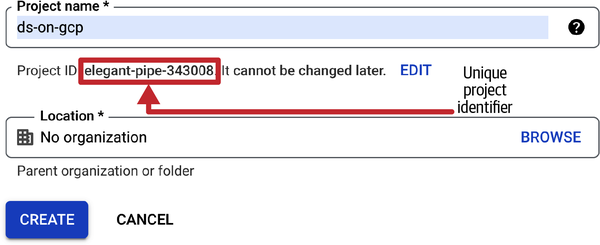
Figure 1-7. When you create a new project, GCP will assign it a unique project identifier. Use this unique identifier whenever a script or program asks for a project ID. You will also be able to get the unique identifier from the dashboard (see Figure 1-8).
-
Open Cloud Shell, your terminal access to GCP. To open Cloud Shell, on the menu bar, click the Activate Cloud Shell icon, as shown in Figure 1-8. Even though the web console is very nice, I typically prefer to script things rather than go through a GUI. To me, web GUIs are great for occasional and/or first-time use, but for repeatable tasks, nothing beats the terminal.
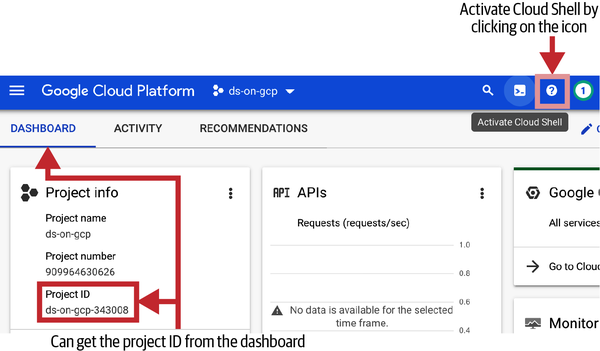
Figure 1-8. Activate Cloud Shell by clicking on the highlighted icon in the top right corner of the GCP web console. Note that the unique project identifier can be obtained at any time from the dashboard.
Cloud Shell is a micro-VM that is alive for the duration of the browser window and gives you terminal access to the micro-VM. Close the browser window, and the micro-VM goes away. The Cloud Shell VM is free and comes loaded with many of the tools that developers on Google Cloud Platform will need. For example, it has Python, Git, the Google Cloud SDK, and Orion (a web-based code editor) installed on it. Although the Cloud Shell VM is ephemeral, it is attached to a persistent disk that is tied to your user account. Files that you store in your home directory are saved across different Cloud Shell sessions.
-
In the Cloud Shell window, git clone my repository by typing the following:
git clone \
      https://github.com/GoogleCloudPlatform/data-science-on-gcp
    cd data-science-on-gcp
Because the Git repository was checked out to the home directory of the Cloud Shell micro-VM, it will be persistent across browser sessions.
-
Note that there is a directory corresponding to each chapter of this book (other than Chapters 1 and 12). In each directory, you will find a README.md file with directions on how to replicate the steps in that chapter.
Do not copy-paste code snippets from the book. Read the chapters and then try out the code by following the steps in each chapter’s README.md using the code in the repository. I recommend that you not copy-paste from electronic versions of this book.
-
The book is written for readability, not for completeness. Some flags to cloud tools may be omitted so that we can focus on the key aspect being discussed. The GitHub code will have the full command.
-
The GitHub repo will be kept up to date with new versions of cloud tools, Python, etc.
-
When following along in the book, it’s easy to miss a step.
-
Copy-paste of special characters from PDF is problematic.
That’s it. You are now ready to follow along with me. As you do, remember that you need to change my project ID to the ID of your project (you can find this on the dashboard of the Google Cloud web console, as shown in Figure 1-8) and my bucket-name to your bucket on Cloud Storage (you will create this in Chapter 2; we’ll introduce buckets at that time).
Agile Architecture for Data Science on Google Cloud
I will introduce Google Cloud products and technologies as we go along. In this section, I will provide a high-level overview of why I choose what I choose. Do not worry if you don’t recognize the names of these technologies (e.g., data warehouse) or products (e.g., BigQuery) since we will cover them in detail as we go along.
What Is Agile Architecture?
One of the principles of Agile software is that simplicity, by which we mean maximizing the amount of work not done, is essential. Another is that requirements change frequently, and so flexibility is important. An Agile architecture, therefore, is one that gives you:
-
Speed of development. You should be able to go from idea to deployment as quickly as possible.
-
Flexibility to quickly implement new features. Sometimes speed comes at the expense of flexibility—the architecture might shoehorn you into a very limited set of use cases. You don’t want that.
-
Low-maintenance. Don’t spend your time managing infrastructure.
-
Autoscaling and resiliency so that you are not spending your time monitoring infrastructure.
What does such an architecture look like on Google Cloud when it comes to Data Analytics and AI? It will use low-code and no-code services (pre-built connectors, automatic replication, ELT [extract-load-transform], AutoML) so that you get speed of development. For flexibility, the architecture will allow you to drop down to developer-friendly, powerful code (Apache Beam, SQL, TensorFlow) whenever needed. These will run on serverless infrastructure (Pub/Sub, Dataflow, BigQuery, Vertex AI) so that you get low-maintenance, autoscaling, and resiliency.
No-Code, Low-Code
When it comes to architecture, choose no-code over low-code and low-code over writing custom code. Rather than writing ETL (extract-transform-load) pipelines to transform the data you need before you land it into BigQuery, use pre-built connectors to directly land the raw data into BigQuery (see Figure 1-9). Then, transform the data into the form you need using SQL views directly in the data warehouse. You will be a lot more agile if you choose an ELT approach over an ETL approach.
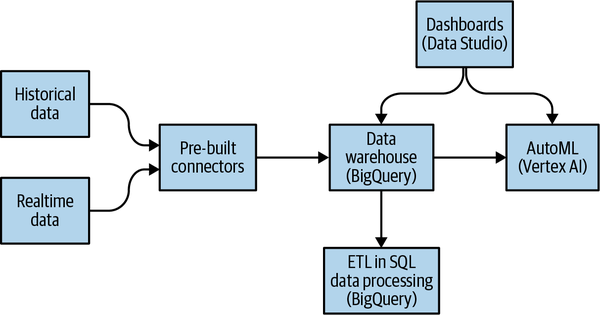
Figure 1-9. Agile architecture for most use cases.
Another place is when you choose your ML modeling framework. Don’t start with custom TensorFlow models. Start with AutoML. That’s no-code. You can invoke AutoML directly from BigQuery, avoiding the need to build complex data and ML pipelines. If necessary, move on to pre-built models from TensorFlow Hub and pre-built containers on Vertex AI. That’s low-code. Build your own custom ML models only as a last resort.
Use Managed Services
You will want to be able to drop down to code if the low-code approach is too restrictive. Fortunately, the no-code architecture described previously is a subset of the full architecture, shown in Figure 1-10, that gives you all the flexibility you need.
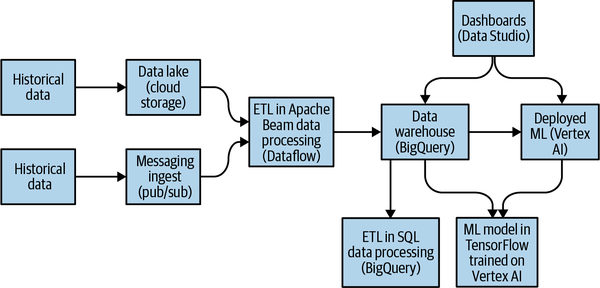
Figure 1-10. Agile architecture for analytics and AI.
When the use case warrants it, you will have the full flexibility of Apache Beam, SQL, and TensorFlow. This is critical—for use cases where the ELT + AutoML approach is too restrictive, you have the ability to drop to a ETL/Dataflow + Keras/Vertex approach.
Best of all, the architecture is unified, so you are not maintaining two stacks. Because the first architecture is a subset of the second, you can accomplish both easy and hard use cases in a unified way.
Summary
A key goal of data analysis is to be able to provide data-driven guidance toward making accurate decisions systematically. Ideally, this guidance can be provided as a service, and providing as a service gives rise to questions of service quality—both in terms of the accuracy of the guidance and the reliability, latency, and security of the implementation.
A data engineer needs to be able to go from designing data-based services and building statistical and machine learning models to implementing them as reliable, high-quality services. This has become easier with the advent of cloud services that provide an autoscaling, serverless, managed infrastructure. Also, the wide availability of data science tools has made it so that you don’t need to be a specialist in data science to create a statistical or machine learning model. As a result, the ability to work with data has spread throughout an enterprise—no longer is it a restricted skill.
Our case study involves a traveler who needs to decide whether to cancel a meeting depending on whether the flight they are on will arrive late. The decision criterion is that the meeting should be canceled if the probability of an arriving within 15 minutes of the scheduled time is less than 70%. To estimate the probability of this arrival delay, we will use historical data from the US Bureau of Transportation Statistics.
To follow along with me throughout the book, create a project on Google Cloud Platform and a clone of the GitHub repository of the source code listings in this book. Alternatively, try the code of this book in a sandbox environment using Qwiklabs. The folder for each of the chapters in GitHub contains a README.md file that lists the steps to be able to replicate what I do in the chapters. So, if you get stuck, refer to those README files.
Incidentally, the footnotes in this book are footnotes because they break the flow of the chapter. Some readers of the first edition noted that they realized only toward the middle of the book that many of the footnotes contained useful information. So, this might be a good time to read the footnotes if you have been skipping them.
Suggested Resources
What is data science on Google Cloud? What does the toolkit consist of? The data science website in Google Cloud contains a set of whitepapers and reference guides that address these topics. Bookmark this page and use it as a starting point for everything data science on GCP.
There are five key autoscaling, fully managed, serverless products for data analytics and AI on Google Cloud. We’ll cover them later in the book, but these videos and articles are a great starting point if you want to dive deeper immediately:
-
BigQuery is the serverless data warehouse that forms the heart of most data architectures built in Google Cloud. I recommend watching “Google BigQuery Introduction by Jordan Tigani”, one of the founding engineers of BigQuery, even though it is a few years old now.
-
Dataflow is the execution service for batch and streaming pipelines written using Apache Beam. Start with “What Is Dataflow?” by Google Cloud Tech, a 5-minute video that introduces what Dataflow is and how it works. This is part of the Google Cloud Drawing Board series of videos—they are quick and informative ways to learn about various topics on Google Cloud.
-
Pub/Sub is the global messaging service that can be used for use cases ranging from user interaction and real-time event distribution to refreshing distributed caches. Start from the overview documentation page. All Google Cloud products have an overview page that can serve as a launching point to learning not only what a product does but also what it can be used for and how to choose between it and other alternatives.
-
Cloud Run provides an autoscaling, serverless platform for containerized applications. You can use it for all kinds of automation and lightweight data transformation. The best way to learn Cloud Run is to try it out, and Qwiklabs provides a great set of hands-on labs in a sandbox environment. While you are there, check out the Catalog for other quests and labs on the topic of choice.
-
Vertex AI is the end-to-end ML development, deployment, and automation platform on Google Cloud. A good place to learn about it is to watch the video that accompanied its announcement at Google I/O, “Build End-to-End Solutions with Vertex AI”, by the Google Cloud Tech YouTube channel.
There are two key fully managed transaction processing databases on Google Cloud:
-
Bigtable is a distributed NoSQL database. You could, of course, learn about it from Google Cloud Tech’s overview video, “What Is Cloud Bigtable?”, or the Bigtable documentation, but I recommend you read the famous research paper that introduced the idea to the world: Fay Chang et al., “Bigtable: A Distributed Storage System for Structured Data”, 7th USENIX Symposium on Operating Systems Design and Implementation (OSDI), USENIX (2006): 205–218.
-
Spanner is a distributed SQL database that provides global strong consistency and five nines (99.999%) availability—something that greatly simplifies your architecture if you are in a domain like banking or gaming where you have concurrent users all over the world. “Why You Should Use Google’s Cloud Spanner for Your Next Game”, a 2019 blog post by Miles Ward, CTO of Google’s partner SADA, is a great starting point for Spanner and Spanner best practices.
For more on probability as applied in information theory and artificial intelligence, read either Chapter 3 of Deep Learning, “Probability and Information Theory,” by Ian Goodfellow et al. (MIT Press) or a summary of that chapter by William Green on Medium. The foundation of information theory was laid by Claude Shannon in a classic 1948 paper. He is also famous for perhaps the most influential masters thesis in history—showing how to use Boolean algebra to test circuit designs without even building the circuits in the first place.
1 The classic paper on this is George Akerlof’s 1970 paper titled “The Market for Lemons”. Akerlof, Michael Spence (who explained signaling), and Joseph Stiglitz (who explained screening) jointly received the 2001 Nobel Prize in Economics for describing this problem. In a transaction that involves asymmetric information, the party with good information signals, whereas the party with poor information screens. For example, the seller of a car (who has good information) might signal that they have a great car by publishing the repair record of the car. The buyer (who has poor information) might screen cars by rejecting any cars from cities that recently experienced a flood.
2 The odometer itself might not be all that expensive, but collecting that information and ensuring that it is correct has considerable costs. The last time I sold a car, I had to sign a statement that I had not tampered with the odometer, and that statement had to be notarized by a bank employee with a financial guarantee. This was required by the company that was loaning the purchase amount on the car to the buyer. Every auto mechanic is supposed to report odometer tampering, and there is a state government agency that enforces this rule. All of these costs are significant. Even if you disregard all these external costs, and assume that the hardware and infrastructure exists such that each car has an odometer, there is still a significant cost associated with streaming that data from cars into a central location so that you have real-time odometer readings from all the cars in your fleet. The cost of securing that data to respect the privacy of the drivers can also be quite significant.
3 Providing it as a service is often the only way to meet the mission of your organization—whether it is to monetize it, support thousands of users, or provide it at low cost to decision makers.
4 Contrary to what you may hear, it is not about whether you use SQL or Python! You can do data science in SQL—we will see BigQuery ML later on in the book, and you can use Python for one-off data analysis.
5 In 2014, New York City officials released a public dataset of New York City taxi trips in response to a Freedom of Information request. However, because it was improperly anonymized, a brute force attack was able to find out the trips associated with any specific driver. It got worse. Privacy researchers were able to cross-reference paparazzi photos (which revealed the exact location of celebrities at specific times) and figure out which celebrities don’t tip. It got even worse. By looking at people who picked up a taxi cab at the same location every morning, and correlating it with the location from where they got dropped back, they were able to identify New Yorkers who frequented strip clubs.
6 Google invented the role of Site Reliability Engineers (SREs)—these are folks in charge of keeping systems running. Unlike traditional IT, though, they know the software they are operating and are quite capable of making changes to it.
7 The words “need to know” are important here. It can sometimes be intimidating to see the breadth and depth of data science and despair of ever understanding everything. Here’s the truth: there is no one who knows the entire field in-and-out. Everyone is, at some level, glossing over some areas. Which areas? Areas that are not important to the problems that they are currently working on. This then gives you a strategy to approach data science—rather than try to learn topics (“I will learn RNNs this month”) or learn how to solve problems (“I will learn how to use AI to complete phrases”). Start with simple approaches, and stop once things become difficult and unintelligible. In most fields of AI, the simple approaches will get you quite far. Also, a deep understanding of the underlying mathematics is usually not required to implement a complex approach using frameworks like Keras.
8 This goes by the name Principle of Parsimony or Occam’s Razor and holds that the simplest explanation, with the fewest assumptions, is best. This is because simpler models are likely to fail less often because they depend on fewer assumptions. In engineering terms, another advantage of simpler models is that they tend to be less costly to implement.
9 For your organization, any time you save translates to budget savings. You get more accomplished with a smaller budget.
10 For a word that gets bandied about quite a lot, there is not much agreement on what exactly serverless means. In this book, I’ll call a service serverless if users of the service have to supply only code and not have to manage the lifecycle of the machines that the code runs on.
11 Perhaps I’m simply rationalizing my own behavior—if I’m getting to the departure gate with more than 15 minutes to spare at least once in about five flights, I decide that I must be getting to the airport too early and adjust accordingly. Fifteen minutes and 20% tend to capture my risk aversion. If you are wondering why my risk aversion threshold is not simply 15 minutes but includes an associated probabilistic threshold, read on.
12 To integrate a function is to compute the area under the curve of that function up to a specific x-value, as shown in Figure 1-5.
13 This is a simplifying assumption—if the flight was supposed to arrive at 2 p.m., and instead arrives at 4 p.m., the traveler is more likely to hit rush hour traffic.
14 Yes, this is the second edition of the book, published in 2022. The first edition of the book used only 2015 data. Here, I’ll use 2015–2019. I stopped with 2019 because 2020 was the year of the COVID-19 pandemic, and flights were rather spotty.
Get Data Science on the Google Cloud Platform, 2nd Edition now with the O’Reilly learning platform.
O’Reilly members experience books, live events, courses curated by job role, and more from O’Reilly and nearly 200 top publishers.

