Firebug
Firebug is an add-on for the Firefox web browser. It captures traffic in the Firefox browser, which is useful for debugging problems with web services. You enable Firebug by clicking the Firebug icon found in the lower-righthand corner of the Firefox web browser (shown in Figure B-13).
Figure B-13. Firebug icon
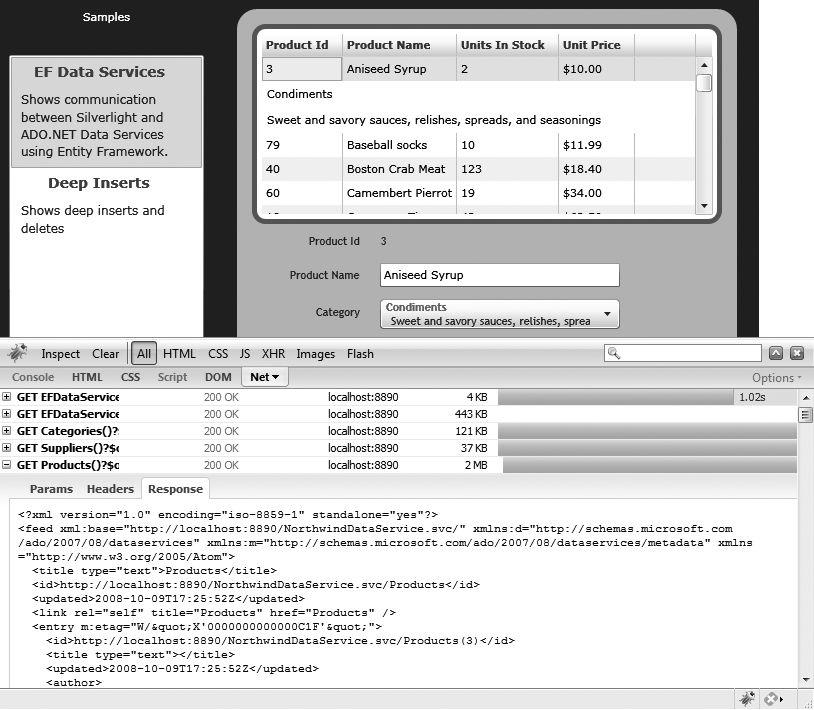
Firebug shows all web traffic from the web browser when the Net
tab is selected. You can see the parameters, headers, and response from
this view. Figure B-14 shows all
of the requests that were made from the Firefox browser when running the
EFDataServices
sample from Chapter 11.
Notice that the HTTP method, URI, status, domain, and size of the
response are displayed. This can help you with debugging cross-domain issues, because you can watch
the requests. It is also helpful when debugging, because you can examine the
exact URI and request and compare them against the expected
request.

Figure B-14. Watching requests in Firebug
Get Data-Driven Services with Silverlight 2 now with the O’Reilly learning platform.
O’Reilly members experience books, live events, courses curated by job role, and more from O’Reilly and nearly 200 top publishers.

