Chapter 1. The Cloud Native Impact on Observability
Cloud native technologies have changed how people around the world work. They allow us to build scalable, resilient, and novel software architectures with idiomatic backend systems using an open source ecosystem and open governance.
The Cloud Native Computing Foundation (CNCF) defines “cloud native” as technologies that empower organizations to build and run scalable applications in modern, dynamic environments such as public, private, and hybrid clouds.1 Containers, service meshes, microservices, immutable infrastructure, and declarative APIs exemplify this approach.
Our own in-the-trenches understanding of cloud native leads us to define cloud native technologies simply as technologies that are highly interlinked, flexible, and scalable using cloud technologies as first-class building blocks.
This then leads us to a discussion about cloud native observability. However, let’s define what observability is first. According to the CNCF, observability is “a system property that defines the degree to which the system can generate actionable insights. It allows users to understand a system’s state from these external outputs and take (corrective) action.”2
With this in mind, we are defining cloud native observability as the ability to measure how well you can understand the total state of your system with all of the complexities of a highly interlinked, flexible, and scalable system running in containers on a microservices architecture in the cloud.
With the above definition, it seems obvious that any existing principles, practices, or tools that apply to traditional observability would also apply to cloud native observability. However, as you soon will learn, this is not the case; many principles are similar but have unique challenges to overcome.
Challenges of Cloud Native Observability
What, then, is the difference between the observability of a traditional system and a cloud native system? Mostly it comes down to the three additional cloud native definitions we stated earlier:
-
Cloud native systems are commonly interlinked (e.g., via inter-service calls directly or over a service mesh), causing most failures to be cascading in nature and making it difficult to observe the exact cause versus a symptom of a failure. For example, Slack experienced a major incident caused by a cascading failure on February 22, 2022.
-
Cloud native systems are highly flexible and dynamic, making transient failures an expected state of the system, and therefore there is a greater need for gracefully handling failures, which create noise in observability systems. From October 28 to October 31 of 2021, Roblox experienced a significant systems failure because of unexpected failures in Consul (a software used for service discovery) that were not handled gracefully.
-
Cloud native systems are typically decoupled and deployed in smaller units of compute for high scalability, causing a large amount of telemetry to be added to observability systems. A study by the analyst firm Enterprise Strategy Group (ESG) concluded that larger volumes of telemetry are one of the top three concerns when using or supporting observability solutions.
These three challenges not only require better tooling and principles but also practices when dealing with highly sophisticated spiderweb-like cloud native systems.
A more day-to-day analogy is that traditional observability is akin to a simple magnet and paper clip. You know that the magnet will always attract the paper clip; each time there is no change. Same magnetic force and the same metal.
However, cloud native observability is akin to observing air pressure in a tire, which is fixed in nature until you try to observe it using an air pressure gauge. Even the very act of observing the pressure (or in our case, cloud native services) changes it!
To conclude, cloud native observability is hard because cloud native services are highly scalable and dynamic. It’s the advantages of these services that make our job harder than ever before.
Deep Dive into Observability Data
Let’s talk about what we mean by “observability data” anyway. Let’s take a look at an ecommerce system.
One part of the system is a cart service. Let’s say you ordered a box of tissues from that ecommerce website. What kind of observability data does it produce? The cart service might produce an event that would take stock from a database inventory and subtract from it one box of tissues. This event firing is both observability data and a service transaction. Notice that we have not yet explicitly talked about metrics, logs, or traces. Events are the source of observability data, such as logs, traces, and metrics, which are derived from such events that occur within a system.
Observability Data Is Growing in Scale
We described that observability data in a cloud native landscape increases exponentially. But digging deeper, what is the main cause of this increase?
There are two main factors for this ongoing explosion of observability data. They are volume and cardinality. Volume is simple, the amount of data you collect. Cardinality is much more complicated; there are many different ways you can slice and dice your data. We will discuss cardinality in more detail shortly.
Since there are more interconnected services in a cloud native environment, a greater volume of data is captured per business transaction than non–cloud native environments. Also, containers are smaller in unit size than their predecessors, and each container emits unique telemetry separately. Finally, since there are more variations of these cloud native services, that data needs to be sliced using dimensions in a myriad of different ways.
Because of the increased volume and cardinalities in real-world use cases, we posit that cloud native environments emit 10 to 100 times more data than traditional virtual machine–based environments.
As a consequence of volume and cardinalities, to achieve good observability in a cloud native system, you will have to deal with large-scale data.
Understanding Cardinality and Dimensionality
Two important concepts you’ll need to understand are cardinality and dimensionality. Cardinality is the number of possible groupings depending on the observability data’s dimensions. Dimensions are the different properties of your data, as Rob Skillington explains.3 Think of the labels on a shirt on a store shelf. Each label (in this simplified example) contains three dimensions: color, size, and type.
Each dimension increases the amount of information we have about that shirt. You could slice that information into many shapes, based on how many dimensions you use to sort it. For example, you could look by just color and size, size and type, or all three. Dimensionality means being able to slice the metrics into multiple shapes.
Increased dimensionality can greatly increase cardinality. Cardinality, in this example, would be the total number of possible labels you could get by combining those dimensions from the shirts in your inventory. Figure 1-1 visualizes this example by looking at two dimensions: color and size.
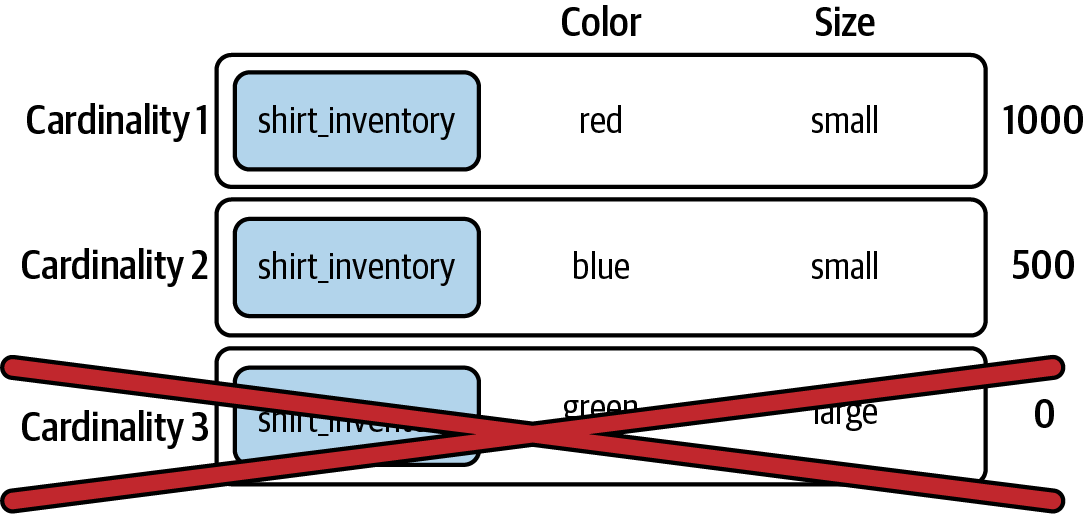
Figure 1-1. Shirt inventory with two cardinalities
There are only two cardinalities in Figure 1-1, even though there are three possibilities. That’s because the last combination, while theoretically possible, is not in the inventory and therefore is not emitted.
Because events have dimensions, any data derived from events has cardinality. This includes derivatives such as logs, traces, and metrics.
Now let’s look at what happens if we increase the number of dimensions, and therefore possible cardinalities, by adding the type of shirt. Figure 1-2 shows how increasing the number of dimensions also increases the cardinality of the metrics.
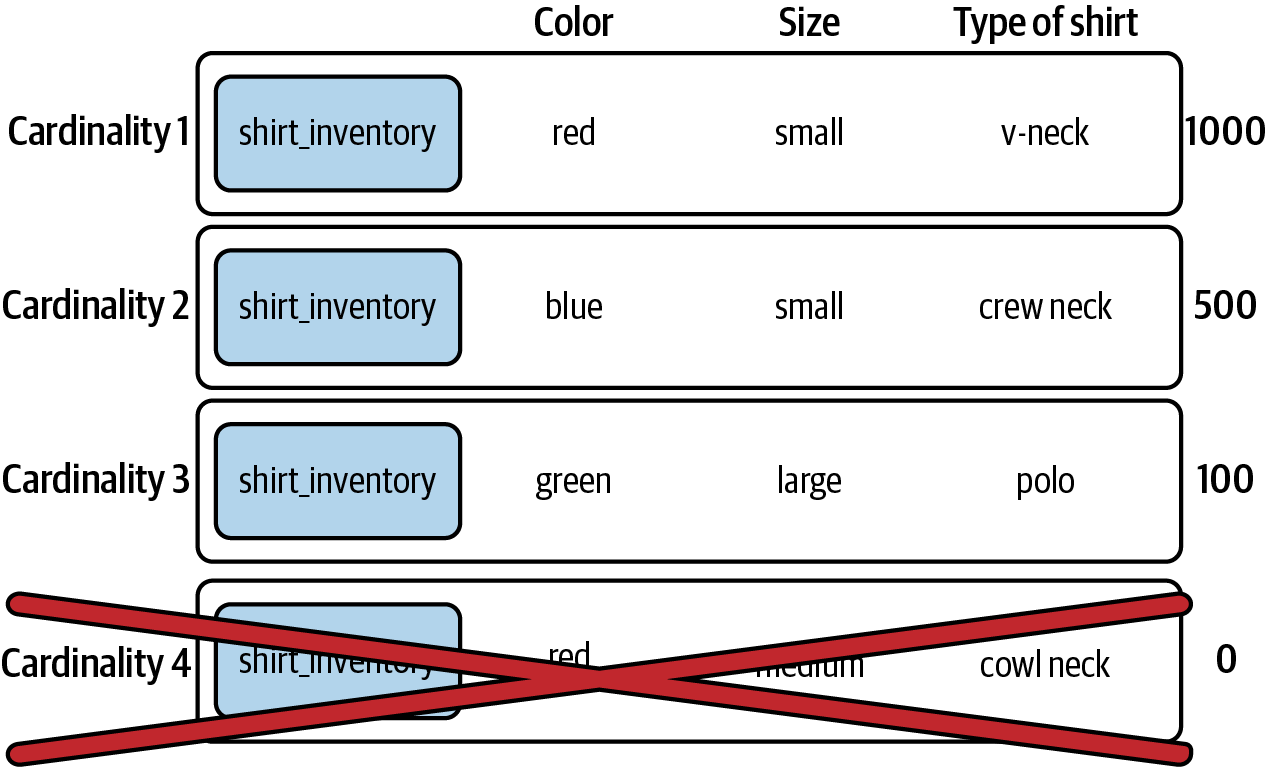
Figure 1-2. Shirt inventory with three cardinalities
What does this look like in practice? For example, assume you wanted to add a new dimension in an HTTP_REQUEST_COUNT metric. You want to know which specific HTTP status code created an HTTP 5xx error. This would allow you to better debug the error code path server side. To further debug issues introduced by certain client versions, you need to add something like a CLIENT_GIT_REVISION dimension in the above HTTP metric. Let’s calculate how much it will theoretically add to the cardinality:
50 services/applications (including daemon agents/proxies/balancers/etc.)
× 20 average pods per service
× 20 average HTTP endpoints or gRPC methods per service
× 5 common status codes
× 30 histogram buckets
= 3 million unique time series
However, precisely because it is multiplicative, removing one dimension will decrease the cardinality multiplicatively as well. Assume you do not need to determine exactly which pod is causing HTTP 5xx errors because you can track down the offending error code path using CLIENT_GIT_REVISION itself:
50 services/applications (including daemon agents/proxies/balancers/etc.)
× 20 average pods per service
× 20 average HTTP endpoints or gRPC methods per service
× 5 common status codes
× 30 histogram buckets
= 150,000 unique time series
As Bastos and Araújo note, “Cardinality is multiplicative—each additional dimension will increase the number of produced time series by repeating the existing dimensions for each value of the new one.”4 Choosing the right dimensions is key to keeping cardinality in check.
Cloud Native Systems Are Flexible and Ephemeral
“Containers are inherently ephemeral,” Lydia Parziale et al. write in Getting Started with z/OS Container Extensions and Docker. “They are routinely destroyed and rebuilt from a previously pushed application image. Keep in mind that after a container is removed, all container data is gone. With containers, you must take specific actions to deal with the ephemeral behavior.”5
The other effect of using containers and cloud native architecture is that distributed systems are more flexible and more ephemeral than monolithic systems. This is because containers are faster to spin up and close down. Containers make observing an ephemeral system difficult, since they come and go quickly: a container that spun up a few seconds ago could be terminated before we get a chance to observe it.
According to a survey by Sysdig, 95% of containers live less than a week.6 The largest cohort—27%—are containers that churn roughly every 5 to 10 minutes. Eleven percent of containers churn in less than 10 seconds.
The flexibility of cloud native architectures allows for increased scalability and performance. You can easily take a pod away or increase it a hundredfold. You can even add labels to increase the context of the metrics. This has fundamentally increased the observability of data produced.
Another key change from traditional workloads is that data retention in cloud native environments is different. Retaining terabytes and petabytes of data is easier in cloud native workloads, as there is virtually unlimited storage. However, in cloud native architectures, especially in containers, workloads are inherently stateless and flexible. Retaining data is paramount to prevent loss of information when termination happens and new containers are spun up.
This is why data in cloud native architectures is constantly growing in scale and cardinality. The ephemeral nature of cloud native systems gives it the flexibility to scale up and down faster than ever before.
The Goldilocks Zone of Cloud Native Observability
Another factor in cloud native observability is that business outcomes of providing a reliable and scalable service are sometimes decreasing while observability data volumes are increasingly disproportionate to the value of the additional data collected.
Increasingly, we hear that cloud native observability systems cost more than traditional observability systems to maintain and run while counterintuitively delivering reduced business outcomes. But all is not lost! We believe you can intelligently shape your data using policies without having to micromanage your data to best utilize costly telemetry storage. This state is a good balance between cost and still keeping enough data to deliver better business outcomes. We call this theory the Goldilocks zone of cloud native observability. “Goldilocks zone” is used in astronomy to refer to the theoretically habitable area around a star where it is not too hot or too cold for liquid water to exist on surrounding planets.7
But why is this cost increasing? What are the factors that are driving this cost? How do we control this cost while increasing business outcomes? And more importantly, how do we keep our fellow observability practitioners from burning out?
We postulate a truism (or a paradox) in cloud native systems that cloud native adoption itself can feel self-defeating:
To help build better business outcomes in your cloud journey, your cloud native adoption needs to expand. As you adopt cloud native further, you need to build more microservices. And as you build more microservices, you accumulate complexity, which conversely causes lesser business outcomes.
The complexity we are talking about here is the number of systems you have to support and the additional increase in failure modes that can lead to the growth of data each system produces. This could mean business data but also observability data.
Cloud Native Environments Emit Exponentially More Data Than Traditional Environments
Cloud native systems growing in scale to tackle complexity means the observability data they produce also grows. Based on a study by ESG, this growth is exponential in nature, far outpacing the growth of the business and its infrastructure (as shown in Figure 1-3). This rapid rate of growth causes problems: storing all of the data about everything (logs, metrics, and traces) would be prohibitively expensive in terms of cost and performance. ESG also found that 69% of the IT, DevOps, and application development professional respondents saw the growth rate of observability data as “alarming.”8
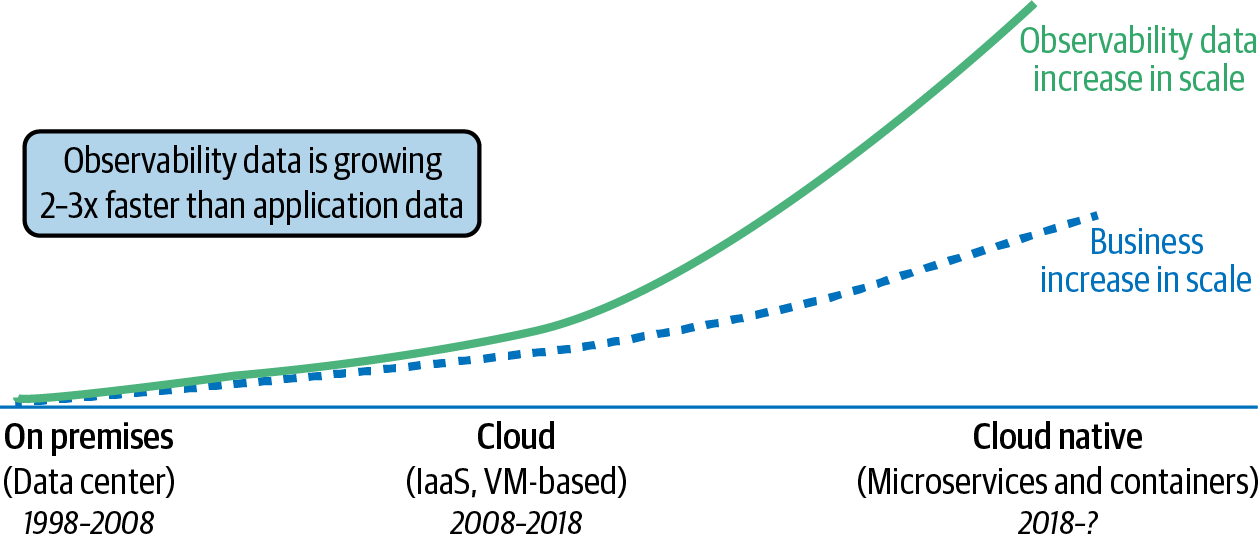
Figure 1-3. Cloud native’s impact on observability data growth (adapted from an image by Chronosphere)
Why so much growth? The reasons include faster deployments, a shift to microservices architectures, the ephemerality of containers, and even the cardinality of the observability data itself to model the moving picture of this complex environment!
Delivering Reduced Business Outcomes
This moves us to the fact that a higher volume of observability data in cloud native is correlated with reduced business outcomes. Why is that?
In traditional observability, the main challenge for practitioners was increasing observability data due to higher transaction volume or system complexity to meet business needs. There was no standard way of outputting observability data from traditional systems; each vendor had their way of doing this (discussed in depth in Chapter 2).
What little observability data we had was directly related to the systems we wanted to observe. Since there was less interdependence, each data point was independently valuable and presented a slice of critical observation tied directly to obvious business outcomes.
With cloud native, we now have an abundance of observability data. Yet, when much of this data is too fine-grained and ambiguous without further context, its significance decreases and creates more noise. Instead, we need aggregate data that would be contextually useful and directly support better business outcomes.
In short, we’re seeing reduced business outcomes due to too much observability data of low quality and irrelevant to the big picture. Increasingly we are seeing that practitioners find it difficult to deliver the same level of business outcomes using the same level of investments. As Michael Hausenblas explains, “With observability, it’s just like that: you need to invest to gain something.”9
Observability Practitioners Lose Focus
Practitioner teams tend to get bogged down in the weeds of instrumentation and lose sight of the fact that more telemetry data does not always equal better observability. As cloud native systems become more complex, so does the instrumentation needed to get telemetry data from these systems, shifting the focus from conducting data analysis to telemetry management. All of this creates undue stress and tends to cause burnout for practitioners.
This does not change the need for observability data in the cloud native world. It simply means it is now harder to extract positive business value and outcomes from this data. To refocus, we need to ask the right questions, such as:
-
Do you instrument critical parts of your code sufficiently?
-
Which data do you collect?
-
What is your storage and retention strategy?
-
How many ways can you slice and dice your data?
-
Are there dashboards to visualize this data?
Worse yet, practitioner teams may even instrument the wrong data and present it to the dashboard and the alerting system.
The loss of focus is even more apparent if we improve the questions:
-
Do you get alerted appropriately when there is an issue?
-
Does the alert give you a good place to start your investigation?
-
Are the alerts too noisy?
-
How do you visualize the data you collect?
-
Do you even use it at all during incidents?
-
Can you use the dimensions of the metrics to help triage and scope the impact of the issue?
-
Are the alerts useful and helpful before and after incidents?
We recommend only instrumenting the telemetry that matters to your organization, which allows you to focus on outcomes. Focusing on business outcomes helps practitioners be more connected to the overall goal of the business, reducing burnout. To achieve this focus, follow the three phases of observability (which we will discuss in more detail in “The Three Phases of Observability: An Outcome-Focused Approach”) to refine your processes and tools iteratively, and be vigilant in measuring your mean time to remediate (MTTR) and mean time to detect (MTTD). Additionally, implementing internal service-level objectives (SLOs) and customer service-level agreements (SLAs) centers observability practices around crucial business outcomes, fostering a more outcome-oriented approach.
Increasing Cost of Observability Data
With both cloud native and traditional environments, as we increase the amount of data we increase the cost (Figure 1-4).
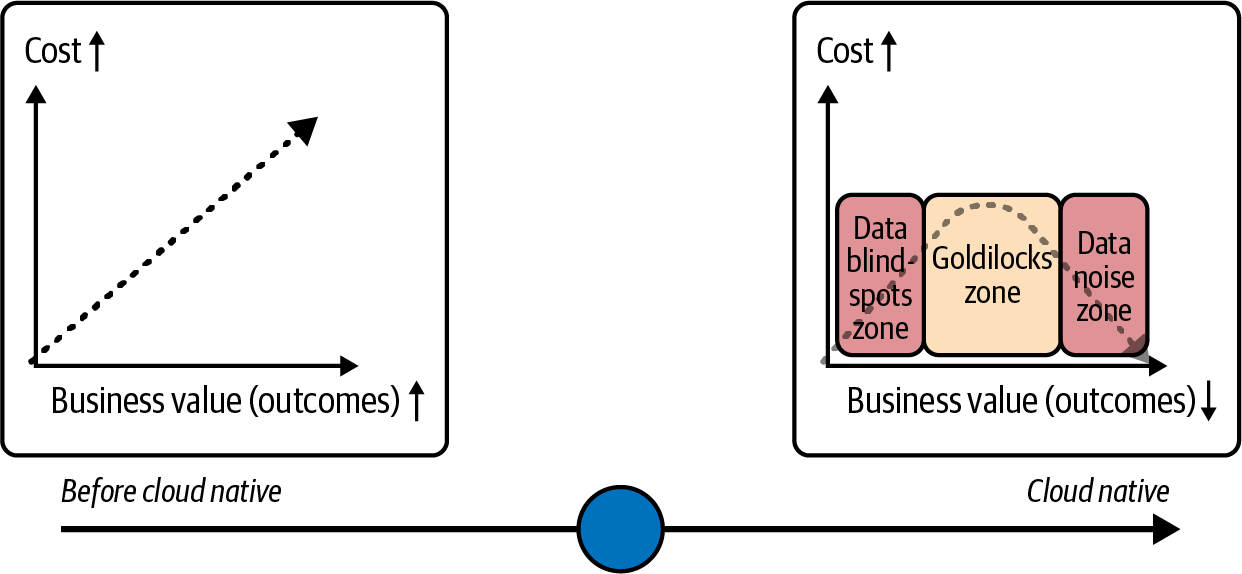
Figure 1-4. Value versus cost of observability tool before and after cloud native
The Goldilocks zone is where cloud native observability data is worth the cost. However, the business value decreases as you decrease or increase the observability data. Finding the Goldilocks zone means you gather the correct observability data and store the useful and effective slices of the synthesized observability data.
The Cloud Native Impact
According to a recent survey conducted by Gartner, cloud native adoption is growing.10 By 2028, 95% of all global organizations will be running containers in production, an increase from fewer than 50% in 2023. The survey also indicates that 25% of all enterprise applications will be running in containers, from fewer than 15% in 2023.
What this shows us is that cloud native adoption has already crossed the chasm and that there is no going back.
Slower Troubleshooting
A separate survey found that engineers working on cloud native environments spend an average of 10 hours of their time per week troubleshooting,11 54% of participants feel stressed out, 45% don’t have time to innovate, and 29% want to quit due to burnout. Burnout bites twice because software engineers are not interchangeable and onboarding new engineers takes a while.
When people who have burned out leave, they take valuable institutional knowledge with them. The loss of institutional knowledge further deteriorates business outcomes.
Eighty-seven percent of participants agree that cloud native architectures make observability more challenging, with the same percentage agreeing that observability is essential to cloud native success.
Tools Become Unreliable
Tools become unreliable when they are unable to scale with the volume and complexity of data generated by cloud native systems or when they fail to adapt to the ephemeral nature of cloud native architectures.
Traditional observability systems were generally simpler because there were fewer ways a system could fail and the volumes of data were generally smaller. With cloud native, there are more ways for systems to fail, and there is also a growth in observability data due to distributed sets of interrelated data.
In a pre–cloud native world, tools were reliable because the architectures were mostly static and homogenous, allowing you to understand the failure modes. However, with the shift to cloud native architectures, these tools are no longer reliable. To increase the reliability of your observability system, you need to store the correct observability data.
The question is, how do you identify which observability data is worth storing?
Use Context to Troubleshoot Faster
To answer this question, you need to understand the major use cases for observability data in your organization.
For example, look at high-impact observability data like remote procedure call traffic, request/response rates, and latency, ideally as they enter your system. If you have, for example, 100 microservices, how many dimensions should you add to your metrics? Should you capture all data as it comes in for each metric? Performing this analysis, at least on the present and shared dimensions across these metrics, can be a difficult but worthwhile exercise.
What does that exercise give your observability data? In a word, context. You are no longer getting and keeping all observability data but only observability data useful in the context of your cloud native architecture and applications.
The Three Phases of Observability: An Outcome-Focused Approach
A focus on context also becomes important when we keep its original and primary purpose in mind: to remediate or prevent issues in the system.
As builders of that system, we want to measure what we know best. We tend to ask what metrics we should produce to understand if something is wrong with the system. To remediate it, working backward from customer outcomes allows us to focus on where the heart of observability should be: what is the best experience for the end user?
In most cases, a customer wants to be able to do what they came to do: for example, buy your products. You can work backward from there. You don’t want your customers to be unable to buy products, so if the payment processor goes down or becomes degraded, you need to know as soon as possible to remediate the issue.
Once you find the customer outcomes you are looking for, then the primary signals of observability (metrics, logs, and traces…alongside other signals like events) can play a role. If your customers need error-free payment processing, you can craft a way to measure and troubleshoot that. When deciding on signals, we endorse starting from the outcomes you want.
We call our approach the three phases of observability (Figure 1-5).
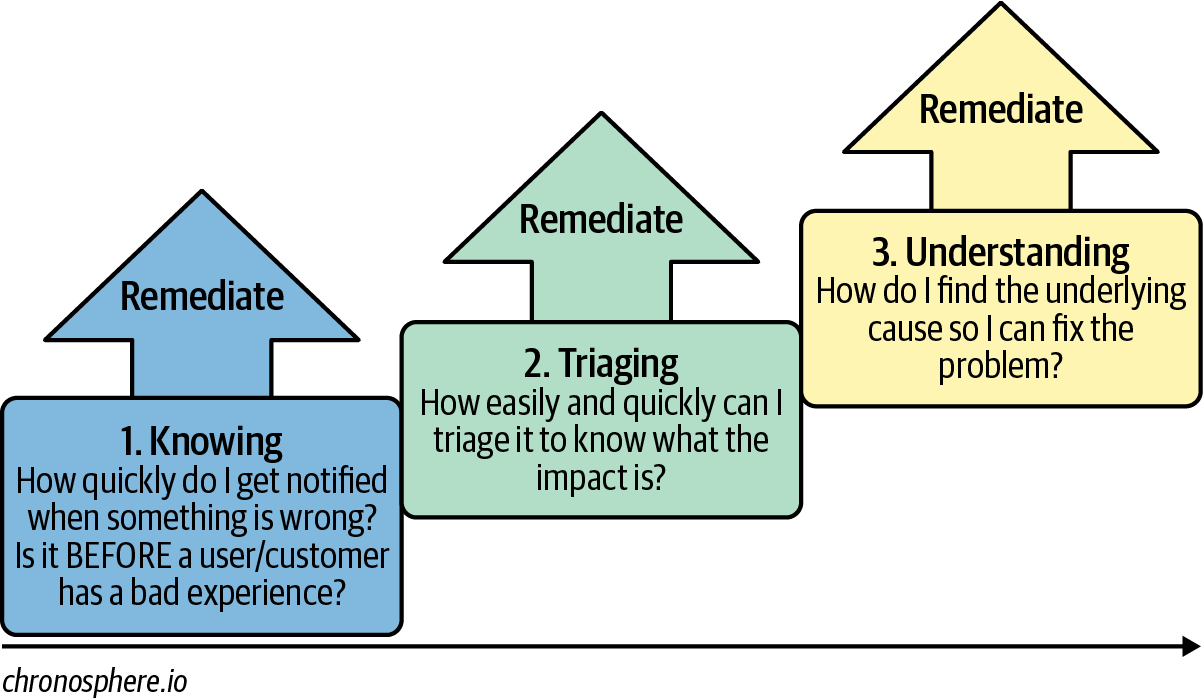
Figure 1-5. The three phases of observability (adapted from an image in Rachel Dines, “Explain It Like I’m 5: The Three Phases of Observability,” Chronosphere, August 10, 2021, https://oreil.ly/f7dnZ)
As part of a remediation process, the three phases can be described in the following terms:
-
Knowing quickly within the team if something is wrong
-
Triaging the issue to understand the impact: identifying the urgency of the issues and deciding which ones to prioritize
-
Understanding and fixing the underlying problem after performing a root cause analysis
Some systems are easier to observe than others. The key is being able to observe the system in question at the granularity that lets you make a decision quickly and decisively.
Let’s say you work for an ecommerce platform. It’s the annual Black Friday sale, and millions of people are logged in simultaneously. Here’s how the three phases of observability might play out for you:
- Phase 1: Knowing
-
Suddenly, multiple alerts fire off to notify you of failures. You now know that requests are failing.
- Phase 2: Triaging
-
Next, you can triage the alerts to learn which failures are most urgent. You identify which teams you need to coordinate. Then you learn if there is any customer impact. You scale up the infrastructure serving those requests and remediate the issue.
- Phase 3: Understanding
-
Later on, you and your team perform a postmortem investigation of the issue. You learn that one of the components in the payments processor system is scanning many unrelated users and causing CPU cycles to increase tenfold—far more than necessary.
You determine using the payments processor metrics dashboard that this increase was the root cause of the incident. The payments processor requires more CPU than you currently allocate, which bottlenecks the entire cart system. You and the team fix the component permanently by allocating more CPU and scaling the payments processor horizontally.
Remediating at Any Phase, with Any Signal
Although we posit three phases, at any phase your goal in practice is always to remediate problems quickly. If a single alert is firing off and you can take steps to remediate the issue as soon as you know about it (Phase 1), you should do so. You don’t have to stop to triage or do a root cause analysis every time if these are unnecessary.
To illustrate this point, let’s say a scheduled deployment immediately breaks your production environment. There is no need to triage or do root cause analysis here since you already know that the deployment caused the breakage. Simply rolling back the deployment when errors become visible remediates the issue.
You can also resolve an issue using observability, even without using all of the traditional observability signals (metrics, logs, and traces). In the payment processing example in the previous section, we show one situation where just looking at the metrics dashboard could be used to determine which systems in what environments and code paths were causing the issue and provide enough information to allow for a quick and efficient fix.
Conclusion
In conclusion, the shift to cloud native systems created an issue of ballooning observability data, resulting in a loss of focus on customer outcomes, practitioner burnout, and an increase in the cost of observability systems.
Finding the Goldilocks zone in your observability strategy will allow you to manage the trade-off between cost and better business outcomes.
The growth of observability data in cloud native systems is caused by cardinality, the flexibility of cloud native architecture, and greater interdependence between cloud native services.
Finally, we recommend that you follow the three phases of observability to remediate issues and to ensure that you keep only useful observability data you need, using context as your guide.
1 See CNCF Cloud Native Definition v1.0 for more information.
2 See the CNCF’s observability definition for more information.
3 Rob Skillington, “What Is High Cardinality,” Chronosphere, February 24, 2022, https://oreil.ly/-wttH.
4 Joel Bastos and Pedro Araújo, “Cardinality,” in Hands-On Infrastructure Monitoring with Prometheus (Packt, 2019), https://oreil.ly/vmk4Z.
5 Lydia Parziale et al., Chapter 10, in Getting Started with z/OS Container Extensions and Docker (Redbooks, 2021), https://oreil.ly/e21Wc.
6 Eric Carter, 2018 Docker Usage Report (Sysdig, 2018), https://oreil.ly/ftZum.
7 National Aeronautics and Space Administration, “What Is the Habitable Zone or ‘Goldilocks Zone’?” Exoplanet Exploration: Planets Beyond Our Solar System, https://oreil.ly/hB0kG.
8 Rachel Dines, “New ESG Study Uncovers Top Observability Concerns in 2022,” Chronosphere, February 22, 2022, https://oreil.ly/gKLm8.
9 Michael Hausenblas, “Return on Investment Driven Observability,” March 24, 2023, https://oreil.ly/n2Aax.
10 Gartner, “Gartner Says Cloud Will Be the Centerpiece of New Digital Experiences,” November 10, 2021, https://oreil.ly/Ney9y.
11 Chronosphere, “Cloud Native Without Observability Is Like a Flightless Bird,” https://oreil.ly/UmYrM.
Get Cloud Native Observability now with the O’Reilly learning platform.
O’Reilly members experience books, live events, courses curated by job role, and more from O’Reilly and nearly 200 top publishers.

