Chapter 1. Getting Started with AI in the Enterprise: Your Data
Power BI is Microsoft’s flagship business analytics service that provides interactive visualizations and business intelligence capabilities. Power BI is a business-focused technology with an easy-to-use interface that makes it easy to underestimate its power. In this chapter, let’s explore the essential ingredient of getting the most out of Power BI: getting your data ready.
What problems are specific to the self-service data preparation domain? As anyone who has tried to merge data in Excel knows, cleaning data is a frustrating and lengthy process. It can be exacerbated by mistakes in formulas and human error, as well as having access only to a sample dataset. Moreover, the business analysts may not have straightforward access to the data in the first place. Business teams may have to procure data from across business silos, adding delays to an already frustrating process. Sometimes, they may even bend existing business processes or push boundaries to get the data they need. The frustration they feel gets in the way of exercising creativity when it comes to analyzing the data. Many organizations have a hidden industry of Excel spreadsheets that comprise the “little data” that runs the business. Often, IT cannot get any visibility into these data “puddles,” so it cannot manage them or exercise its role as guardian of the data.
According to David Allen’s Get Things Done methodology, there is clear strategic value in having bandwidth to be creative. To be creative, people need to be free of distractions and incomplete tasks. When people deal with data, they can gain insights by being playful, but to do so, they need to be free to focus their time and attention on the analysis. Having to spend a lot of time on cleaning up a data mess often interferes with the creative process. Instead of gaining insights from a lake of big data, they may have only a series of murky data puddles to work with. This situation leads to disappointment for the business leaders who expect astute observations and deep understanding from the business’s data.
Overview of Power BI Data Ingestion Methods
Power BI provides several ways to bring data into your reports and dashboards. In this chapter, we will focus on dataflows and datasets. The method you choose depends largely on your use case’s specific requirements and constraints and, in particular, on the nature of the data and the business needs. Let’s begin by discussing one important differentiator: real-time data versus batch-processed data.
Real-time data is ingested and displayed as soon as it is acquired. The timeliness of the data is critical. Latency between data generation and data availability is minimal, often milliseconds to a few seconds. Real-time data allows decision makers or systems to act immediately based on current information, so it is critical in scenarios where immediate decisions or responses are needed. Real-time data is found in many areas, such as the Internet of Things (IoT), gaming, healthcare, and finance. The capability to promptly process and act on real-time data offers many benefits. It can give the business a competitive advantage, improve safety, enhance user experience, and even save lives in emergencies.
Batch processing involves collecting and processing large volumes of data in groups, or batches, rather than processing each piece of data as it arrives at the system. Batch processing is typically used when data doesn’t need to be available in real time. The data can be stored temporarily and processed later, often during a period of lower system demand. For example, batch processing is appropriate when the data source has only intermittent network access and the data can be accessed only when the data source is available. Also, it can be more expensive to process data in real time, so when immediate access to the data is unnecessary, a business often determines that batch processing is sufficient.
Now that we’ve gotten an overview of the two basic data velocity options, let’s take a look at the different methods of data ingestion in Power BI.
The import data method involves importing data from a source into Power BI. Once the data is imported, it is stored in a highly compressed, in-memory format within Power BI. With the import data method, report interaction is very fast and responsive to user clicks and ticks on the Power BI canvas.
The direct query method sets up a direct connection to the data source. When a user interacts with a report, queries are sent to the source system to retrieve and display the data on the Power BI dashboard. No data is copied to or stored inside Power BI.
The live connection method is similar to direct query, but it is explicitly intended for making connections to Analysis Services models.
Power BI dataflows are a Power BI service feature based in the Microsoft Azure cloud. Dataflows allow you to connect to, transform, and load data into Power BI. The transformed data can be used in both Import and DirectQuery modes. The process runs in the cloud independently from any Power BI reports and can feed data into different reports.
The composite model approach allows Power BI developers to create reports using either the direct query or import data methods. For example, real-time data could be set alongside reference data that does not need to be real-time, such as geographic data.
Using the dataset method, you can create reports based on existing Power BI datasets. A dataset can be reused many times for consistency across multiple reports.
This chapter will explore the potential of dataflows to resolve the previously mentioned data preparation issues.
Workflows in Power BI That Use AI
A dataflow is a collection of tables created and managed in workspaces in the Power BI service. A table is a set of columns used to store data, much like a table within a database. It is possible to add and edit tables in the dataflow. The workflow also permits the management and scheduling of data refreshes, which are set up directly from the workspace.
How Are Dataflows Created?
To create a dataflow, first go to https://www.powerbi.com to launch the Power BI service in a browser.
Next, create a workspace from the navigation pane on the left, as shown in Figure 1-1.
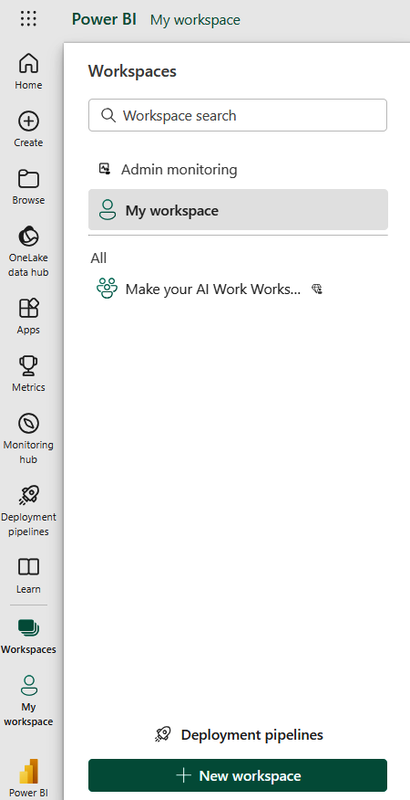
Figure 1-1. Creating a workspace
The workspace stores the dataflow. Creating a dataflow is straightforward, and here are a few ways to build one.
Creating a dataflow by importing a dataset
In the workspace, there is a drop-down list to create new resources, such as paginated reports or dashboards. Under New is an option to create a new dataflow, as shown in Figure 1-2.
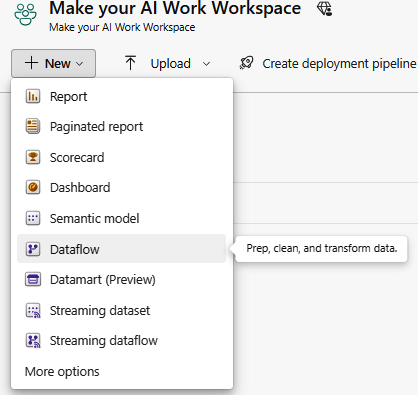
Figure 1-2. Creating a dataflow
Then, you are presented with the four options shown in Figure 1-3.
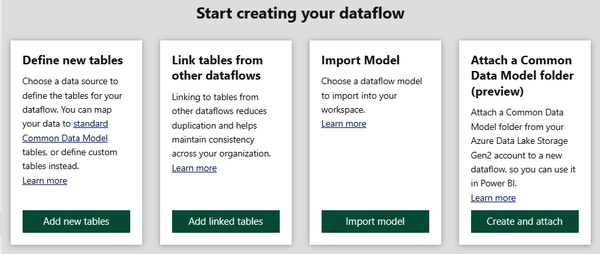
Figure 1-3. Options for creating a dataflow
For this example, choose the first option, “Define new tables.” Then select “Add new tables” (Figure 1-4).
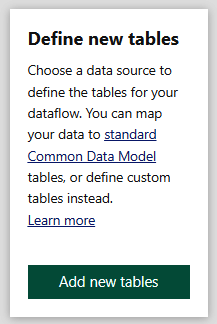
Figure 1-4. Using Define new tables
Next, you’ll see a choice of many options for data ingestion. Figure 1-5 shows an example of the range of data sources for Power BI dataflows.

Figure 1-5. Example of possible data sources for a dataflow
For this example, ingest a CSV file that contains World Bank life expectancy data. To do this, select Text/CSV.
Then, in the text box labeled File path or URL, enter the following filepath:
Next, you’ll see options for selecting and accessing the file, as illustrated in Figure 1-6.
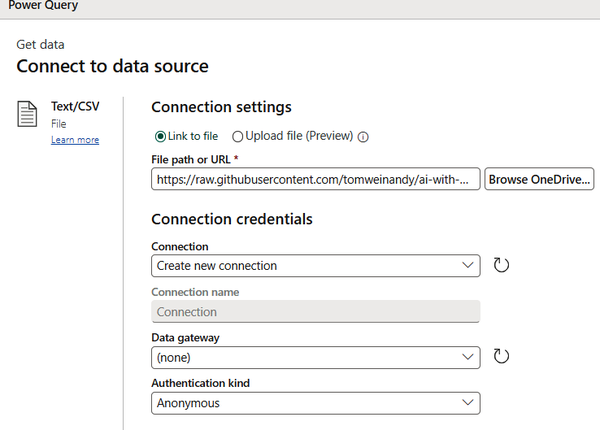
Figure 1-6. Entering connection settings for a text/CSV file
The dataflow will now display the data, as shown in Figure 1-7. To proceed, click “Transform data,” which is located at the bottom righthand side of the Preview file data screen.
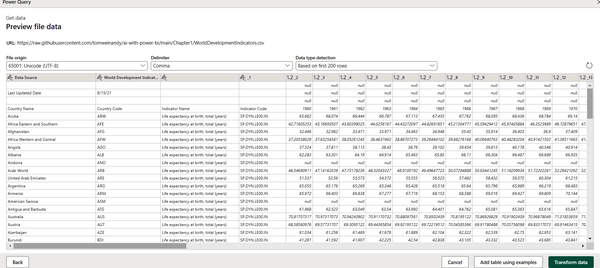
Figure 1-7. Viewing the data in the Preview file data screen
After choosing to transform the data, you need to do a few things:
-
Remove the first rows of data. Select “Reduce rows,” then “Remove rows,” and finally “Remove top rows” (Figure 1-8).
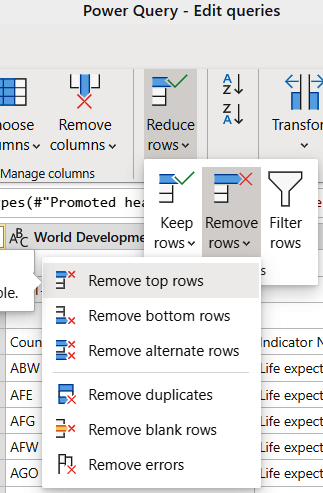
Figure 1-8. Removing the top rows from a dataflow
Type
3into the text box and click OK (Figure 1-9).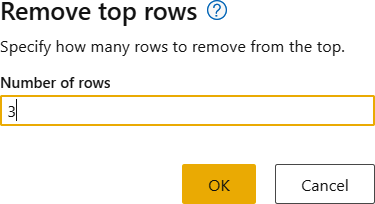
Figure 1-9. Specifying the number of rows to remove
-
Set the first row of data as the column headers. In the Home tab, select Transform and then “Use first rows as headers.” Figure 1-10 shows how these options appear in the Power Query Online tab.

Figure 1-10. Setting the first row as column headers
-
Now remove unnecessary columns. Right-click on the Indicator Name column and select “Remove columns.” Then right-click on the Indicator Code column and select “Remove columns.” Figure 1-11 shows the “Remove columns” command in its drop-down list.
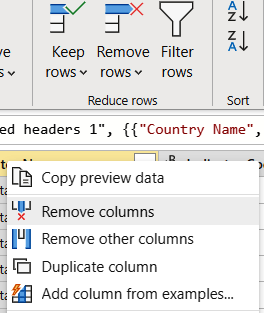
Figure 1-11. Removing unwanted columns
-
Shape the data. You want it in a long, narrow table format with many rows and few columns. In contrast, a wide table has many columns and fewer rows. Power BI will work better with data in a narrow format since the metric of interest, average life expectancy, will be contained in one column rather than being spread out over numerous columns.
To unpivot the columns, select all the columns from 1960 onward. In the Transform tab, select “Unpivot columns” and then, from the drop-down list, “Unpivot columns.” Figure 1-12 shows these options in the Power Query Online tab.
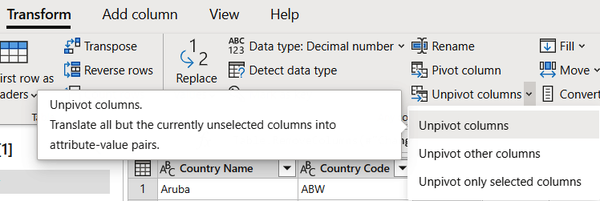
Figure 1-12. Unpivoting the columns
-
Make the columns easier to understand by renaming them. Rename the Attribute column to Year and rename the Value column to Average Life Expectancy.
-
Finally, amend the Year column so that it has a whole number datatype. Select the column and then open the Transform tab. Select “Data type: Text” and then “Whole number” from the drop-down list (Figure 1-13).
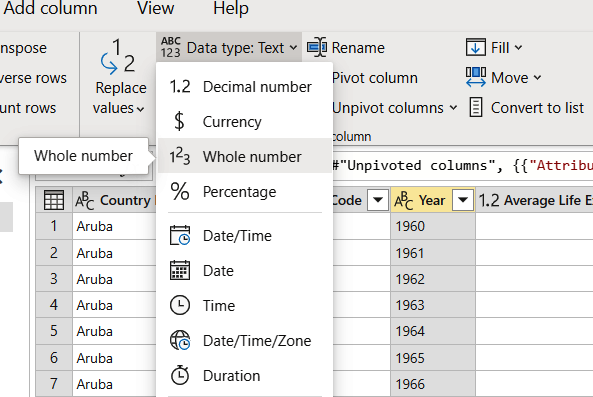
Figure 1-13. Changing the datatype of the year data
Once these steps are complete, the Power BI dataflow will appear as shown in Figure 1-14. Click “Save & close.” We will use this dataflow in a later exercise.
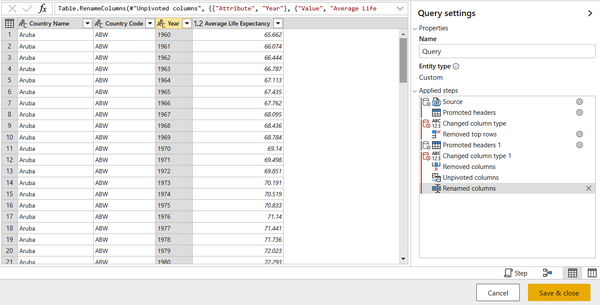
Figure 1-14. Completed dataflow
Creating a dataflow by importing/exporting a dataflow
You can create dataflows using the import/export option. This method is convenient since it lets you import a dataflow from a file. This process is helpful if you want to save a dataflow copy offline rather than online. It is also helpful if you need to move a dataflow from one workspace to another.
To export a dataflow, select the dataflow and then choose More (the ellipsis) to expand the options to export a dataflow. Next, select export.json. The dataflow will begin to download in CDM format.
To import a dataflow, select the import box and upload the file. Power BI then creates the dataflow. The dataflow can serves as the basis for additional transformations or remain as is.
Creating dataflows by defining new tables
You can also create a dataflow by defining a new table. The Define new tables option, shown in Figure 1-15, is straightforward to use. It asks you to connect to a new data source. Once the data source is connected, you will be prompted to provide details such as the connection settings and the account details.
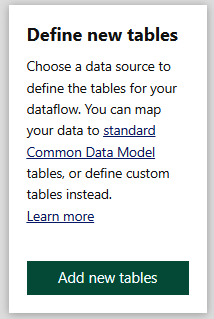
Figure 1-15. Using “Define new tables”
Creating dataflows with linked tables
The Link tables option provides the ability to have a read-only reference to an existing table that is defined in another dataflow.
The linked table approach is helpful if there is a requirement to reuse a table across multiple dataflows. There are plenty of such use cases in analytics, such as when a date table or a static lookup table is reused. Data warehouses often have custom date tables that match the business need, such as varying custom date tables, and a static lookup table might contain country names and associated ISO codes, which do not change much over time. If the network is an issue, it is also helpful to use linked tables to act as a cache to prevent unnecessary refreshes. In turn, this reduces the pressure on the original data source.
In these situations, you create the table once, and it is then accessible to other dataflows as a reference. To promote reuse and testing, you can use the Link tables from other dataflows option (Figure 1-16).
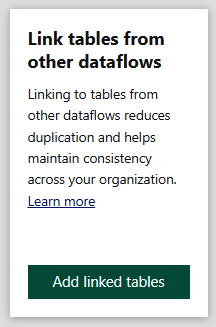
Figure 1-16. Using “Link tables from other dataflows”
Creating dataflows with computed tables
You can take the idea of linked tables a step further by setting up a dataflow using a computed table while referencing a linked table. The output is a new table that constitutes part of the dataflow.
It is feasible to convert a linked table into a computed table; you can either create a new query from a merge operation, create a reference table, or reproduce it. The new transformation query will not execute using the newly imported data. Instead, the transformation uses the data that already resides in the dataflow storage.
Importing a dataflow model
Using Import Model, you can choose a dataflow model to import into your workspace (Figure 1-17).
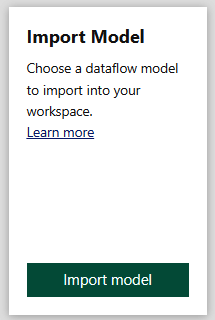
Figure 1-17. Import Model
If a dataflow is exported to JSON format, for example, you can import this file into another workspace. To import a dataflow from a file, click “Import model” and navigate to the JSON file. Then the Power BI service will ingest the file to create the new dataflow.
Creating dataflows using a CDM folder
Business teams can make the most of the Common Data Model (CDM) format with dataflows that access tables created by another application in the CDM format. You can access the option when you create a new dataflow, as shown in Figure 1-18.
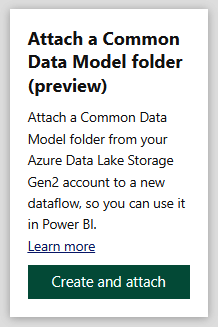
Figure 1-18. Attaching a Common Data Model folder (preview)
To access these tables, you will need to provide the complete path to the CDM format file stored in Azure Data Lake Store (ADLS) Gen2 and set up the correct permissions. The URL must be a direct path to the JSON file and use the ADLS Gen2 endpoint; note that Azure Blob storage (blob.core) is not supported.
The path is a link in HTTP format and will look similar to the example in the Common Data Model folder path box in Figure 1-19. The path is automatically generated when the developer configures the workspace dataflow storage, and it ends with model.json.
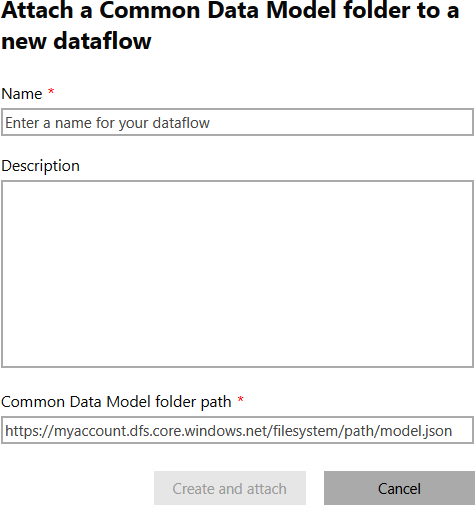
Figure 1-19. Specifying the Common Data Model folder path
In addition, the ADLS Gen2 account must have the appropriate permissions set up for Power BI to access the file. If the developer cannot access the ADLS Gen2 account, they cannot create the dataflow.
Most developers are now using the new workspace experience. For those who are not, the ability to create dataflows from CDM folders, which is available only in the new workspace experience, is an enticement to transition to it.
Things to Note Before Creating Workflows
Dataflows are not available in my-workspace in the Power BI service.
You can create dataflows only in a Premium workspace with either a Pro license or a Premium Per User (PPU) license. Computed tables are also available only in Premium.
You’ll decide which data to use for the table once you’re connected. Once you choose your data and a source, Power BI will reconnect to the data source to retain the refreshed data in the dataflow.
During the setup, you will also be asked how often you require data refreshes. This decision will partly be driven by your license, as it will determine the number of data refreshes available to your organization. Before starting to create the workflow, you should decide on the timing of the data refreshes. If you are not sure of the best times to schedule the data refreshes, it is a good idea to choose a time that will ensure the data will be ready for the business teams by the start of the business day.
The Dataflow Editor transforms data into the required format for use in the dataflow, as per the example given in the section “How Are Dataflows Created?”.
Streaming Dataflows and Automatic Aggregations
Power BI Premium now features streaming dataflows and automatic aggregation. These features will speed up report creation and consumption, and they will support projects with large datasets. For instance, streaming dataflows enable report creators to incorporate real-time data to make their reports more user-friendly and faster.
As the amount of data from new places grows every day, companies will need help to make it actionable. These features will play a critical role in allowing businesses to use data more efficiently to inform sound business decisions.
Getting Your Data Ready First
Artificial intelligence needs data; without data, there is no AI. Power BI Desktop uses dataflows to provide data to create datasets, reports, dashboards, and apps based on the data obtained from Power BI dataflows.
The ultimate goal is to derive insights into business activities, and the next step toward this goal is to get the data ready for Power BI dataflows.
Getting Data Ready for Dataflows
Data preparation is generally the most complicated, costly, and time-consuming task in analytics projects. Datasets may include shredded, missing, and incomplete data. Further, the data structures may be confusing and poorly documented. Power BI dataflows help organizations address all these challenges. They support the ingestion, transformation, cleaning, and integration of large volumes of data. Further, Power BI dataflows can structure data into a standardized form to facilitate reporting.
Dataflows help simplify and set up a self-service Power BI extract, transform, and load (ETL) pipeline. A dataflow follows the same pattern as a simple ETL pipeline that can connect to source data, transform the data by applying business rules, and prepare the data to be available to visualize. Power BI then connects to a data warehouse in business intelligence environments and visualizes the data from that point on.
Where Should the Data Be Cleaned and Prepared?
In many technical architectures, there are several options for data cleaning and preparation because a number of data sources are available—everything from Excel spreadsheets to big data systems to proprietary solutions such as Google Analytics. Consequently, you can choose from a myriad of data-processing pipelines to process data from different sources. It is worth looking at some of these options before diving into the question of why dataflows are essential for cleaning data for Power BI.
Option 1: Clean the data and aggregate it in the source system
The tool used for this option depends on the source system that stores the data. For example, if the technical architecture rests on a Microsoft SQL server, the solution could extract the data using stored procedures or views.
With this option, the overall architecture moves less data from the source system to Power BI. That is helpful if the business does not need low-level details and there is a desire to anonymize the data by aggregating it.
One disadvantage of this approach is that the raw source data is not available to Power BI, so the business needs to go back to the source system each time it needs the data. The data may not even still exist in the source system if it has undergone archiving or purging, so it is best for Power BI to import the data. Another issue is that data cleansing can strain the capacity of the source system, potentially slowing the system and affecting the business teams that use it. Further, the source system may not have fast performance due to business operations and thus not be able to provide fast reporting to business users. Power BI is an excellent option to circumvent these issues because it relieves the pressure on underlying source systems, pushing the workload to the cloud while supporting the business users who need their Power BI reports.
Option 2: Clean data from a source to a secondary store
Business users often don’t understand why search engines such as Google or Bing can produce millions of results in seconds but IT departments take much longer to produce data. Some businesses work around IT, going off and purchasing their own datasets for their own analyses. This can lead to frustration when business staff find the technical aspects confusing. Data-warehousing experts create ETL packages that handle data transformation tasks on a schedule to prevent one-off data loads.
Repeatedly accessing operational systems can affect their performance. Pushing data into a secondary source solves this problem, as the original system is no longer affected by additional demand from business users.
However, ETL activity involves coordinating many different pieces of logic that need to interact in sequence. Many internal operational systems are simply not designed to work at the speed of the business, and they are not designed to work together. The reality is that people often export data to CSV or Excel and then mash it together. This means that businesses are running on operational data sources that can differ from the original data sources and each other in terms of structure, content, and freshness.
Microsoft is shifting its focus to services and devices rather than local, desktop-based, on-premise applications. Over time, this means that the proliferation of Excel throughout organizations may have to be addressed. Companies need help with new data challenges, such as an ever-growing variety of data sources, including social media data and big data. For some organizations, this will mean moving from a call center to a contact center methodology, for example—a huge process shift that will be reflected in the resulting data. If processes are not updated, business users will resort to mashing data together in Excel simply because there seems to be no clear way for them to combine data in a more robust manner. This does not always work well; for example, Excel tables may be overly decorated, or HTML tables may be interpreted as structural markup rather than actual markup. All this can be confusing for downstream frontend systems.
People need to be isolated from the need to write SQL as much as possible, since they do not always have the skill set to make changes correctly. Microsoft products that achieve this goal include SQL Server Integration Services (SSIS), Azure Data Factory, and Azure Databricks. These tools use complicated orchestration logic to guarantee that ETL packages run in sequence at the right time. ETL development requires a technical mindset to build routines that will import data correctly.
The business must recognize that data preparation is probably the most important aspect of strategic analytics, business intelligence, and, in fact, anything to do with data. Everyone has dirty data, and self-service data transformation is a necessity. If your organization thinks it doesn’t have dirty data, it is not looking hard enough. Businesses must realize that the need for self-service data transformation to answer business questions is an operational fact of life if customer needs are to be satisfied. Fortunately, Power BI can help.
Real-Time Data Ingestion Versus Batch Processing
Building such an enterprise-grade data integration pipeline is time-consuming, and there are many design considerations and guidelines to take into account. Often, businesses move so fast that it becomes difficult for the IT team to keep up with the pace of change in the requirements. Microsoft has developed dataflows, a fully managed data preparation tool for Power BI, to overcome this challenge. There are two options: using dataflows to import data using real-time or batch data processing, or using streaming datasets to work with real-time data.
Real-Time Datasets in Power BI
Real time often means different things to different organizations. For example, in some organizations, data warehouse loads update once a day but are considered “realtime.”
From the Power BI perspective, real-time streaming does happen in real time, often with updates happening more than once a second. Power BI lets you stream data and update dashboards in real time, and any Power BI visual or dashboard created in Power BI can represent and update real-time data and visuals.
What is the genesis of real-time data? Streaming data devices and sources can include manufacturing sensors, social media sources, or many other time-sensitive data collectors or transmitters. Thus, many scenarios involve real-time data, and Power BI offers various real-time data ingestion opportunities.
In Power BI, there are three types of real-time datasets to support the display of real-time data on dashboards:
-
Push datasets
-
Streaming datasets
-
PubNub streaming datasets
This section will review how these datasets differ, and then we will discuss how real-time data gets into these datasets.
Setting up streaming datasets
The Power BI service allows you to set up streaming datasets. To do this, click the New button (+) in the upper-left corner of the Power BI service. Now, select Streaming dataset (Figure 1-20).
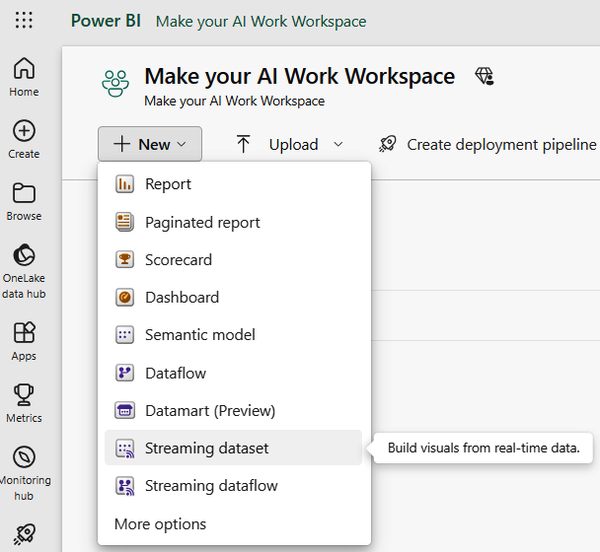
Figure 1-20. Setting up streaming datasets
When you click on the New button, you see the three options visible in Figure 1-21. From this point, there are three options to create a streaming dataset: one is to create a data stream using an API, the second is to create an Azure Analytics stream, and the third is to use PubNub as a dataset from the streaming data source.
- API
-
You can create a streaming dataset with the Power BI REST API. After you select API from the New streaming dataset window, you have several options to enable Power BI to connect to and use the endpoint, as shown in Figure 1-22.
- Azure Stream
-
To create an Azure Stream, you need to head to the Azure Stream Analytics help page to set up your streaming dataset. Microsoft will be surfacing this feature shortly on Power BI but it is not currently available in the Power BI portal (Figure 1-23).
- PubNub
Azure Stream Analytics offers a way to aggregate the raw stream of PubNub data before it goes to Power BI, so that Power BI can optimally present the data. As PubNub is a third-party tool, we will not be covering it in this book.
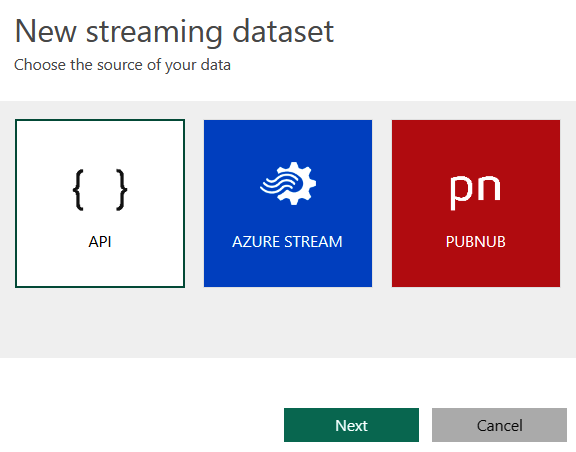
Figure 1-21. Selecting the streaming dataset type
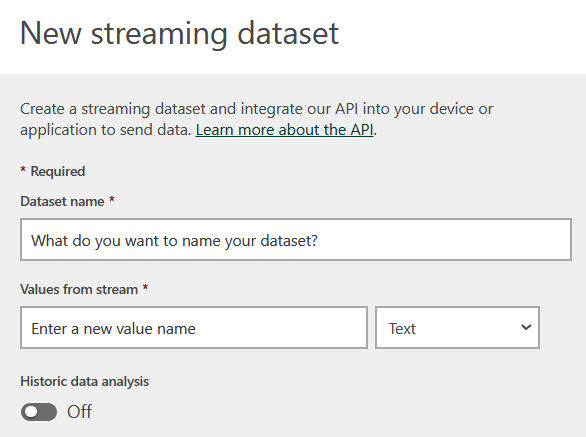
Figure 1-22. Configuring the Power BI API
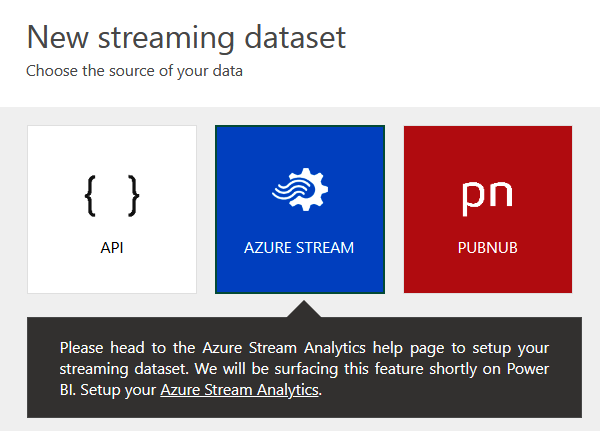
Figure 1-23. Selecting Azure Stream from Azure Stream Analytics
Ingesting data into Power BI: Push method versus streaming method
The push dataset and the streaming dataset methods receive data in a push model, in which the data is pushed into Power BI. Power BI creates an underlying database that forms the basis of the visualizations in Power BI reports and dashboards. In contrast, the streaming method does not store the data for more than an hour.
The push method allows the report developer to build reports using the data stored in the database, such as by filtering, using Power BI visuals, and using Power BI reporting features. On the other hand, the streaming method does not permit the use of standard Power BI reporting features; instead, it uses a custom streaming source that displays real-time data with very low latency.
Batch Processing Data Using Power BI
Power BI dataflows are perfect when there is a need for business-oriented, self-service data movement. Business users use dataflows to quickly connect to data sources and prepare the data for reporting and visualization. Power BI dataflows are similar to Excel worksheets, so users are already familiar with the skills needed to use this tool.
Even though Power BI dataflows are business-friendly, they work with the massive amounts of transactional and observational data stored in the ADLS Gen2. In addition, Power BI dataflows work with big data data stores and the little data that runs the business. Therefore, for cloud-first or cloud-friendly organizations, Power BI dataflows can access Azure data services.
For Microsoft customers, Power BI integrates neatly with the rest of the Power BI system. For example, Power BI dataflows support the CDM—a set of legal business entities such as Account, Product, Lead, and Opportunity. Dataflows enable easy mapping between any data in any shape and into CDM legal entities.
Power BI dataflows also have a rich set of capabilities that are useful for a variety of scenarios. Firstly, dataflows can connect to data sources and ingest data tables. They can merge and join tables together, as well as union tables. Further, dataflows can also perform the common practice of pivoting data. Dataflows enrich data by creating new computed columns in tables, and they can simplify data by filtering tables so that users can get what they need in a frictionless manner.
Another great advantage of dataflows is that they can automatically run on a schedule, allowing developers to set it and forget it! The “last-mile problem” of analytics is that businesses do not always understand how to realize value from an analytics project. Automation is a crucial way to gain value from these projects, helping businesses with the last-mile problem of putting their solutions into production environments.
Power BI dataflows can also interact with AI by training and applying AI models on the tables. Therefore, it is possible to use AI in dataflows.
Importing Batch Data with Power Query in Dataflows
Power Query, which helps create Power BI dataflows, is accessible from Power BI, Excel, and the Power Query online experience. This user-friendly tool for data transformation allows business analysts and data analysts to read data from an extensive range of sources.
The Power Query user interface (UI) offers dozens of ways to compute and transform data directly using the Power Query ribbon and dialogs. Besides being easy to use, Power Query can transform data in compelling and extensible ways. It supports more than 80 built-in data sources and a custom connector Software Development Kit (SDK) with a rich ecosystem. An SDK provides a collection of software tools, libraries, documentation, code samples, processes, and guides that allow developers to create software applications on a specific platform. When it comes to connecting to data, an SDK is used for connection management, security, and customization. The custom connector SDK streamlines the development process by abstracting complex details so it is simpler to connect and retrieve data from less common sources that are not part of the data sources available out of the box.
Everything in the Power Query UI gets automatically translated to code in a language called M. Although users do not need to write code, using M in Power Query is a great way to learn about coding and behind-the-scenes transformation activities. The M language is a topic in its own right and thus is outside the scope of this book.
The Dataflow Calculation Engine
Dataflows have a calculation engine that helps put all the columns together, making things easy. At some point, Excel users bump into an issue where there is a circular dependency involved in a formula. The dataflow calculation engine helps to clear up such issues by creating links to check out dependencies before implementation.
For many enterprises, it is necessary to produce multiple dataflows due to a variety of data sources, none of which is the source of truth. These multiple dataflows are created and managed in a single Power BI workspace, so they are easy to administer. Also, part of the process of ensuring high-quality data integrity involves examining the dependencies between the workflows for consistency.
Dataflow Options
Organizations can use Power BI dataflows in a few ways. Let’s explore some of the options.
Option 1: Fully managed by Power BI
Power BI handles everything in the cloud, from data ingestion to data structuring and refresh to final data visualization. The data journey starts with use of the web-based Power Query online tool for structuring the data. An Azure data lake stores the data using Azure infrastructure, which is transparent to the organization. With this option, the organization cannot manage the data itself as Power BI is providing a comprehensive cloud service.
Option 2: Bring your own data lake
Option 2 is almost identical to Option 1 with one significant difference: the organization associates its own Azure data lake account with Power BI and manages it using tools such as Power Query and Power BI. This option is helpful for organizations that would like to access their data outside of Power BI.
Power BI dataflows in Power BI Desktop
Regardless of which option is used to manage Power BI dataflows, business users will extract the data using the Get Data option in Power BI Desktop or the online version of Power BI. The Get Data option is straightforward to use. There is no need for the Power BI developer to know where the data is stored, since the developer can select the relevant data tables. Another convenient feature is that it is possible to join tables that refresh on different schedules.
DirectQuery in Power BI
It is possible to connect to different data sources when using Power BI Desktop or the Power BI service and to make those data connections in different ways. The Power BI developer connects directly to data in the original source repository using a method known as DirectQuery.
Experience has found that users often say that they want the most up-to-date information right away. This does not mean that they want real-time data, however. In truth, real-time and up-to-date are not the same thing. Let’s take an example. Say that the data is loaded every night using batch processing so it is ready for the business to view by 8:00 a.m. Since the data will not be refreshed until 8:00 a.m., using the Import method is perfect; the users will see the latest data as of 8:00 a.m.
Import Versus Direct Query: Practical Recommendations
You’ll remember from earlier that the Import Data method stores the data in Power BI. The data is stored in memory, making visuals and reports more responsive. The data is transformed using Power BI dataflows or the Power Query Editor so that the developer can transform and shape data as required. The data is refreshed via specific schedules; the number of available schedules depends on the Power BI license that you have. You can use data from offline or sporadically available sources.
As you might expect, there are a few caveats, depending on your specific scenario. There are limits in terms of the data volume, with the limit depending on your license: the size limit per dataset is 2 GB for Power BI Pro and higher for Premium. Since the Import model pulls the data on a schedule, the data is only as fresh as the last refresh.
Direct Query is perfect if your scenario requires data updates on a higher frequency. Direct Query means that data is always up-to-date with the source. Since the data isn’t stored in Power BI, there are no limitations on the data size. Also, the business logic remains centralized at the source.
However, since the data remains at the source, Power BI’s reporting performance may be slower than with the Import method. With Direct Query, queries are sent to the source database, the data is retrieved from the source, and then the data is sent back to the Power BI dashboard. If the dashboard loses its connection, then Power BI will not be able to display any data. Therefore, Direct Query requires a constant connection to the data source.
The Import Data method is suitable when you have smaller datasets or datasets that fit within your capacity limitations. It is also appropriate for offline or data sources that are sporadically available. Direct Query is also useful if your scenario requires more data updates than are available with the Import Data method.
Summary
The range of options in Power BI dataflows allows the organization to manage Power BI using the degree of “cloudiness” that it prefers. Ultimately, businesses are trying to find a balance between “silver platter” reports and self-service, and Power BI dataflows offer both methods of reporting while avoiding the Excel hell of data puddles that are unmonitored, unmanageable, and unruly pieces of data debt.
Get Artificial Intelligence with Microsoft Power BI now with the O’Reilly learning platform.
O’Reilly members experience books, live events, courses curated by job role, and more from O’Reilly and nearly 200 top publishers.

