Chapter 1. Creating Business Value with AI
In this chapter, we are going to explore why AI adoption in business intelligence (BI) is becoming more important than ever and how AI can be utilized by BI teams. For this purpose, we will identify the typical areas in which AI can support BI tasks and processes, and we will look at the underlying machine learning (ML) capabilities. At the end of the chapter, we’ll go over a practical framework that will let you map AI/ML capabilities to BI problem domains.
How AI Is Changing the BI Landscape
For the past 30 years, BI has slowly but steadily become the driving force behind data-driven cultures in companies—at least until the attention shifted toward data science, ML, and AI. How did this even happen? And what does this mean for your BI organization?
When we look back to the beginning of the first era of decision support systems in the 1970s, we see technical systems used by IT experts to get insights from small (by today’s scale) datasets. These systems evolved and eventually became known as BI in the late 1980s. Analyzing data was new, so even the most basic insights seemed jaw-dropping. Suddenly, decisions were no longer based on gut instinct, but on actual data that enabled safer and bolder decisions in complex business scenarios.
The second era of BI started in the mid-2000s and was dominated by self-service analytics. A plethora of new tools and technologies made it easier than ever for a nontechnical audience to slice and dice data, create visualizations, and extract insights from ever-larger data sources. These were primarily offered by large software vendors such as Oracle, SAP, and Microsoft, but also spurred the growth of niche BI companies such as Tableau Software. Spreadsheet software also became increasingly integrated into the overall data analytics ecosystem—e.g., by allowing business users to access online analytical processing (OLAP) cubes on a Microsoft SQL Server system via pivot tables in Microsoft Excel.
Most large companies today are still stuck in this second phase of BI. Why is that? First, many technological efforts in recent years have focused on technically managing the exponential growth of the underlying data that BI systems were designed to process and derive insights from. Second, the increase in the amount of data, driven primarily by the growth of the internet and digital services (see Figure 1-1), has led to an increasing shortage of data-literate people who were skilled in handling high-dimensional datasets and the tools to do so (in this case, not Excel).
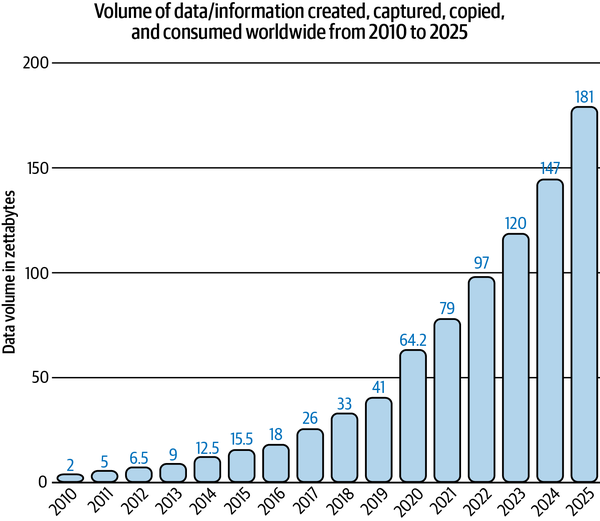
Figure 1-1. Data growth in recent years. Source: Statista
Compared to the consumer market, AI applications are still underserved in the professional BI space. This is probably because AI and BI talent sit in different teams within organizations, and if they ever meet, they have a hard time communicating effectively with each other. This is mainly because both teams typically speak different languages and have different priorities: BI experts usually don’t talk much about training and testing data, and data scientists rarely chat about SQL Server Integration Services (SSIS) packages and extract, transform, load (ETL) routines.
The need for AI adoption in BI, however, is going to inevitably increase, based on the following ongoing trends:
- The need to get quick answers from data
- To remain competitive and grow, organizations demand data-driven insights. Data analysts get overwhelmed with inquiries to explore this or that metric or examine this or that dataset. At the same time, the need for business users to get quick and easy answers from data increases. If they can ask Google or Amazon Alexa about the current stock price of a certain company, why can’t they ask their professional BI system about the sales figures from yesterday?
- Democratization of insights
- Business users have become accustomed to getting insights from data with self-service BI solutions. However, today’s data is often too large and too complex to be handed off to the business for pure self-service analytics. Increased data volume, variety, and velocity make it difficult, if not impossible, today for nontechnical users to analyze data with familiar tools on their local computers. To continue democratizing insights across an organization, BI systems are needed that are easy to use and that surface insights automatically to end users.
- Accessibility of ML services
- While use of AI continues to rise within organizations, so does the expectation for better forecasting or better predictions. This applies even more so to BI; low-code or no-code platforms make it easier than ever before to make ML technologies available to non-data-scientists and puts pressure on the BI team members to incorporate predictive insights into their reports. The same advancements in data science are also expected to happen in the field of BI, sooner or later.
To get a better understanding of how BI teams can leverage AI, let’s briefly review the analytical insights model published by Gartner (Figure 1-2).
The core functionality of every BI or reporting infrastructure is to deliver hindsight and insight by using descriptive and diagnostic analytics on historical data. These two methods are paramount for all further analytical processes that layer on top of them.
First, an organization needs to understand what happened in the past and what was driving these events from a data perspective. This is typically called basic reporting with some insight features. The technical difficulty and complexity is comparably low, but so is the intrinsic value of this information. Don’t get me wrong: reliable and structured reporting is still the most important backbone of data analytics in business, as it lays out the foundation for more advanced concepts and triggers questions or problems that drive further analysis. In fact, every stage of the insights model is inclusive to all previous stages. You can’t do predictive analytics until you make sense of your historical data.
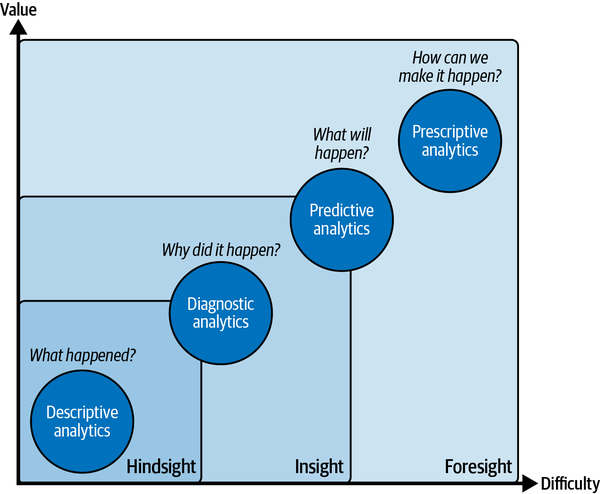
Figure 1-2. Types of insights and analytic methodologies. Source: Gartner
Consider the following example. A telco company has customers who subscribe to a service on a monthly basis. Each month, a certain number of customers will not renew their service contract and drop out of the business relationship—a phenomenon called customer churn.
The most basic requirement for a BI system would be to understand how many customers churned in the past and how this churn has developed over time. Descriptive analytics would give us the necessary information to find out how high the churn rate is over time and whether we actually have a problem. Table 1-1 gives an example of what this could look like.
| Q1 | Q2 | |||||
|---|---|---|---|---|---|---|
| Month | January 22 | February 22 | March 22 | April 22 | May 22 | June 22 |
| Churn rate | 24% | 26% | 22% | 29% | 35% | 33% |
The intrinsic value of this information is rather low. At this level, the analysis can’t really tell why the observed phenomenon happened or what to do about it. But at least it’s indicating whether we have a problem at all: from the table, we can see that the churn rate in Q2 appears to be significantly higher than in Q1, so it might be worth looking into this even more.
That’s where diagnostic analytics come into play. We could now dig deeper and enrich transactional sales data with more information about the customers—for example, customer age groups, as shown in Table 1-2.
| Customer age | Churn rate Q1 | Churn rate Q2 |
|---|---|---|
| 18–29 | 29% | 41% |
| 30–49 | 28% | 30% |
| 50–64 | 24% | 25% |
| 65 and older | 20% | 19% |
This analysis would inform us that churn rates seemed to remain stable across customers who are 50 and older. On the other hand, younger customers seem to be more likely to churn, and this trend has increased in Q2. Classical BI systems would allow us to analyze this data across many variables to find out what’s going on.
In many cases, a business would be able to find valuable patterns that lead to manual action or decisions through these kinds of analyses alone. That’s why this stage is still so crucial and will always remain very important.
Predictive analytics takes the analysis one step further and answers a single question: what will happen in the future, given that all the patterns we know from the past are repeated? Therefore, predictive analytics adds another level of value and complexity to the data, as you can see in Table 1-3.
| Customer ID | Age | Plan | Price | Months active | Churn probability |
|---|---|---|---|---|---|
| 12345 | 24 | A | $9.95 | 13 | 87% |
| 12346 | 23 | B | $19.95 | 1 | 95% |
| 12347 | 45 | B | $19.95 | 54 | 30% |
Complexity is added as we leave the realm of historical data. Instead of providing insights in binary terms of true or false, we are now introducing probabilities of certain events happening (churn probability). At the same time, we add value because we incorporate everything we know from the past into assumptions about how this will influence future behavior.
For example, based on the future churn probability and historical sales data, we can calculate a forecasted sales risk for the company in the coming quarters, which is incorporated into our financial planning. Or, we could select those customers with high churn probability to take targeted actions that mitigate the churn risk.
But which actions should we take? Welcome to prescriptive analytics! Table 1-4 shows how this might look in practice. In this case, we add another dimension, next best offer, which includes a recommended action such as a specific discount or product upgrade, depending on the customer’s individual profile and historical purchase behavior.
| Customer ID | Age | Plan | Price | Months elapsed | Churn probability | Next best offer |
|---|---|---|---|---|---|---|
| 12345 | 24 | A | $9.95 | 13 | 87% | Yearly contract offer |
| 12346 | 23 | B | $19.95 | 1 | 95% | Upgrade |
| 12347 | 45 | B | $19.95 | 54 | 30% | None |
As we look into organizations with thousands or more customers, it becomes clear that to optimize these tasks from a macro perspective, we need to rely on automation on a micro level. It is simply impossible to go through all these mini decisions manually and monitor the effectiveness of our actions for each customer. The return on investment (ROI) of these mini decisions is just too low to justify the manual effort.
And this is where AI and BI go perfectly together. Consider that AI can indicate churn likelihood together with a suggested next best action for each customer. We can now blend this information with classical BI metrics such as the customer’s historical revenues or the customer’s loyalty, allowing us to make an informed decision about these actions that have the highest business impact and best chances for success.
The relationship between AI and BI can therefore be summed up nicely in the following formula:
-
Artificial Intelligence + Business Intelligence = Decision Intelligence
The most effective AI-powered BI application is one that blends automated and human decision making. We will explore this practically in Part 2. Now, let’s take a concrete look at how AI can systematically help us to improve our BI.
Common AI Use Cases for BI
AI can typically add value to BI in three ways:
-
Automating insights and making the analytical process more user-friendly
-
Calculating better forecasts and predictions
-
Enabling BI systems to drive insights even from unstructured data sources
Figure 1-3 gives a high-level overview of how these application areas map to the various analytical methods.
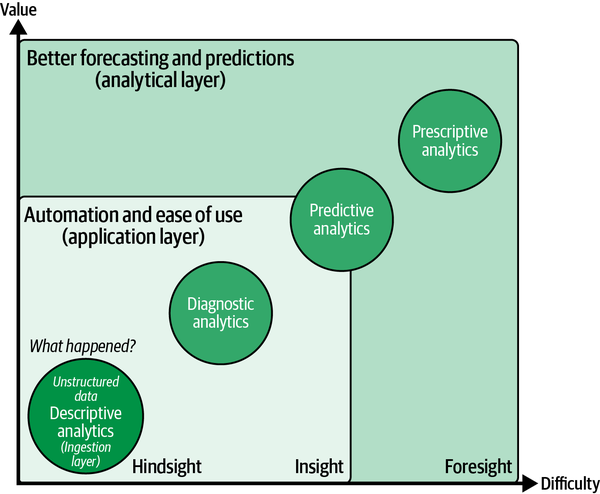
Figure 1-3. How AI capabilities support analytical methods
Let’s explore these areas in a bit more detail.
Automation and Ease of Use
Making the BI tool itself more intelligent and easy to use will make it even more accessible to nontechnical users, reducing the workload of analysts. This ease of use is usually achieved through under-the-hood automation.
Intelligent algorithms make it possible to sift through mountains of data in seconds and provide business users or analysts with interesting patterns or insights. As Figure 1-4 shows, these routines are particularly well suited for the descriptive and diagnostic analysis phases.
AI can help discover interesting correlations or unusual observations among many variables that humans might otherwise miss. In many cases, AI is also better able to look at combinations of metrics than humans, who can focus on one metric at a time. But automation and usability also touch the predictive analytics phase—for example, by making it even easier for users to train and deploy custom ML models.
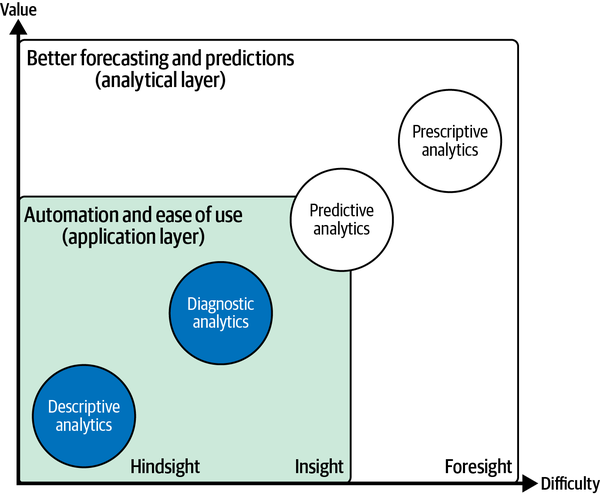
Figure 1-4. AI-powered BI: automation and ease of use (application layer)
There is one important thing to note here: the AI capabilities at this stage are typically built into the application layer, which is your BI software. So you can’t typically add these capabilities to a BI platform with a few lines of Python code (in contrast to AI-powered predictions and unlocking unstructured data, which we discuss in Chapters 7, 8, and 9.) If you are using modern BI platforms such as Microsoft Power BI or Tableau, you’ll find these AI-enabled features inside these tools. Sometimes they are hidden or happening so seamlessly that you don’t even notice that AI is at work here.
The rest of this section describes indicators that AI is working under the hood to make your life as an analyst much easier.
Using natural language processing to interact with data
By using AI-powered natural language processing (NLP) technologies, machines are much better at interpreting and processing textual input from users. For example, let’s say you want to know the sales results for last month or the sales in the United States last year as compared to this year. You might type in the following queries:
How were my sales in Texas in the last 5 years?
or
Sales $ in Texas last year vs Sales $ in Texas this year
No complicated code or query language needed. This layer of Q&A–like input makes BI much more accessible to nontechnical users as well as more convenient for analysts who really can’t anticipate every question a business user might ask with a premade report. Most users will be quite familiar with this approach because it is similar to using a search engine such as Google.
Whether or not Q&A tools are built into your BI tool, not all of these implementations work equally well. In fact, a huge complexity needs to be solved behind the scenes to make these features work reliably in production environments. Analysts have to track the kinds of questions business users ask and validate that the generated output is correct. Synonyms and domain-specific lingo need to be defined to make sure systems can interpret user prompts correctly. And as with all IT systems, these things need constant maintenance. The hope is that the systems will improve and the manual effort needed in the background will decrease over time.
Summarizing analytical results
Even if a chart seems self-explanatory, it is good practice to summarize key insights in one or two lines of natural language, reducing the risk of misinterpretation. But who really enjoys writing seemingly all-obvious descriptions below plots in reports or presentations? Most people don’t, and that’s where AI can help.
AI-powered NLP cannot only help you to interpret natural language input, but also generate summary text for you based on data. These autogenerated texts will include descriptive characteristics about the data as well as noteworthy changes or streaks. Here’s an example of an autogenerated plot caption from Power BI:
Sales $ for Texas increased for the last 5 years on record and it experienced the longest period of growth in Sales between 2010 and 2014.
As you can see, these small AI-generated text snippets can make your life as an analyst much easier and save you a bulk of time when it comes to communicating insights to other stakeholders. Besides that, they can help cover accessibility requirements for screen readers.
Using automation to find patterns in data
You’ve seen how NLP capabilities can help you get descriptive insights from your data efficiently. The next logical step is to find out why certain observations happened in the past, such as why exactly did sales in Texas increase so much?
With diagnostic analytics, you would normally need to comb through your dataset to explore meaningful changes in underlying data distributions. In this example, you might want to find out whether a certain product or a certain event was driving the overall change. This process can quickly become tedious and cumbersome. AI can help you decrease the time to insight (TTI).
Algorithms are great at recognizing underlying patterns in data and bringing them to the surface. For example, with AI-powered tools such as decomposition trees or key influencer analysis, you can quickly find out which characteristic(s) in your data led to the overall observed effect—on the fly. In Chapters 5 and 6, we’ll look at three concrete examples of using AI-powered capabilities in Power BI to make your life as a data analyst or business user easier.
Better Forecasting and Predictions
While descriptive and diagnostic analytics have been at the heart of every BI system, the imminent desire has always been to not only understand the past but also foresee the future. As you can see in Figure 1-5, AI-enhanced capabilities can support end users to apply powerful predictive and prescriptive analytical methods for better forecasting and predictions based on historical data.
This will add complexity since we leave the realms of binary data from the past and introduce probabilistic guesses about the future, which naturally contain many uncertainties. At the same time, the prospected value rises: if we are about to predict the future, we can make much better decisions in the present.
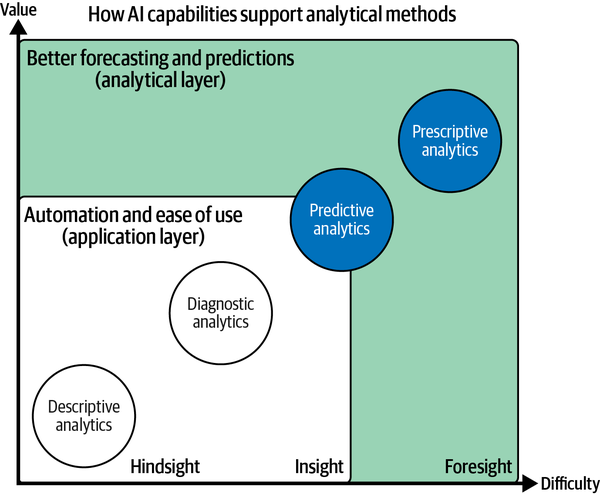
Figure 1-5. AI-powered BI: better forecasting and predictions (analytical layer)
Now, maybe you’ve heard about statistical methods like regression or autoregressive integrated moving average (ARIMA) before (perhaps in high school or basic college courses), and are wondering what’s the big deal with AI. Take note of the two following aspects:
- AI can produce better forecasts with more data and less human supervision.
- AI leverages old-school techniques such as linear regression at its core. But at the same time, AI can apply these techniques to complex datasets by using stochastic approaches to quickly find an optimal solution without the need for extensive human supervision. Specialized algorithms for time-series predictions are designed to recognize patterns in larger amounts of time-series data. AI tries to optimize the forecast based on feature selection and minimizing loss functions. This can lead to better or more accurate predictions using a short time horizon, or trying to predict more accurately over a longer period of time. More complex, nonlinear models can lead to more granular and, eventually, better predictive results.
- AI can calculate predictions at scale for optimized decision making.
- Forecasting the total number of customers over the next quarter is nice. But what’s even better is to calculate a churn likelihood for every customer in your database, based on recent data. With this information, we not only can tell which customers will probably churn next month, but also optimize our decision making. For example, we can determine, of all customers who will churn next month, which should be targeted with a marketing campaign. Combining ML with BI creates a potentially huge value proposition for an organization. And with the advance of novel techniques such as automated machine learning (AutoML) and AI as a service (AIaaS), which we will explore further in Chapter 3, organizations can reduce the bottlenecks caused by not having enough data scientists or ML practitioners to leverage these AI potentials.
AI capabilities for enhanced forecasting or better predictions can be found as an integral part of existing BI software (application layer). These capabilities also can be applied independently, directly on a database level (analytical layer). This makes them always available, no matter which BI tool you are using. We explore how to apply these techniques in Chapters 7 and 8.
Leveraging Unstructured Data
BI systems typically work with tabular data from relational databases such as enterprise data warehouses. And yet, with rising digitalization across all channels, we see a dramatic increase in the use of unstructured data in the form of text, images, or audio files. Historically, these forms are difficult to analyze at scale for BI users. AI is here to change that.
AI can increase the breadth and depth of available and machine-readable data by using technologies such as computer vision or NLP to access new, previously untapped data sources. Unstructured data such as raw text files, PDF documents, images, and audio files can be turned into structured formats that match a given schema, such as a table or CSV file, and can then be consumed and analyzed through a BI system. As this is something that happens at the data-ingestion level, this process will ultimately affect all stages of the BI platform (see Figure 1-6).
By incorporating these files into our analysis, we can get even more information that can potentially lead to better predictions or a better understanding of key drivers. Chapter 8 will walk you through examples of how this works in practice.
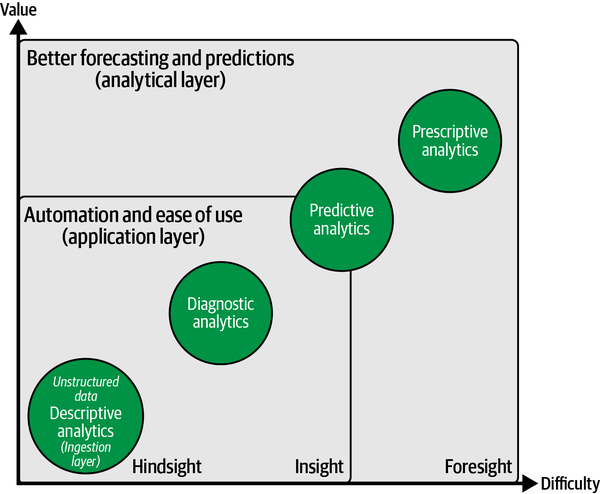
Figure 1-6. AI-powered BI: unlocking unstructured data in the ingestion layer
Getting an Intuition for AI and Machine Learning
We’ve talked a lot about how AI can be used with BI. But to actually build AI-powered products or services, we need to dig deeper and understand what AI is and what it is capable (and not capable) of achieving.
So what is AI, really? If you ask 10 people, you will probably get 11 answers. For the course of this book, it is important to have a common understanding of what this term actually means.
Let’s first acknowledge that the term artificial intelligence is not new. In fact, the term dates back to military research labs in the 1950s. Since then, researchers have tried many approaches to accomplish the goal of having computers or machines replicate human intelligence. As Figure 1-7 shows, two broad fields of AI have emerged since its inception: general AI and narrow AI.
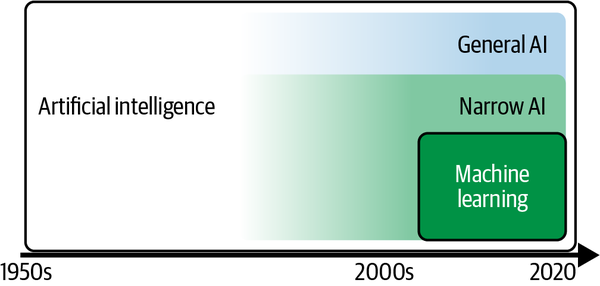
Figure 1-7. Development of artificial intelligence
General AI, or strong AI, refers to a technology that aims to solve any given problem that the system has never seen or been exposed to before, similar to the way the human brain works. General AI remains a hot research topic, but it is still pretty far away; researchers are still uncertain that it will ever be reached.
Narrow AI, on the other hand, refers to a rather specific solution that is capable of solving a single, well-defined problem it has been designed for and trained on. Narrow AI has powered all the AI breakthroughs we have seen in the recent past, both in research and in practical or business-related fields.
At the core of narrow AI, one approach has stood out in terms of business impact and development advancements: machine learning. In fact, whenever I talk about AI in this book, we look at solutions that have been made possible through ML. That is why I will use AI and ML interchangeably in this book and consider AI as a rather broad term with a quite literal meaning: AI is a tool to build (seemingly) intelligent entities that are capable of solving specific tasks, mainly through ML.
Now that the relationship between AI and ML is hopefully a bit clearer, let’s discuss what ML actually is about. ML is a programming paradigm that aims to find patterns in data for a specific purpose. ML typically has two phases: learning (training) and inference (also called testing or prediction).
The core idea behind ML is that we find patterns in historical data to solve a specific task, such as putting observations into categories, scoring probabilities, or finding similarities between items. A typical use case for ML is to analyze historical customer transaction data to calculate individual probabilities of customer churn. With inference, our goal is to calculate a prediction for a new data point given everything that we learned from the historical data.
To foster your understanding of ML, let’s unpack the core components of our definition:
- A programming paradigm
-
Traditional software is built by coding up rules to write a specific program. If you develop a customer support system, you come up with all the logic that should happen after a customer files a support ticket (e.g., notify support agents via email). You document all the rules, put them into your program, and ship the software.
ML, however, inverts this paradigm. Instead of hardcoding rules into a system, you present enough examples of inputs and desired outputs (labels) and let the ML algorithm come up with the rule set for you. While this setup is ineffective for building a customer support system, it works great for certain scenarios where the rules are not known or are hard to describe. For example, if you want to prioritize customer support tickets based on a variety of features such as the ticket text, customer type, and ticket creation date, an ML algorithm could come up with a prioritization model for you just by looking at how past tickets have been prioritized. Instead of handcrafting a complicated if-then-else logic, the ML algorithm will figure it out, given a certain amount of computation time and computational resources.
- Pattern finding in data
- To find useful patterns in data, three important concepts play together: algorithm, training, and model. An ML model is the set of rules or the mathematical function that will calculate an output value given a specific data input. Think of it as a big stack of weighted if-then-else statements. The ML algorithm describes the computational process a machine has to follow to get to this model. And the term training means iterating many times over an existing dataset to find the best possible model for this particular dataset, which yields both a low prediction error and a good generalization on new, unseen data inputs so that the model can be used for a specific purpose.
- A specific purpose
- ML tasks are typically categorized by the problem they are trying to solve. Major areas are supervised and unsupervised learning. Although this isn’t a book on ML fundamentals, we cover them in a bit more detail in Chapter 3.
If we consider all of the components, the task of an ML practitioner in a real-world situation is to gather as much data about the situation of interest as is feasible, choose and fine-tune an algorithm to create a model of the situation, and then train the model so that it’s accurate enough to be useful.
One of the biggest misconceptions about AI and ML that business leaders often have is that AI and ML are super hard to implement. While designing and maintaining specific, high-performing ML systems is a sophisticated task, we also have to acknowledge that AI has become commoditized and commercialized so that even non-ML experts can build well-performing ML solutions using existing code libraries, or no-code or low-code solutions. In Chapter 4, you will learn more about these techniques so you can implement ML solutions by yourself without the help of data scientists or ML engineers.
AI as a term can be scary and intimidating for people who don’t really know what it means. The truth is, we are far off from The Terminator and general AI. If you want to get broader acceptance and adoption of AI solutions inside your organization, you need to communicate what AI is in friendly and nontechnical language. Thinking about AI as automation or being able to implement better decisions based on past learning should make you comfortable enough to spot potentially good use cases and share that spirit with fellow coworkers.
Mapping AI Use Case Ideas to Business Impact
Now that you have learned more about AI and how it can be applied to BI, you might already have some ideas in mind for applying AI to your own use cases. To figure out which of those have the most potential and are worth fleshing out, we will take a look at a story-mapping framework you can use for exactly this purpose. The framework is inspired by Agile project management techniques and should help you structure your thinking process.
The core idea of this AI story-mapping framework is to contrast the present implementation of a process with an AI-enabled implementation of that process. This technique will give you a high-level, end-to-end overview of what would be different, which things you would need to change, and, above all, help you structure your thinking process.
The creation of a storyboard is straightforward. Take a blank piece of paper and divide it into a table with four columns and two rows. The four upper boxes will map your current process, and the lower boxes will describe the future, anticipated implementation. Name the columns from left to right: Setup, Actions, Outcomes, Results. Figure 1-8 shows how your piece of paper should look.
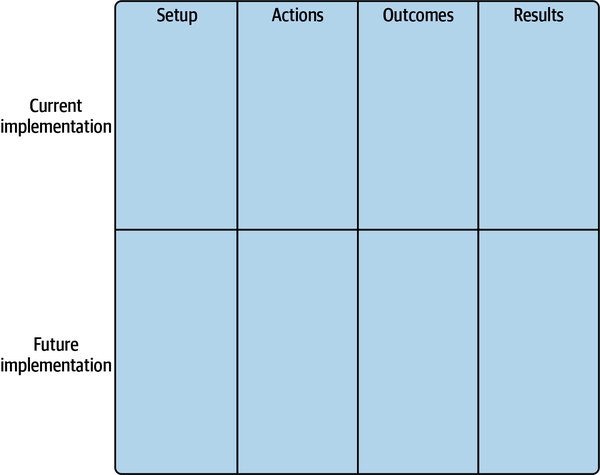
Figure 1-8. Storyboard template
To create your storyboard, you need to populate the columns from left to right. You start with the first row, outlining how the current implementation of a given process works along the following dimensions:
- Setup
- Describes how the process starts and lists your assumptions, resources, or starting criteria.
- Actions
- Holds all tasks and action items that are executed by or on the resource outlined in the setup.
- Outcomes
- Describes the actual artifacts of the process. What exactly is being generated, created, or modified?
- Results
- Holds the impacts the outcomes have on the business, and/or subsequent next steps for the outcomes. For example, displaying a report in a dashboard is an outcome, but by itself does not have any impact. The impact is what happens based on the information shown in the dashboard and who is doing this.
In the next step, you will do the same for the anticipated future implementation. In the end, you will have a head-to-head comparison of the old and the new approach, giving you more clarity about how things are going to change and the impact these changes might have. To give a little bit more context about how this exercise works, Figure 1-9 shows a sample storyboard for our customer churn use case.
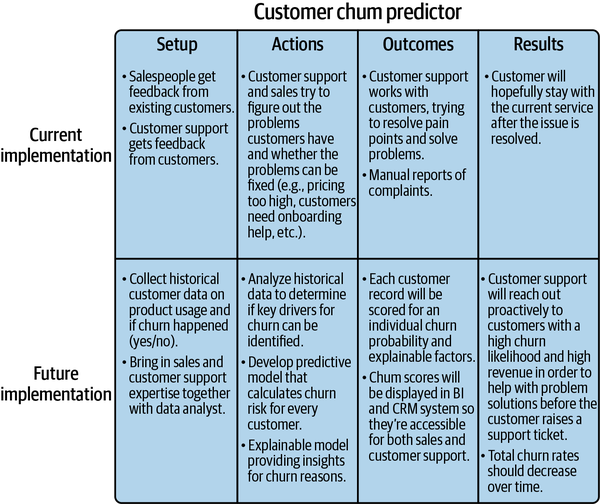
Figure 1-9. Storyboard example
Let’s walk through our storyboard example. We’ll start at the top-left corner, laying out the current setup for the existing process.
Currently, customer churn is detected by salespeople who get feedback from existing customers when talking to them in their regular meetings, or by customer support employees who receive feedback from customers that some things are not working out as they hoped or that they face other issues. In the next step, customer support or sales staff try to solve the problem directly with the customer—for example, providing onboarding help.
The main outcome of this process is that customer support (hopefully) resolves existing pain points and problems for the customer. Pain points might be reported to a management level or complaint management system. As a result, the customer will hopefully stay with the current service after the issue has been resolved.
Let’s contrast this with an AI-enabled implementation, starting with the bottom-left corner and proceeding right. In our setup, we would collect historical data about the ways customers use various products and services and would flag customers who churned and did not churn. We would also bring in staff from sales and customer service to share their domain expertise with the analyst in the loop.
Our next action would be to analyze the historical data to determine whether key drivers of customer churn can be identified in the dataset. If so, we would develop a predictive model to calculate an individual churn risk for each customer in our database as well as provide insights for why the churn might be likely to happen.
As an outcome, these churn risk scores and churn reasons would be presented to the business. The information could be blended with other metrics, such as customer revenue, and presented in a report in the customer relationship management (CRM) or BI system.
With this information, customer support could now reach out proactively to customers with a high churn risk and try to solve the problem or remove roadblocks before the customer actually flags a support ticket or churns without opening a ticket at all. As a result, the overall churn rate should reduce over time because the organization can better address reasons for customer churn at scale.
With both story maps—the existing and the new process—you should feel more confident about describing what a possible AI solution might look like, the benefits it could bring, and whether it is even reasonable to go for the new approach by either replacing or blending it with the existing process. As an exercise, use the storyboard template and map two or three AI use case ideas. Which of these ideas seem to be the most promising to you?
As a conclusion, the purpose of a storyboard is to provide a simple one-pager for each use case that intuitively contrasts the differences between, and benefits of, the existing and the new solution. A storyboard will help you to structure your thinking process and is a solid starting point when it comes to prioritizing AI use cases.
Summary
In this chapter, you learned how AI is changing the BI landscape, driven by the needs of business users to get quicker answers from data, the growing demand for democratized insights, and an overall higher availability of commoditized ML tools. We explored how exactly AI can support BI through automation and better usability, improved forecasting, and access to new data sources, thus empowering people to make better decisions. By now, you should have a basic understanding of how AI and ML work and their capabilities today. You also learned to use a framework that can help structure your thinking process and craft ideas for ML use cases.
In the next chapter, we will take a deeper look at how AI systems are designed and which factors you need to consider before implementing these technologies in your BI services.
Get AI-Powered Business Intelligence now with the O’Reilly learning platform.
O’Reilly members experience books, live events, courses curated by job role, and more from O’Reilly and nearly 200 top publishers.

