The inherent clumpiness of randomness
Finding patterns isn't really a question about random processes; it's a question about the human brain.
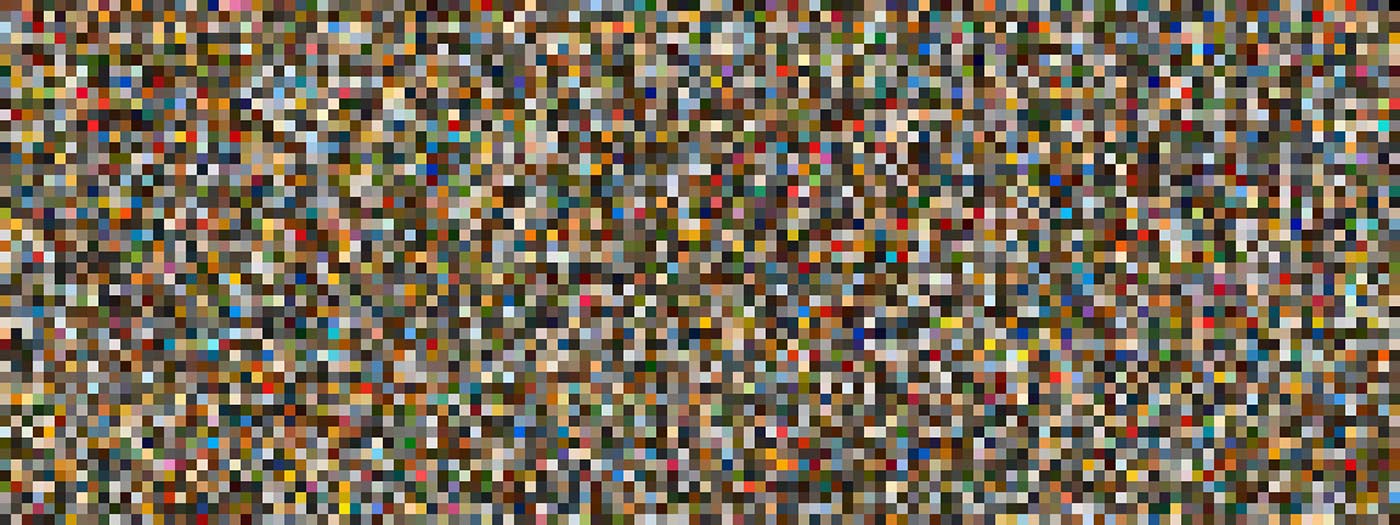
 6,144 colours in random order. (source: By grotos on Flickr)
I’ve always been interested in random processes. I steered away from writing a Math Honors essay in High School about randomness: that route certainly lead to madness. But the fascination with randomness has persisted, and particularly with what I call the “inherent clumpiness of randomness.”
Random events are inherently clumpy. It’s tempting to think that small numbers of random events should be “evenly spaced” (whatever that might mean). That’s not the case. If events weren’t clumpy, the events wouldn’t be random. Tossing 10 consecutive heads sounds unlikely. But if you flip a coin a million times, 10 consecutive heads will show up several hundred times. Clumps of 20 consecutive heads are much rarer, but there’s a very good chance they will show up once or twice in a million tosses. Look just at those consecutive heads, and you’ve got a nice “clump.” (You can compute the probabilities fairly easily using the Binomial Distribution, but it’s more fun to write a program.)
What would be really surprising, though, would be to find a “non-clumpy” distribution in which heads and tails are perfectly evenly distributed: HTHTHTHTHTHTHTHTHTHTH…. If we saw that sequence, from the first toss to the last, we’d be justified in thinking that something was wrong. Of course, the probability of getting 10 or 20 or 200 alternating heads and tails (starting with heads) is non-zero; for that matter, it’s exactly the same as the probability of 10, 20, or 200 consecutive heads.
Looking at any set of data in retrospect, it’s easy to find all kinds of patterns. Seeing patterns in data that aren’t really there is a mistake that’s all too common among data scientists. Let’s change the game somewhat. Rather than tossing coins, let’s throw darts at a square target. I’m not really good at darts, so my darts hit fairly randomly. The probability of four consecutive darts landing in the upper-left quadrant is 1/256, or about .004 (0.4%). That’s not terribly high. But let’s say I throw four darts: what are the chances that I can draw a box around all four with an area that’s less than or equal to a quarter the area of the square? Again, it’s possible to compute that probability from first principles, but it’s easier to write a simulation: the probability of four random darts landing in a rectangle with an area less than 1/4 the area of the target is about 30%. A lot higher.
The “clumping” phenomenon is even stronger than that. Instead of a rectangle, which contains a lot of area outside the four random points, what if we look at the area enclosed by those four points? The chance that that area will be less than 1/4 of the square is about 85%; that it will be less than 1/10 of the square, 33%. So, we’ll see tightly defined “clumps” fairly often.
What about larger groups? If we throw five darts, we’ll still see “clumps” occupying a quarter of the square or less 65% of the time; 1/10 of the square or less 13% of the time. With six darts, 44% and 4%. Past seven, the probabilities get small quickly.
That’s really just the start. Our brains are really good at finding patterns. So, the real question is “what’s the probability that a human will find some pattern in four darts thrown randomly at a target?” There are all sorts of patterns that we can find that my crude simulations don’t bother to detect: “Look, they all landed in the corners. Look, they all landed in sort of an S-shape.” We’re not really asking a question about random processes; we’re asking a question about the brain. And I’d guess the probability that we’d find some sort of pattern, given n darts, is close to 1. We’re really great at finding pictures in ink blots.
Our tools don’t save us. The Spurious Correlations site is a great repository of strange correlations: drownings in pools are strongly correlated with Nicholas Cage films, and cheese consumption is correlated with death by entanglement in bed sheets. Any large, multi-dimensional data set will almost always have spurious correlations. These spurious correlations usually disappear when you get even more data. If you have a data set with 1,000 dimensions (and that isn’t a huge number), there are 1,000,000 possible correlations. What’s the probability that one or more of them is significantly higher than you’d expect? Not small. We see false correlations in large data sets precisely because there are so many things to correlate. And our tools, when used uncritically, happily help us find those correlations. In James Kobelius’ classification of bogus correlations, the first three (fluke, ephemeral, and uncorroborated correlations) all arise from the inherent clumpiness of random events.
Any process that distributes events “evenly” (whatever we might mean by evenly) is probably not probabilistic. Humans are great at finding the clumps random processes throw at us, and even better at assigning significance to them. But these clumps are inherently useless. If you’re flipping a fair coin and get 20 consecutive heads, what’s the probability that the next flip will be a head? Just 0.5. At least mathematically, there’s no such thing as a “hot streak.” If you toss 20 heads in a row, don’t bet on the next toss being another head. (Don’t bet against it, either.) It’s very difficult for someone, even someone with a lot of mathematical intuition, to resist betting on a hot streak. If you’re watching a basketball game, that might not make much of a difference. But if you’re investing in stocks, running a business, or building a data platform, the future might depend on your ability to resist the inherent clumpiness of random processes.
