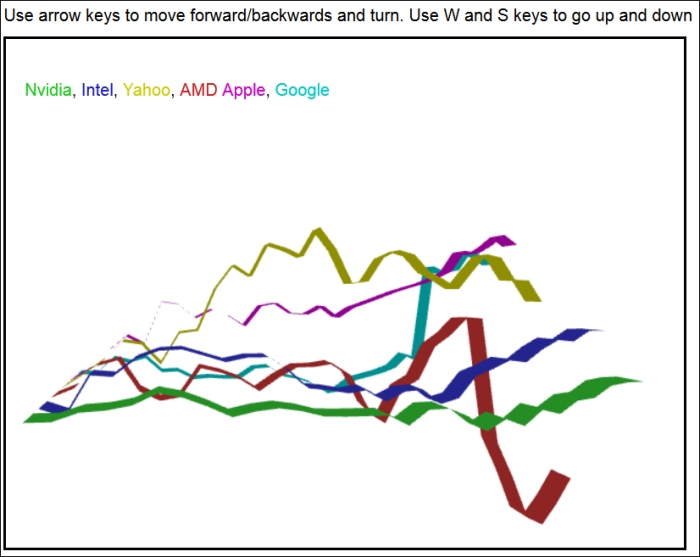
Presenting comparative data
To compare the performance of various stocks, we need an equal starting point. However, each stock has its own starting price. Thus, we need to adjust the data so that each begins at the same point.

Comparing the performance of six stocks from September to mid-October, 2013
Engage thrusters
We will not know the starting point until we read in the entire file, which in our case is the past 30 days. Once we read in all 30 closing prices for each of our stocks, we will divide all 30 daily closing prices by the first day's closing price. That sets our first day's closing price equal to 1. This means that all the stocks we compare ...
Get WebGL HOTSHOT now with the O’Reilly learning platform.
O’Reilly members experience books, live events, courses curated by job role, and more from O’Reilly and nearly 200 top publishers.

