Chapter 22 Showing Rank and Magnitude
Rank and magnitude sales dashboard
Author: Steve Wexler
Organization: Data Revelations
Scenario
Big Picture
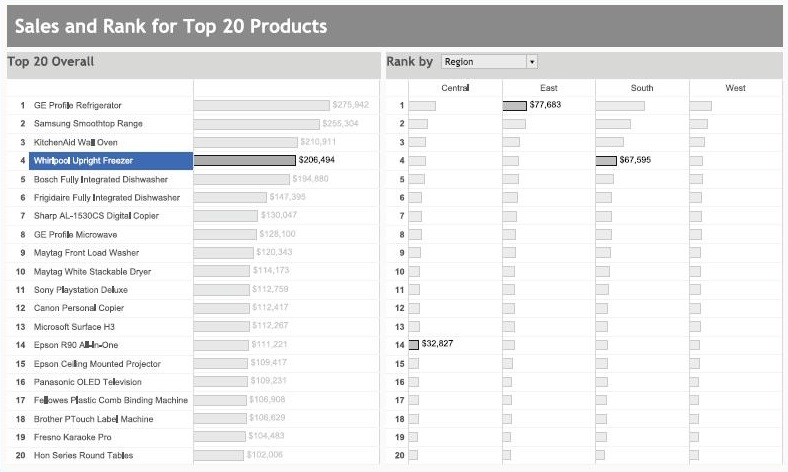
Imagine you are a sales director. You know which of your retail products are your top sellers but wish you had a better sense of how these products are performing in different market segments. For example, consider your best-selling refrigerator. Is it selling equally well in all regions, or is there one region where it's underperforming? Or think about your top computer tablet. It may be selling well overall, but are there market segments that avoid buying it?
You want to fashion an exploratory dashboard that lets you see both magnitude of sales and ranking for your top products broken down by virtually any demographic, revealing opportunities that you might otherwise miss.
Specifics
- You need to show the top 20 products sorted by sales.
- You want to see both the ranking and the magnitude of sales; that is, you need to be able to see easily just how much greater the sales are for one product than for another.
- You need to see how the rankings change when you look at sales across different dimensions—for example, region, customer segment, gender, and so on.
Related Scenarios
- You conduct a survey asking people a check-all-that-apply question and want to see which things are selected most often, ranked by different categories.
- You ...
Get The Big Book of Dashboards now with the O’Reilly learning platform.
O’Reilly members experience books, live events, courses curated by job role, and more from O’Reilly and nearly 200 top publishers.

