Chapter 9 Power Plant Operations Monitoring
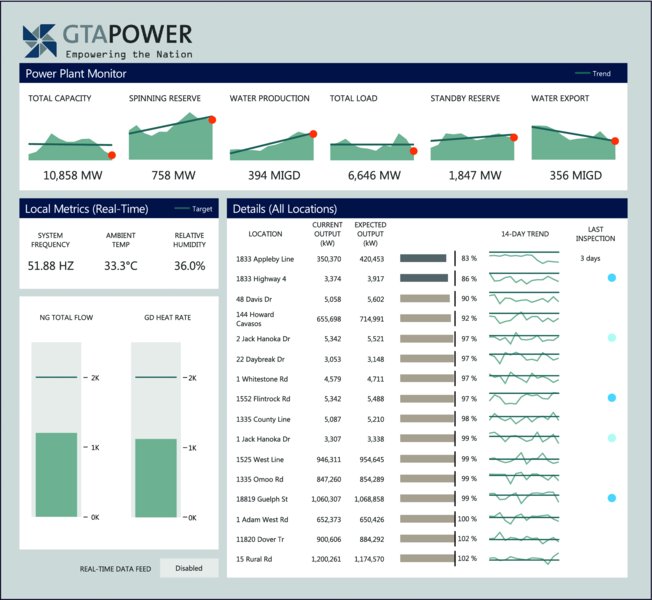
Wind and solar (GTA Power) dashboard.
Source: Images courtesy of Dundas Data Visualization, Inc. (www.dundas.com)
Dashboard Designer: Stas Kashepava
Organization: Dundas Data Visualization
Link: https://samples.dundas.com/Dashboard/fa1ee851-8049-457d-92a1-2e2e0c311991?vo=viewonly
Scenario
Big Picture
You are the manager of a power plant, and part of your job is to monitor consumption and output. You need to know if the output today is different from the last few days and how the output is trending. Certain things impact your production level, so you also follow real-time metrics for those variables.
You need to monitor different locations to determine if they are producing the expected output and if their production is changing over time. You also manage the routine inspections of these locations, so you need to know when the last inspection occurred and flag locations that were not inspected recently.
Specifics
- Your job is to create an overview dashboard to provide all of the listed information to the operational management team. The dashboard should be interactive to provide additional details and allow the users to drill down to the location level and see historical data.
- You need to show the data by the location of the installation. You need to show current output versus the expected output so that it is easy to see which locations ...
Get The Big Book of Dashboards now with the O’Reilly learning platform.
O’Reilly members experience books, live events, courses curated by job role, and more from O’Reilly and nearly 200 top publishers.

