Reading Candlesticks
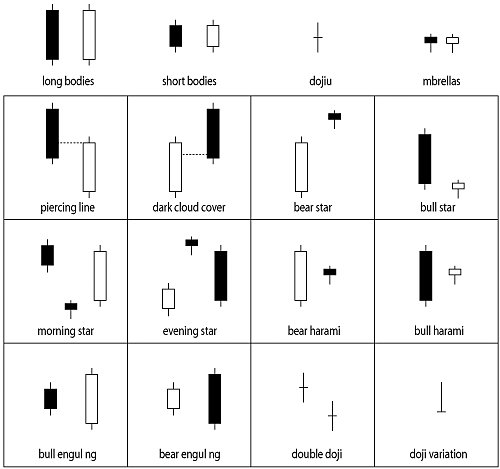
Like a bar chart, the daily candlestick line contains the open, high, low, and close for the market on a specific day. However, unlike a bar, the candlestick has a wide part that is called the “real body.” It represents the range between the open and close. When the real body is black (i.e., filled in), it means the close was lower than the open. If the real body is white (i.e., empty), it means the close was higher than the open. See the candlestick illustrations in Figure 33.1.
Figure 33.1. Candlesticks

The thin lines above and below the real body, which resemble the wicks of the candle, are called the “shadows.” The ...
Get Technical Analysis Plain and Simple: Charting the Markets in Your Language, Second Edition now with the O’Reilly learning platform.
O’Reilly members experience books, live events, courses curated by job role, and more from O’Reilly and nearly 200 top publishers.

