Chapter 6. Basic Mapping
Maps are a good way to visualize location-based data. Tableau recognizes geographical fields such as country and city, and automatically generates the latitude and longitude. This prevents users from having to manually look up coordinates or pay extra for this type of data.
6.1 Symbol Map
A symbol map allows you to show multiple measures on a single map. For example, you can use color and size for two separate measures.
Problem
You want to show every city by profit and sales.
Solution
-
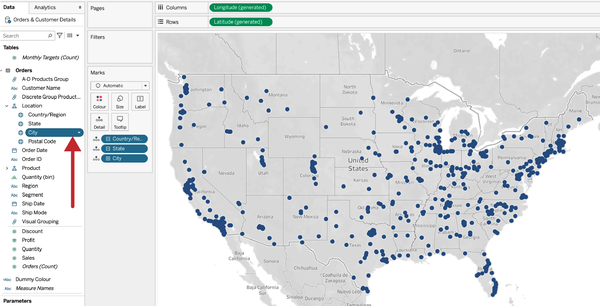
Double-click City from the Orders table. This will automatically create a map.

-

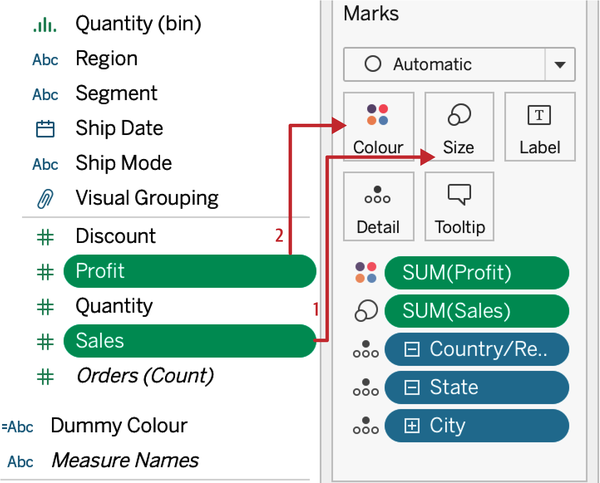
Drag Sales to Size (1) and Profit to Color (2):
-

You might also want to increase the size of the points. You can do this using Size on the Marks card:
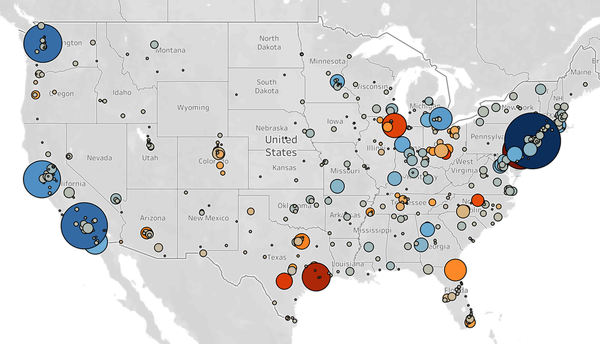
Your final view should look like this:

Discussion
Symbol maps are good for showing exact locations—for example, for smaller cities. You should also be careful which measure you use on the Size property. If your measure contains negative numbers, I don’t recommend using that field on Size, because you can’t accurately display a negative ...
Get Tableau Desktop Cookbook now with the O’Reilly learning platform.
O’Reilly members experience books, live events, courses curated by job role, and more from O’Reilly and nearly 200 top publishers.

