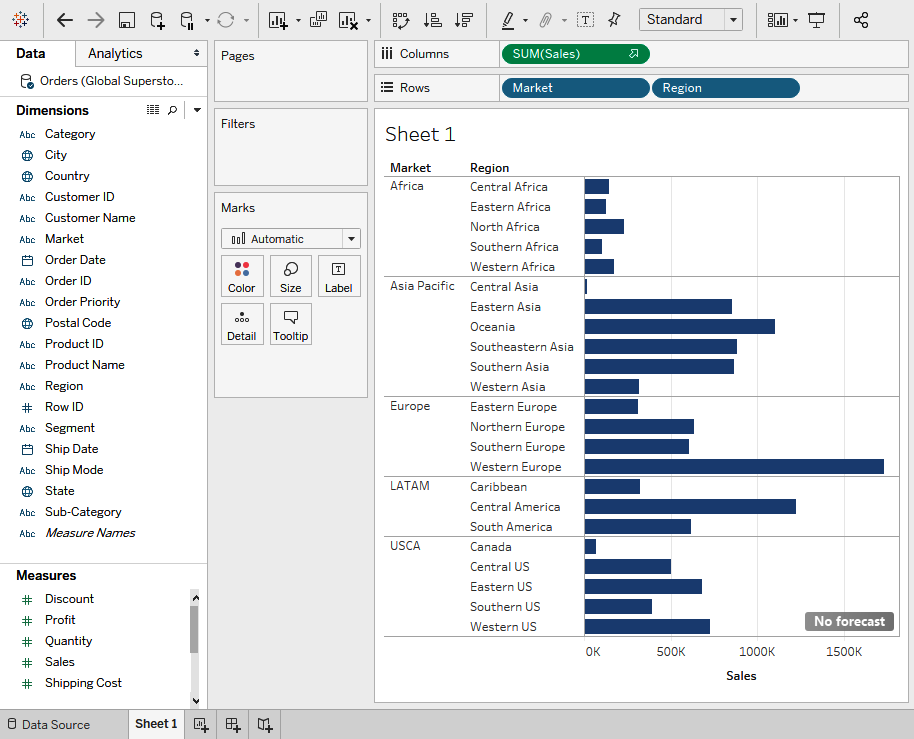
Placing fields in either the Columns or Rows shelves creates headers in the view. It is important to remember that visualizations are built using marks, which are just records in your data source. You can add multiple fields to both the Columns and Rows shelves. In the following example, Market and Regions are the rows by which sales are displayed (bar chart):

As fields are places on the shelves, Tableau will attempt to select the best chart type. In the preceding example, a bar chart was chosen to display sales by market and ...

