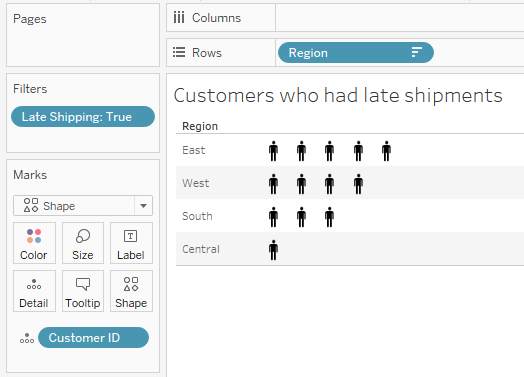
A unit chart can be used to show individual items, often using shapes or symbols to represent each individual. These charts can elicit a powerful emotional response, because the representations of the data are less abstract and more easily identified as representing something real. For example, here is a chart showing how many customers had late shipments for each region:
The view was created with the following techniques:
- The view is filtered where Late Shipping is true. Late Shipping is a calculated field that determines if it took more than 14 days to ship and order. The code is:
DATEDIFF('day', [Order Date], ...
