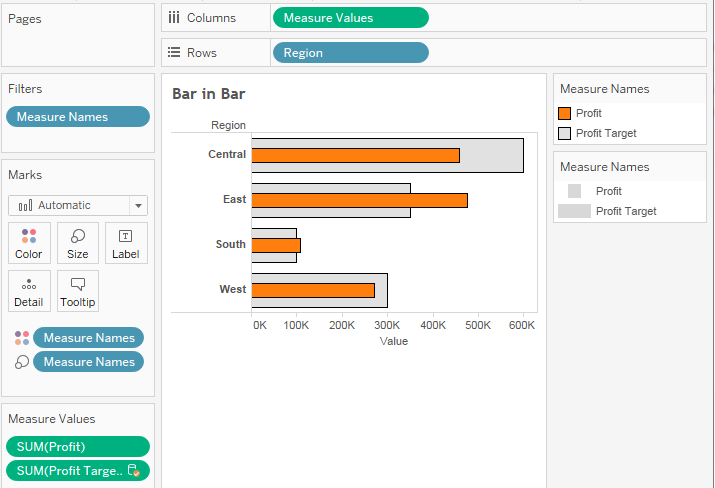
Another possibility for showing progress toward a goal is to use bar in bar charts, such as this:

To create this view, continue in the same workbook and follow these steps:
- Navigate to the Bar in Bar sheet.
- Drag and drop Profit from the Superstore Sales data source onto the horizontal axis in the view (which is the same as dropping onto the Columns shelf).
- Drag and drop Region onto Rows.
- Drag the Profit Target field from the Profit Targets data source and drop it directly onto the horizontal axis. Since you are dropping one measure (ProfitTarget) onto the same space (in this case, an axis) that was being used by another measure ...

