| ... -value | ||||
|---|---|---|---|---|
| Intercept | 37,846.149 | 4793.353 | 7.90 | < .0001 |
| Time | − 17.983 | 2.397 | − 7.50 | < .0001 |
| Quarter[Q1] | 54.863 | 35.225 | 1.56 | 0.1241 |
| Quarter[Q2] | 380.336 | 35.200 | 10.81 | < .0001 |
| Quarter[Q3] | 224.093 | 35.184 | 6.37 | < .0001 |
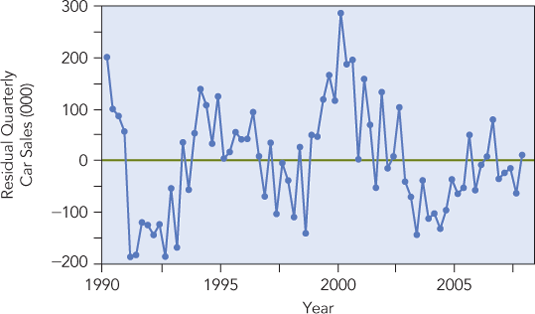
Check the conditions before considering inference. We cannot continue on to inference using this model. The timeplot of the residuals shows that this model does not meet the conditions of the MRM.

✗ Evidently independent. The model does not explain why sales were falling (it only follows the trend) and omits underlying causal variables. The preceding timeplot of the residuals shows a meandering pattern, and the Durbin-Watson statistic ...
Get Statistics for Business: Decision Making and Analysis, 3rd Edition now with the O’Reilly learning platform.
O’Reilly members experience books, live events, courses curated by job role, and more from O’Reilly and nearly 200 top publishers.

