Appendix A
Table A.1 Standard Normal Areas [Z is N(0,1)]
Figure A.1 ![]() gives the total area under the standard normal distribution between 0 and any point z0 on the positive z-axis (e.g., for z0 = 1.96, A(z0) = 0.475).
gives the total area under the standard normal distribution between 0 and any point z0 on the positive z-axis (e.g., for z0 = 1.96, A(z0) = 0.475).
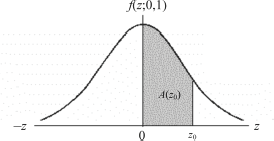

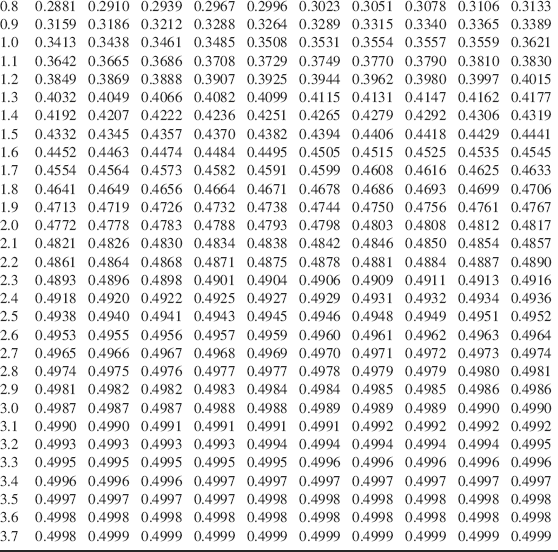
Table A.2 Quantiles of the t Distribution (T is tv)
Figure A.2 Given degrees of freedom v, the table gives either: (a) the one-tail tα,v value such that P(T ≥ tα,v) = α; or (b) the two-tail ![]() values for which
values for which ![]() (e.g., for v = 15 and α = 0.05, t0.05, 15 = 1.753 while t0.025,15 = 2.131).
(e.g., for v = 15 and α = 0.05, t0.05, 15 = 1.753 while t0.025,15 = 2.131).
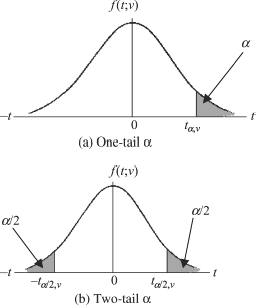
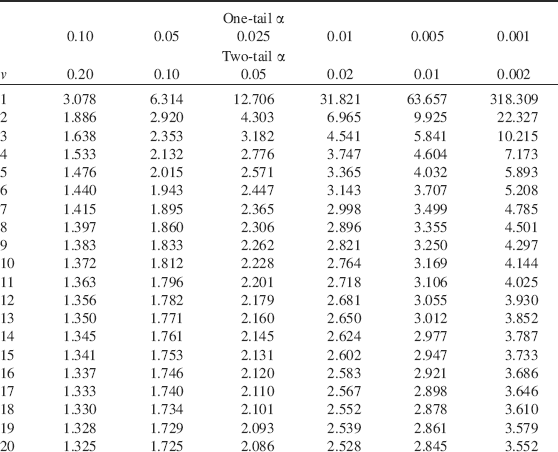
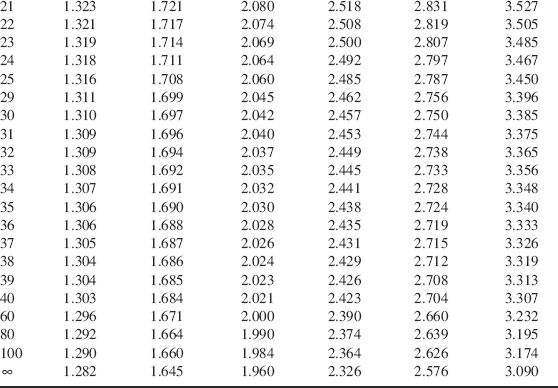
Table A.3 Quantiles of the Chi-Square Distribution (X is )
Figure A.3 For the cumulative probability ...

