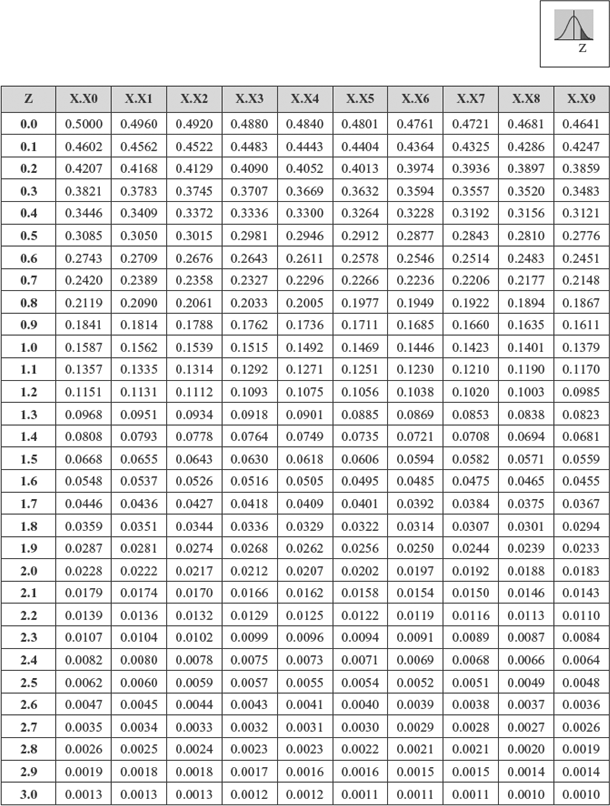
Table T1 Area Under Standard Normal Curve
(Values in the table is the shaded area)

Note: This standard normal table gives the percentage under one-half of the normal curve at different Z values. Thus, for Z = 0.0, the value in the table is 0.5 and not 1.0. Normal distribution is symmetrical. Thus the area to the left of Z = –1 equals 0.1587 which is the same as the area to the right of Z = 1.
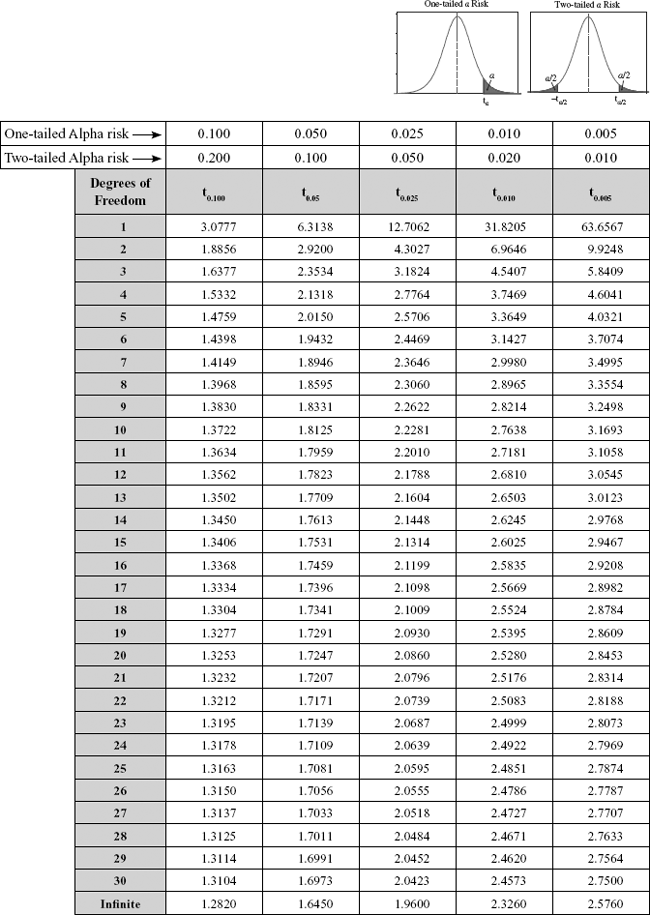
Table T2 t Distribution

Table T3A F Distribution
Fa, v1, v2 for α = 0.25
Table T3B F Distribution
Fa, v1, v2 for α = 0.10
Get Six Sigma for Business Excellence: Approach, Tools and Applications now with the O’Reilly learning platform.
O’Reilly members experience books, live events, courses curated by job role, and more from O’Reilly and nearly 200 top publishers.

