10Data Output
Output is very important in analysis to show the results of data science to stakeholders. It can primarily be Excel, Powerpoint, and Word documents for data analysis. With the advent of cloud and collaboration tools, there are many ways to communicate the intermediate stages of data analysis. The following shows ways to show output in R and SAS.
10.1 Data Output in SAS
There are two ways:
- Proc Export‐ Proc Export can export data in many formats
Here, replace will replace an earlier file with same name
- ODS
ODS stands for output delivery system. It is used to format the output of a SAS program. We can output data by putting output print within ODS HTML and ODS HTML CLOSE. Here we output the PROC Means of a dataset to a different object and print it to an excel file.
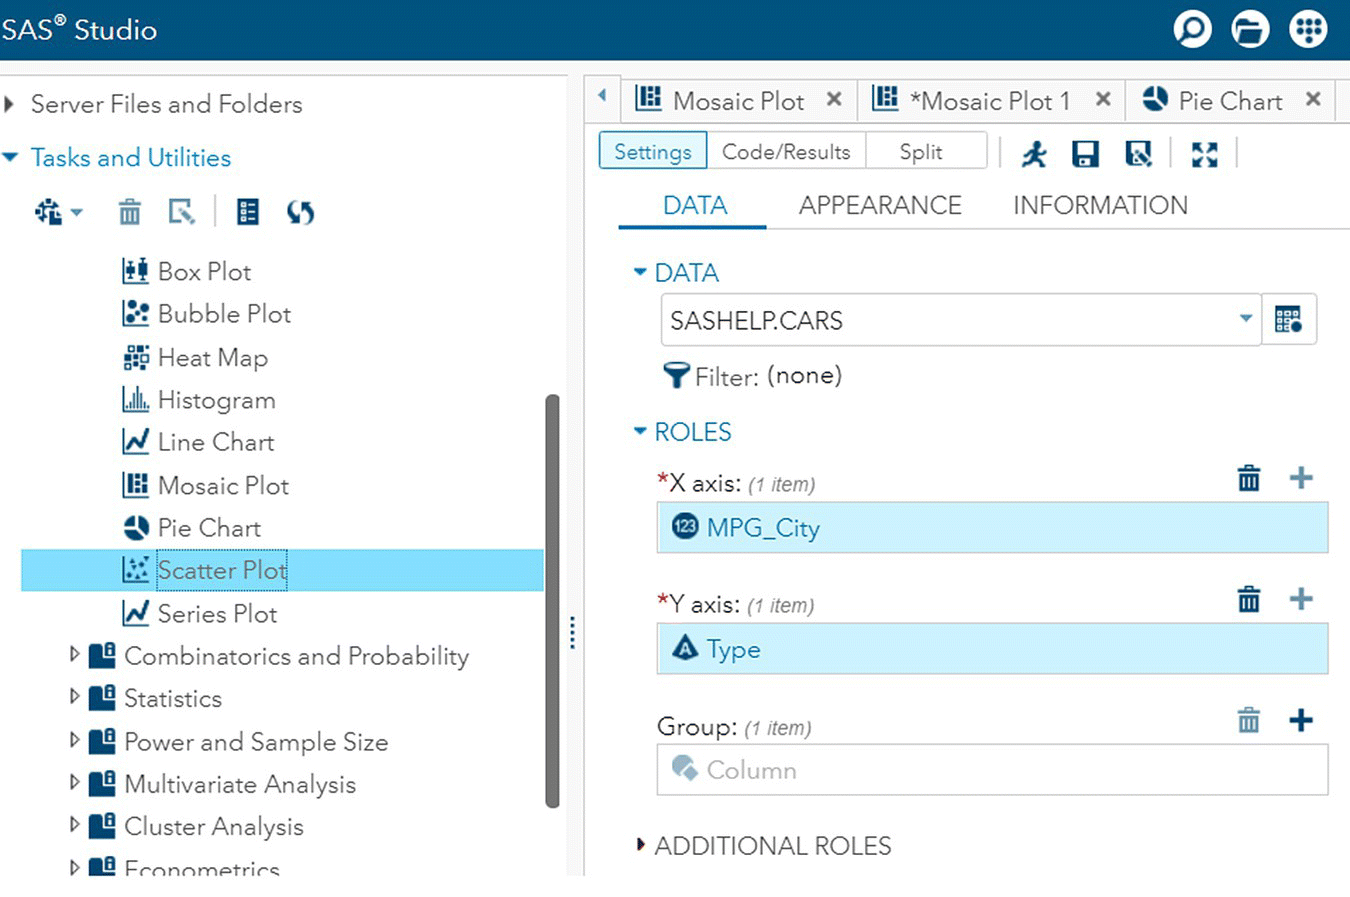
- Images

Figure 10.1 Creating plots in SAS.
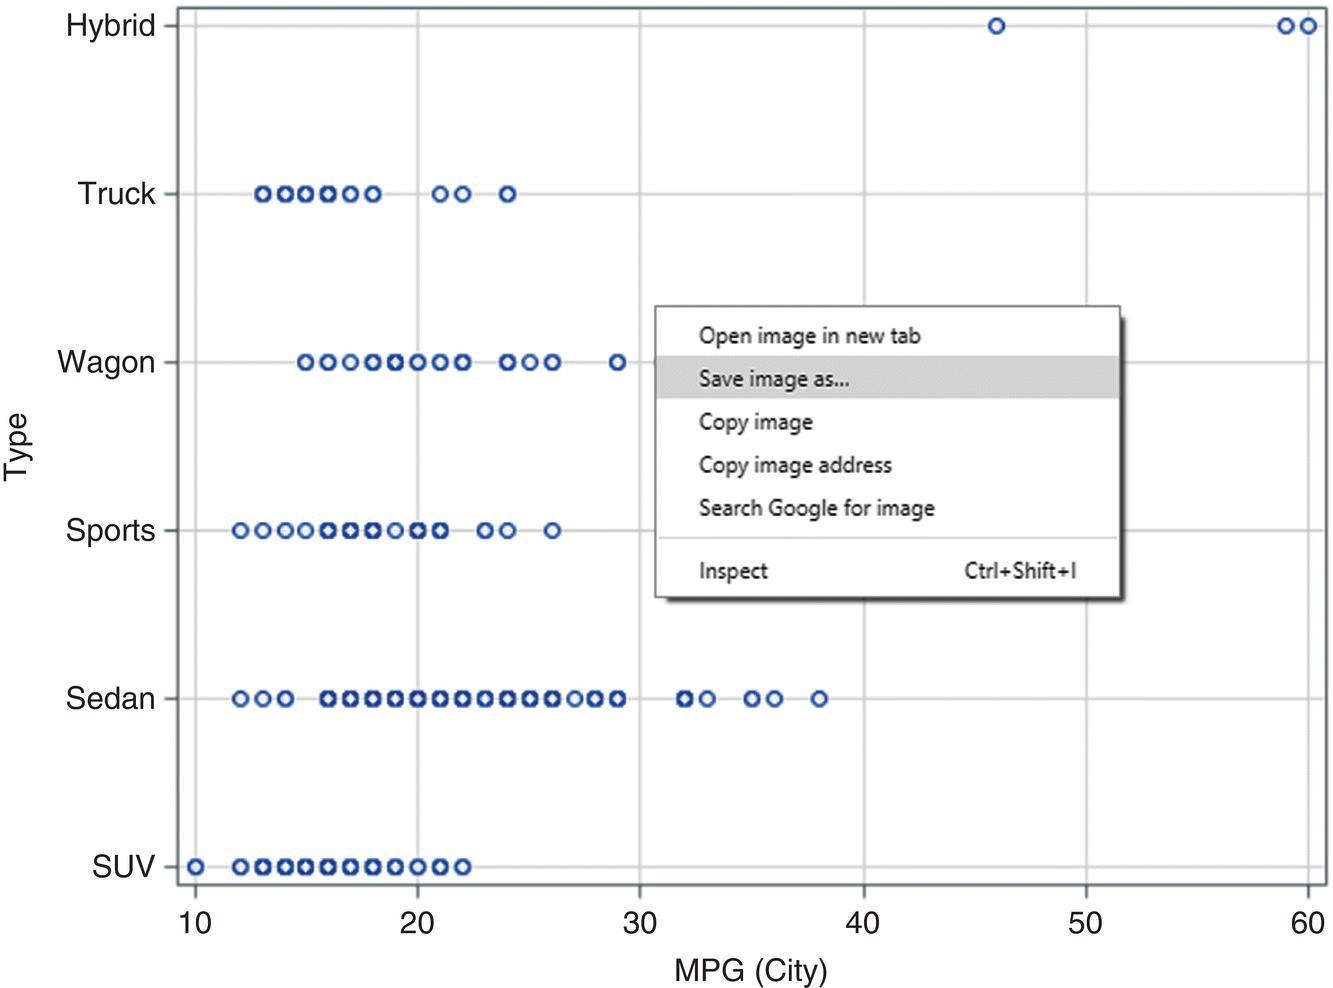
Output is in the form of an HTML page which can be saved.

Figure 10.2 HTML output plot in SAS.
10.2 Data Output in R
Here we change a working directory ...
Get SAS for R Users now with the O’Reilly learning platform.
O’Reilly members experience books, live events, courses curated by job role, and more from O’Reilly and nearly 200 top publishers.

