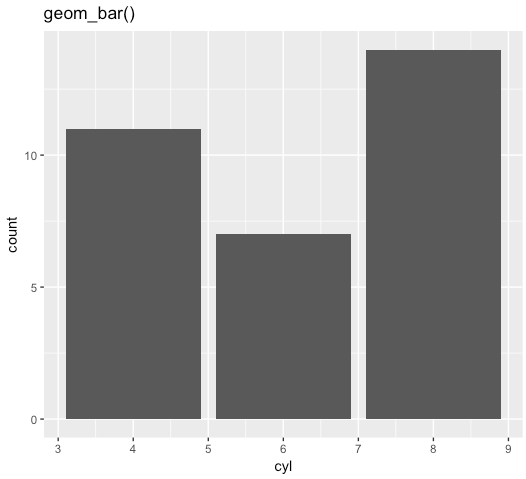
For one categorical or factor variable, you can create a bar chart. We can create a bar chart of the cyl variable of mtcars using the following code:
#using geom_bar()ggplot(mtcars, aes(cyl)) + geom_bar()

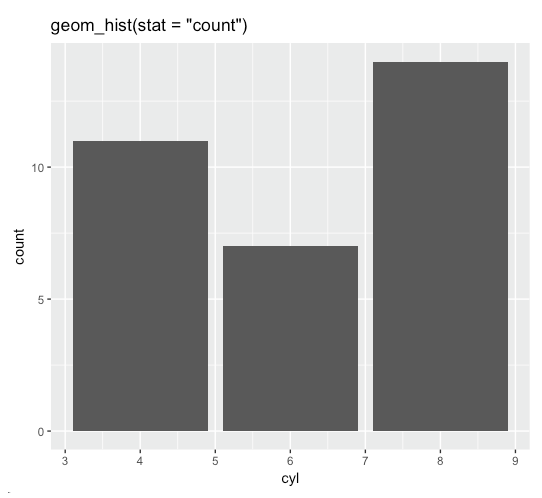
One fun fact is that we can actually create bar charts with the geom_histogram() call as well, by including stat = "count", as follows:
#using geom_histogram() and statggplot(mtcars, aes(cyl)) + geom_histogram(stat = "count")
You can ignore the warning it will throw; this creates the exact same bar chart:


