library(dplyr)library(nycflights13)not_cancelled<-flights|>filter ...
Chapter 6. Workflow: Scripts and Projects
This chapter will introduce you to two essential tools for organizing your code: scripts and projects.
Scripts
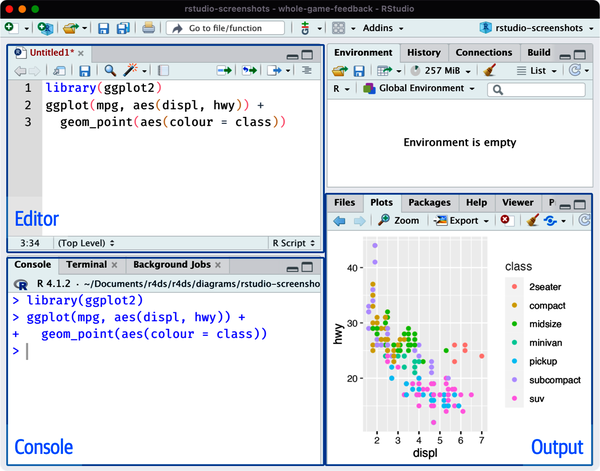
So far, you have used the console to run code. That’s a great place to start, but you’ll find it gets cramped pretty quickly as you create more complex ggplot2 graphics and longer dplyr pipelines. To give yourself more room to work, use the script editor. Open it by clicking the File menu, selecting New File, and then selecting R script, or using the keyboard shortcut Cmd/Ctrl+Shift+N. Now you’ll see four panes, as in Figure 6-1. The script editor is a great place to experiment with your code. When you want to change something, you don’t have to retype the whole thing; you can just edit the script and rerun it. And once you have written code that works and does what you want, you can save it as a script file to easily return to later.

Figure 6-1. Opening the script editor adds a new pane at the top left of the IDE.
Running Code
The script editor is an excellent place for building complex ggplot2 plots or long sequences of dplyr manipulations. The key to using the script editor effectively is to memorize one of the most important keyboard shortcuts: Cmd/Ctrl+Enter. This executes the current R expression in the console. For example, take the following code:
Get R for Data Science, 2nd Edition now with the O’Reilly learning platform.
O’Reilly members experience books, live events, courses curated by job role, and more from O’Reilly and nearly 200 top publishers.

