- Before getting into non-linear manifolds, let's analyze principal component analysis on the occupancy data:
# Setting-up principal component analysis pca_obj <- prcomp(occupancy_train$data, center = TRUE, scale. = TRUE) scale. = TRUE)
- The preceding function will transform the data into six orthogonal directions specified as linear combinations of features. The variance explained by each dimension can be viewed using the following script:
plot(pca_obj, type = "l")
- The preceding command will plot the variance across principal components, as shown in the following figure:
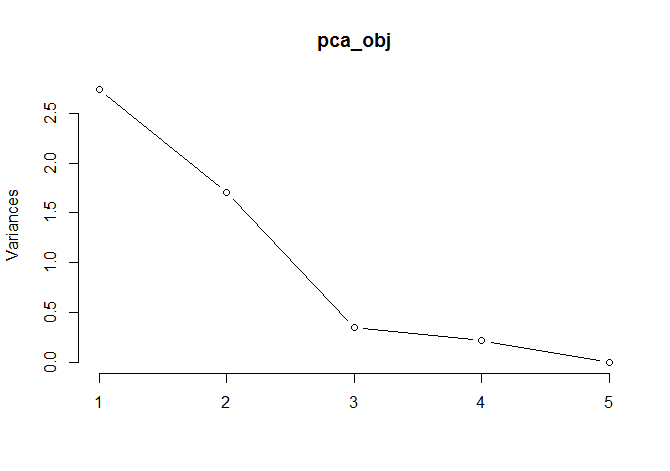
- For the occupancy dataset, ...

