Setting plot background colors
The default background color of all plots in R is white, which is usually the best choice as it is least distracting for data analysis. However, sometimes, we might wish to use another color. We will see how to set background colors in this recipe.
Getting ready
All you need to try out in this recipe is to run R and type the recipe in the command prompt. You can also choose to save the recipe as a script so that you can use it again later on.
How to do it...
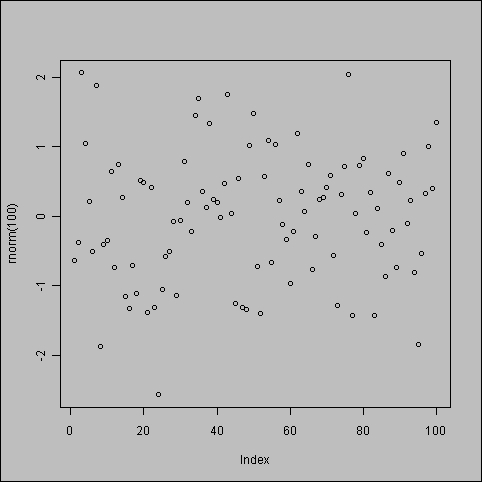
To set the plot background color to gray, we use the bg argument in the par() command:
par(bg="gray")
plot(rnorm(100))
How it works...
The bg argument of the par() command ...
Get R: Data Analysis and Visualization now with the O’Reilly learning platform.
O’Reilly members experience books, live events, courses curated by job role, and more from O’Reilly and nearly 200 top publishers.

