M6.2 Slope of a Nonlinear Function
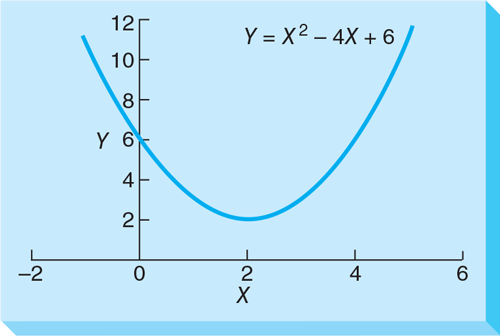
Figure M6.2 provides a graph of the function

Figure M6.2 Graph of Quadratic Function
Notice that this is not a straight line. To determine the slope of a curve at any point, we find the slope of a line tangent to the curve at this point. For example, if we wish to find the slope of the line when we find a line that is tangent at that point. To find the slope of a line, we use Equation M6-2, which requires us to have two points. We want the slope ...
Get Quantitative Analysis for Management, 13/e now with the O’Reilly learning platform.
O’Reilly members experience books, live events, courses curated by job role, and more from O’Reilly and nearly 200 top publishers.

