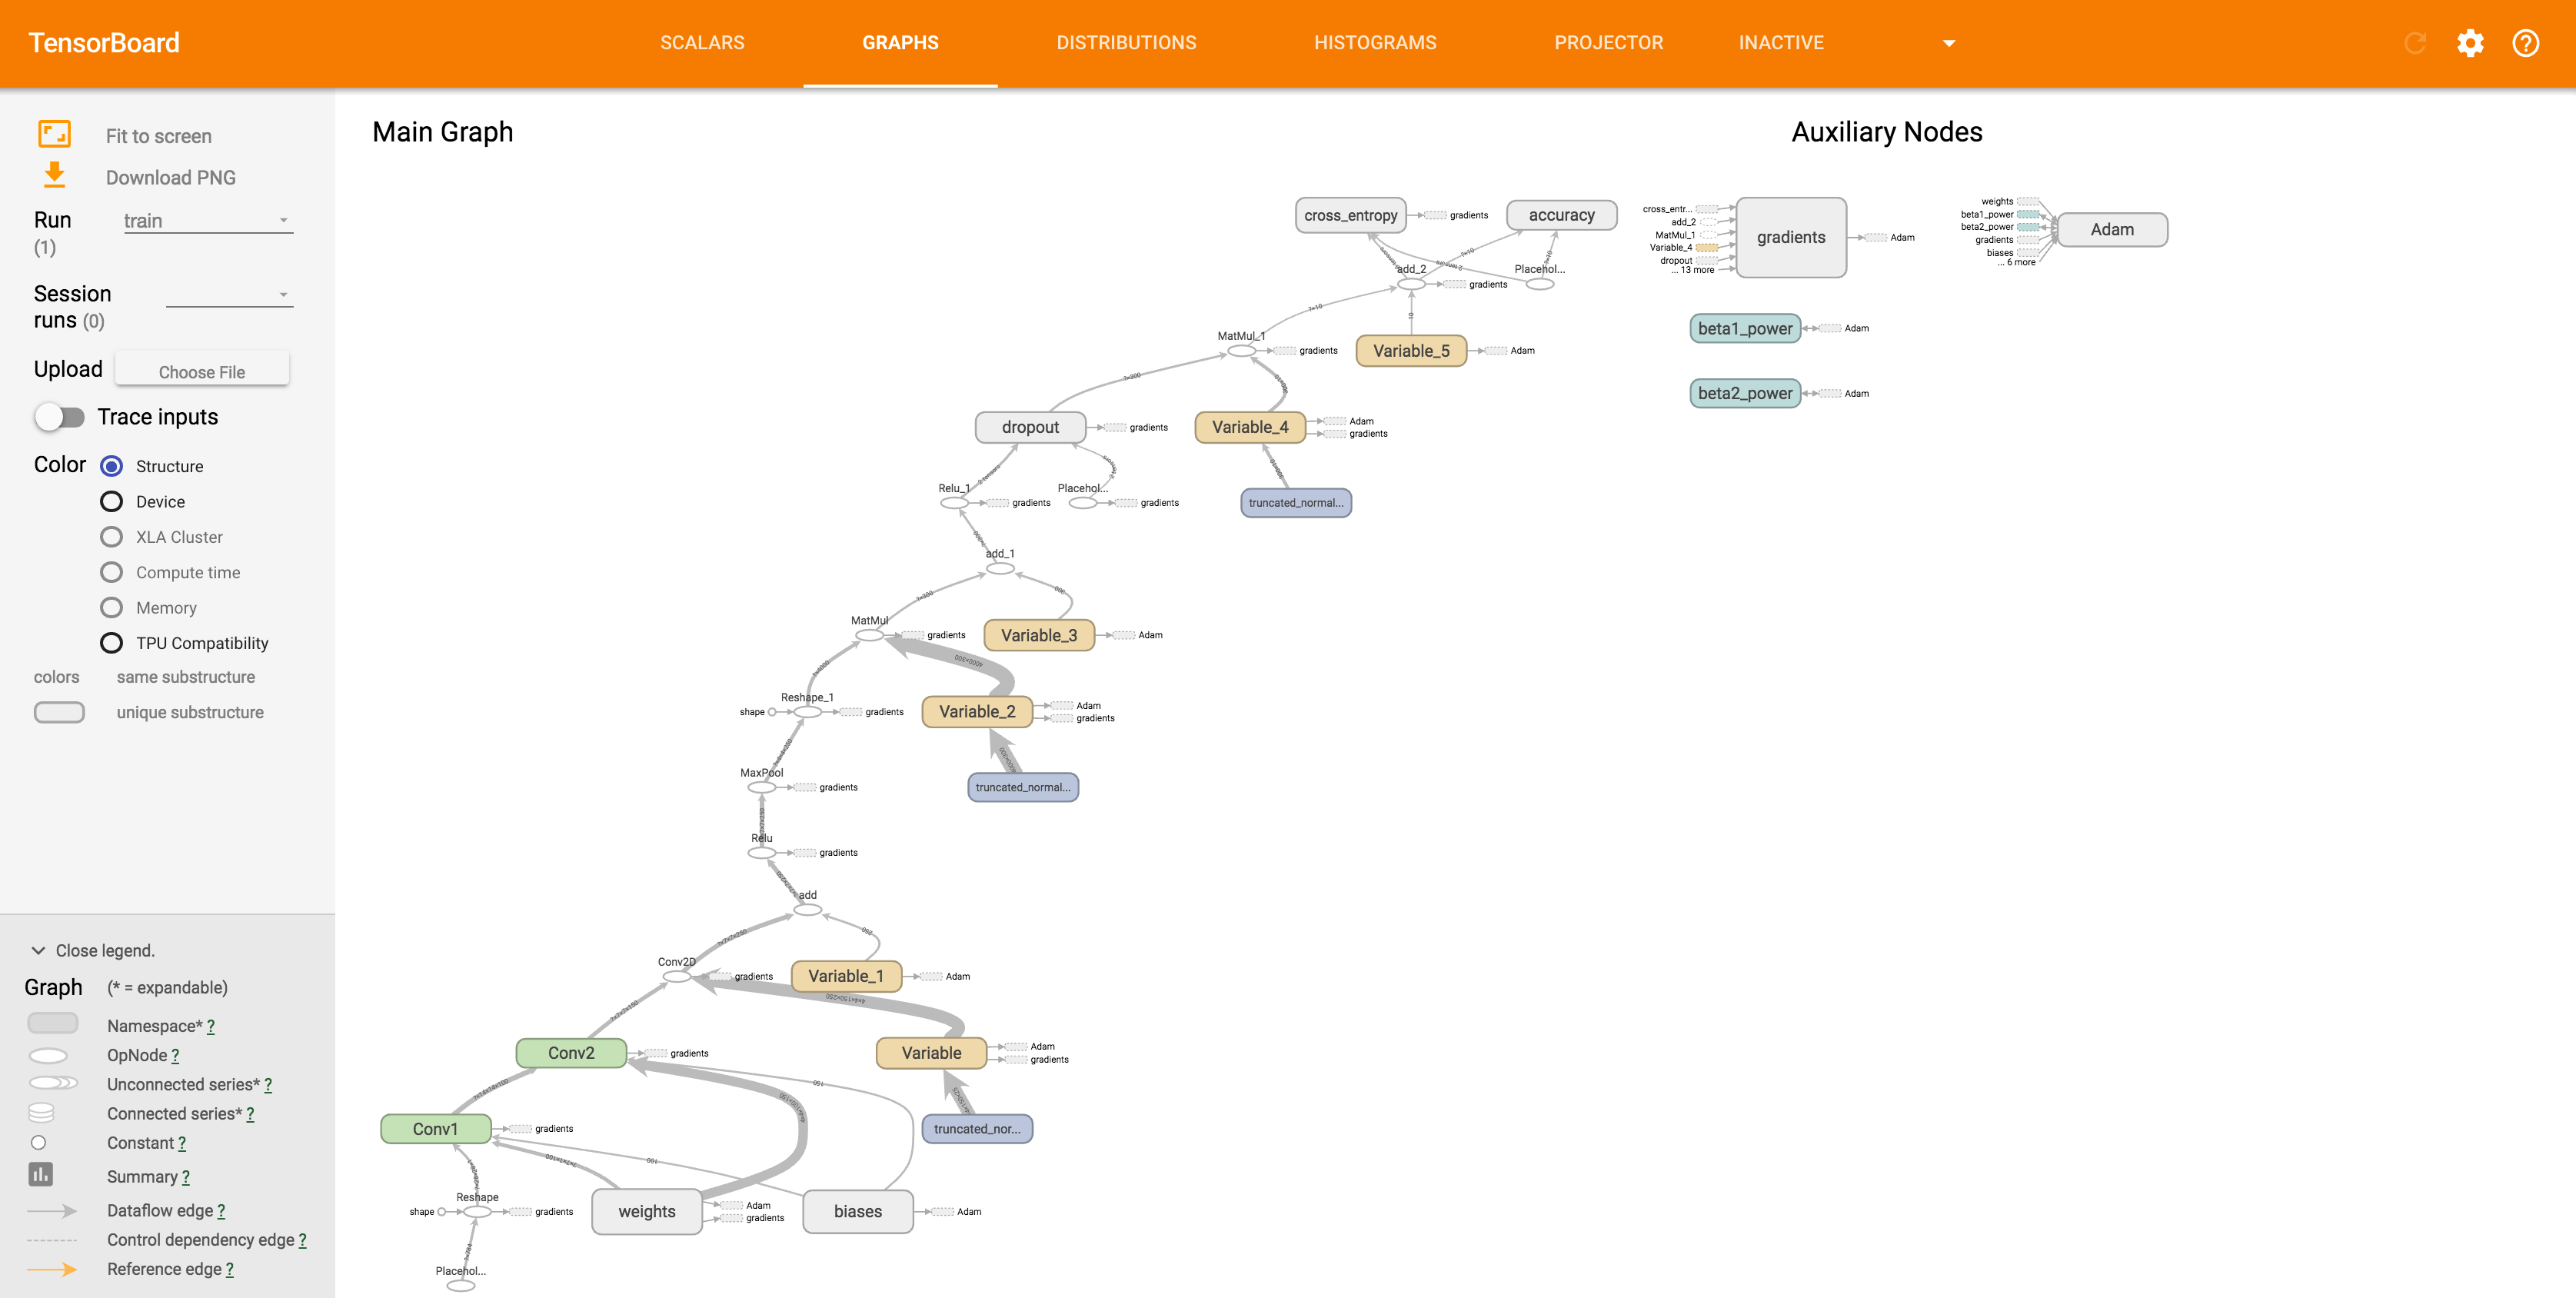
As we have demonstrated throughout the book, it is easy to output a simple summary of our network architecture when using the Keras framework. However, with TensorBoard, we are able to visualize our network architecture with different settings. In the following figure, you can see an example of such a visualization:


